Soft gamma-ray background and light Dark Matter annihilation
Abstract
The bulk of the extragalactic background between 10 keV and 10 GeV is likely to be explained by the emission of Seyfert galaxies, type Ia supernovae, and blazars. However, as revealed by the INTEGRAL satellite, the bulge of our galaxy is an intense source of a 511 keV gamma-ray line, indicating the production of a large number of positrons that annihilate. The origin of the latter is debated, and they could be produced, in particular, by the (- or -wave) annihilation of light Dark Matter particles into . In any case, the cumulated effect of similar sources at all redshifts could lead to a new background of hard -ray and soft gamma-ray photons. On the basis of the hierarchical model of galaxy formation, we compute analytically the SNIa contribution to the background, and add it to Seyfert and blazars emission models. Confronting these expected contributions to observation, we find that any extra contribution to this unresolved background around 511 keV should be lower than about 4 keV cm s sr-1. We also estimate analytically the extragalactic background due to Dark Matter annihilation, increasing the accuracy of the earlier computations. Indeed, we take into account the large positron escape fraction from low mass dark matter halos, unable to confine a dense and magnetized interstellar medium. Our new background estimate turns out to be one order of magnitude lower so that the hypothesis of a light Dark Matter candidate remains compatible with the observed extragalactic background for a wider range of particle masses and cross-sections.
pacs:
95.35.+d, 95.85.Nv, 95.85.Pw, 97.60.BwI Introduction
The cosmic gamma-ray background (CGB) between keV and GeV has been measured by several gamma-ray satellites (HEAO, SMM, COMPTEL and EGRET) (Zdziarski, 1996; Strong et al., 2004). Below 100 keV, it is believed that the main contribution comes from Seyfert galaxies (Zdziarski, 1996) 111It is worth noting, in addition, that recent deep INTEGRAL observations (Krivonos et al., 2005) of the Coma region suggest that the cosmic ray background above 20 keV cannot be explained in terms of obscured Seyfert galaxies.. Above 10 MeV, a simple model for blazars reproduces both the amplitude and the slope of the data (Comastri, 1999). In the intermediate energy range, however, another type of sources is needed, since blazar spectra show a clear break near 10 MeV and the cosmological gamma-ray background from Seyfert galaxies falls off above about 100 keV (see Fig. 1). As discussed by several authors (Watanabe et al., 1999; Strigari et al., 2005; Ruiz-Lapuente et al., 2001), type Ia supernovae could make a significant contribution in this energy range, which we shall evaluate in Section 2.

Furthermore, the recent observation, by the INTEGRAL satellite, of a 511 keV diffuse emission line from the galactic bulge (Knodlseder05, ) shows that electron-positron annihilation are taking place there with a very large rate s-1. Such a high rate is difficult, if not impossible, to impute to astrophysical objects, and the source of these positrons in the bulge is subject to intense debate. This emission from the bulge of the Milky Way could be the signature of light Dark Matter particles annihilating into boehmfayet ; Fayet (2004), the positrons eventually annihilating with electrons encountered in the interstellar medium boehmetal . In any case, if one extrapolates this diffuse emission to all other galaxies in the Universe, the integrated flux could make a significant additional contribution to the hard -ray and soft gamma-ray background.
Since the potential implications of such an hypothesis for particle physics and cosmology are very important, we want to test here its validity or at least its consistency, as far as the cosmological gamma-ray background is concerned. Using a recent model of galaxy formation (Rasera and Teyssier, 2005), we compute self-consistently the gamma-ray background coming from both type-Ia supernovae (adding Seyfert-galaxies and blazars), and annihilating positrons from light Dark Matter halos. We follow in this respect the earlier work of Ahn & Komatsu Ahn and Komatsu (2005), who were the first to compute this background, assuming, like them, however, that positrons annihilate “on the spot” in all Dark Matter halos in the Universe. These authors explored various scenarios for the internal structure of Dark Matter halos and analyzed how these various models affect the amplitude of the gamma-ray background.
In the present paper, we would like to go one step further, and explicitly take into account the role of baryons in the process of positron confinement and annihilation. This process is indeed possible only if the parent halo contains enough baryons (and therefore also electrons) to host a dense, magnetized, interstellar medium. This is a necessary condition for the “on the spot” approximation to be valid. Since low mass halos are unable to host enough baryons in a cold and magnetized disc (Rasera and Teyssier, 2005), the escaping positron mean free path increases dramatically. To compute the positron escape fraction and their propagation in the expanding background, a complex diffusion study would be necessary. As a first order approximation we shall assume that the positron escape fraction goes from zero to one below the critical mass for a Dark Matter halo to host a galaxy, as computed in (Rasera and Teyssier, 2005), and that these escaping positrons never annihilate.
The outline of this article is as follows. In Section 2, we estimate the contribution of SNIa to the gamma-ray background, adding it to that of Seyfert galaxies and blazars (at lower and higher energies, respectively). The difference with the observed spectrum provides an upper limit on any additional contribution such as the one due to annihilating positrons, that could come from light Dark Matter particle annihilation. In Section 3, we calculate the diffuse cosmological background induced by all Dark Matter halos in the Universe, taking into account that positrons cannot annihilate in small mass halos, and compare it to the previous calculation performed by Ahn & Komatsu Ahn and Komatsu (2005). In Section 4, we present the gamma-ray background constraints on the annihilation cross-sections and the masses of light Dark Matter candidates. We summarize our main conclusions in Section 5. In an Appendix, we estimate for calibration purpose, and confront with SPI/INTEGRAL observations, the 511 keV emission from the galactic bulge. We consider various annihilation cross-sections (depending on whether they are - or - wave dominated) and the corresponding halo Dark Matter density profiles.
II Diffuse gamma-ray background from SNIa
The type Ia supernovae contribution to the gamma-ray background depends primarily on the star formation history in the Universe, which, in this paper, is derived from a new self-consistent model of galaxy formation Rasera and Teyssier (2005). This analytical model predicts the cosmological evolution of the four main baryon phases in the Universe: diffuse intergalactic gas, hot gas, cold gas in galaxies and stars. These theoretical predictions were validated with high-resolution cosmological simulations using the RAMSES (Teyssier, 2002) and GADGET codes (Springel and Hernquist, 2003). They also reproduce the observed amount of cold gas in the Damped Lyman-Alpha systems (Somerville et al., 2001; Pei et al., 1999) and the observed Cosmic Star Formation Rate (Hughes et al., 1998; Steidel et al., 1999; Flores et al., 1999; Glazebrook et al., 1999; Yan et al., 1999; Massarotti et al., 2001; Giavalisco et al., 2004; Dahlen et al., 2004) (see Fig. 2), which is of prime interest here. The model particularly emphasizes the important cosmological role of the minimal mass for a halo to host galaxies, .
We shall use it to, first, compute the SNIa gamma-ray background, and, also, to evaluate the new background that could be attributed to the annihilation of positrons, possibly generated in annihilating Dark Matter halos. This internal consistency allows us to perform a fair comparison between the two types of gamma-ray sources.

In the general case, the background intensity is given by
| (1) |
with the comoving emissivity at redshift , or time .
The gamma-ray lines from SNIa result from the explosive synthesis of radioactive 56Ni nuclei, decaying successively into 56Co and 56Fe. The comoving emissivity from SNIa may be expressed as
| (2) |
with the comoving star formation rate at time from our analytical model (see Fig. 2), denoting the average delay between star formation and SNIa explosion. is the number of SNIa per unit of stellar mass formed, the mass of Nickel produced and the average spectrum per Nickel nucleus. We take Gyr, M (so that the resulting SNIa rates be within the 2 error bars of observed rates (Dahlen et al., 2004)), M⊙, and the spectrum as computed in Nomoto et al. (1984).
The resulting extragalactic background spectrum from SNIa is presented in Fig. 1. It shows a bump in the range 300 keV up to 3 MeV, at a level which turns out to be close to the predicted contributions from Seyfert galaxies and blazars. This contribution, in agreement with the SNIa contribution from Strigari et al. (2005), is slightly higher than their preferred model 222Our model is close to the upper bound of Fig. 2 in Strigari et al. (2005), because our star formation history is slightly more efficient, as suggested by recent observations (Rasera and Teyssier, 2005).
Altogether the resulting evaluation from known astrophysical sources reproduces reasonably well the observed extragalactic background below keV and above MeV. However, in the range from keV to MeV the three contributions fall short of explaining the bulk of the Cosmic Gamma-Ray background (as emphasized by Strigari et al. (2005)). Particularly, in the keV- keV range of interest in this article, the sum of the three contributions appears to be lower with a difference of the order of 4 keV cm-2 s-1 sr-1. This sets an upper limit on a possible Dark Matter annihilation signal.
III Diffuse background from cosmological halos
III.1 Diffuse background
The diffuse background is simply the sum of the redshifted emissions from positron annihilation in all cosmological halos, in principle at all redshifts (Eq. 1). The comoving emissivity can be computed by summing up the individual halo emissivities
| (3) |
where is the minimal mass for emitting halos. The luminosity per halo integrated up to the radius of the halo is
| (4) |
and is the Press-Schechter (Press and Schechter, 1974) mass function for cosmological halos. Considering positron annihilation “on the spot”, the volume emissivity is given by
| (5) |
with the Dark Matter mass density profile, is the annihilation cross-section, the factor being present only in the case of self-conjugate Dark Matter particles 333For non self-conjugate Dark Matter particles Eq. (5) gets replaced by and one can generally assume equal densities for Dark Matter particles and antiparticles, so that . .
Positronium annihilation introduces a specific emission spectrum , with 25% of the energy injected in the 511 keV line, and the remaining 75% spread over a 3 continuum.
III.2 Dark matter density profile
The mass distribution in each Dark Matter halo is in fact quite uncertain. Ahn and Komatsu (2005) have explored a wide range of halo density profile parameters. In this paper, we restrict ourselves to Dark Matter distribution parameters at face value, as suggested by - body simulations, based on the following general fitting formula
| (6) |
where with the scaling radius corresponding to the concentration parameter (typically between and depending on halo mass and redshift). , and control the slope respectively for small (), intermediate () and large radii ().
The concentration parameter defines whether halos are rather peaked () or shallow (). Here again the mean value as a function of redshift and halo mass is given by a fit on cosmological simulations (Bullock et al., 2001),
| (7) |
with the collapse redshift given by , being the non-linear mass at a redshift . This formula is valid only for halos greater than M⊙. The behaviour of the concentration parameter for smaller halo masses, unresolved by numerical simulation, is totally unknown.
The slope at the center of Dark Matter halos is thought to be between and . We therefore consider two extreme dark matter profiles as given by Navarro, Frenk and White (Navarro et al., 1997) (, and ) and Moore (Moore et al., 1999) (, and ). Note however that both density profiles saturate at very low radius when due to self-annihilation ( is the dark matter numeric density and is the age of the universe).
III.3 Annihilation cross-section
The relic abundance of Dark Matter particles depends on their decoupling temperature, which is a fraction of their mass (i.e. with 16 to 20 depending on ) and is, roughly, inversely proportional to their annihilation cross-section at freeze-out. The values required for a correct abundance, corresponding to , are then, for such light particles, of the order of a few (up to 10) picobarns (corresponding to cm3 s-1) (boehmfayet, ; Fayet, 2004), depending on whether they are self-conjugate or not, and on the possible velocity-dependence of their annihilation cross-section at freeze-out.
Such values are in any case rather large compared to ordinary weak-interaction cross-sections, especially when dealing with light particles. This necessitates an unusual, more powerful, annihilation mechanism, that could result from the exchanges of a new light neutral gauge boson , or, in the case of spin-0 Dark Matter particles, from the exchanges of new heavy (e.g. mirror) fermions boehmfayet ; Fayet (2004); boehmetal ; Umirror .
A rather large annihilation cross-section could lead to an excessive continuum of gamma-ray photons at various energies (depending on ). Cross-sections which behave, at least to a large extent, proportionally to (-wave annihilation), may therefore be preferred boehmes , especially at lower . The residual annihilation of Dark Matter particles in bulges of spiral galaxies or in ellipticals would then include a suppression factor that could be, in the pure -wave case, as strong as . Furthermore, and independently of the above argument, lighter Dark Matter masses tend to be preferred, to avoid excessive gamma-ray production as compared to production, in our galaxy Fayet (2004); beacom .
We shall therefore consider annihilation cross-sections parametrized as , with cm3 s-1 at freeze-out (for a self-conjugate particle – or twice this value, for a non self-conjugate one). And explore in particular, for low-velocity halo particles, the two extreme situations (-wave) and (-wave annihilation). The resulting emission profiles deduced from a given Dark Matter profile are computed from (cf. Eq. 5 for a self-conjugate particle 444For non self-conjugate Dark Matter particles, the in Eq. 5 gets replaced by or simply while the annihilation cross-section gets doubled, so that the expected emissivity and resulting emission profile remain the same.). See also the Appendix for further comments.
Note that for the pure -wave cross-section, the emissivity now depends on the Dark Matter 3D velocity dispersion asc . We therefore compute as a function of the radius by solving the Jeans equation for a NFW or Moore potential. The resulting emission profiles turns out to be less peaked than for a pure -wave cross-section.
III.4 Role of the baryons

This rather standard approach has been applied to compute the soft gamma-ray background in Ahn and Komatsu (2005), integrating individual halo emissivity over the Press & Schechter distribution (given by Eq. 3), using as lower bound of the integration interval the maximum between the Dark Matter free-streaming and the Dark Matter Jeans masses. This leads to a minimal mass () equal to a fraction of solar mass. As a consequence the comoving gamma-ray emissivity is dominated by the cumulated emission of numerous small mass halos (if one uses the concentration parameters given by Eq. 7 555Moreover the concentration parameters of these small halos are quite uncertain because they are smaller than the numerical resolution of cosmological simulations.).
However, as we have already discussed, small mass halos are unable to retain gas and annihilate positrons, and therefore cannot contribute to the gamma-ray background in which we are interested. We take into account the crucial role of the baryons (and associated electrons, and magnetic fields) in confining and annihilating the Dark Matter positrons. This trapping can be achieved only if both the density of the interstellar medium and the galactic magnetic field are sufficient. Indeed cosmological simulations of galaxy formation in the hierarchical framework of structure formation show that baryons cannot collapse and form high-density centrifugally-supported gas discs in halos having a mass lower than a minimal value h-1 M⊙.
This critical mass threshold is a key ingredient of the current galaxy formation theory. Gnedin showed that the fraction of baryons decreases strongly in halos smaller than the so-called filtering mass (Gnedin, 2000), as a consequence of the non-zero temperature of the intergalactic medium which prevents gas from collapsing into too small Dark Matter halos. Hoeft et al. (2004) also showed that the halo mass must be greater than the minimal cooling mass; if not, the fraction of baryons is high but galaxies cannot form because cooling is inefficient. The resulting minimal halo mass for galaxy formation is then the maximum between the minimal cooling mass and the filtering mass, as computed in (Rasera and Teyssier, 2005). The evolution of this minimal mass with redshift is shown in Fig. 3. It is of course much larger than the one used in (Ahn and Komatsu, 2005).
As computing accurately the escape fraction of positrons as a function of halo mass is beyond the scope of this paper, we shall consider here, for simplicity, that below , essentially all positrons escape the halos (and we neglect their contribution to the background), while above , confinement is supposed to be efficient and all positrons are taken to contribute. Furthermore, the contribution from diffuse baryons in the Universe (baryons which are not in collapsed halos) is negligible in this range of wavelength because the annihilation time scale is larger than the age of the Universe 666Indeed, direct annihilation of positrons having escaped out of small halos as well as annihilation through positronium in the intergalactic medium are negligible (for ) due to the very low density of the latter (about cm-3).. Note that, while the “on the spot” approximation, used by Ahn & Komatsu (Ahn and Komatsu, 2005) for the whole mass range, leads, in our opinion, to an overestimation of the diffuse background, our approach, though more accurate, should lead to an underestimation of the background level.

Fig. 4 illustrates the distribution of comoving positron emissivity as a function of halo masses for different redshifts. The comoving emissivity is dominated by small mass halos. However, only a small fraction of the halos contains enough gas and magnetic field for the production of gamma-rays: altogether, only a fraction of about 10 % of the emitted positrons are converted into photons. As a consequence, our computation of the gamma-ray background leads to a result about 10 times smaller than the one evaluated by Ahn and Komatsu (2005).
More precisely, we have computed the soft gamma-ray background for direct annihilation with a -wave cross-section, a NFW Dark Matter density profile and a particle masse MeV in the two different cases : dark matter-based minimal mass as in (Ahn and Komatsu, 2005) and baryon-based minimal mass as in the present paper. Fig. 5 illustrates the decrease by a factor of 10 using our new approach. Thus, if we would like to reach the same level of background, we would have to divide the particle mass by a factor of .
Note that the spectral shape is also modified. The spectrum declines at low energy because it corresponds to high redshift where halos greater than the minimal mass for galaxy formation becomes rare. Note that in Ahn and Komatsu (2005), identical results were recovered for the same Dark Matter particle mass, using rather extreme values for the halo concentration parameter . Recall that here we consider halo concentration parameters only at face value, as predicted by -body simulations, but we take into account baryon physics as part of the annihilation mechanism.

III.5 Calibration on Milky Way
As we have seen in the previous sections, the diffuse gamma-ray background depends on three main quantities. The first is the annihilation cross-section: we are going to explore two extreme cases: -wave and -wave. The second ingredient is the dark matter mass density profile: we are going to test peaked distributions (Moore, ) and shallow ones (NFW, ). The last unknown quantity is the dark matter particle mass . In this Section, we are going to fix the latter (for a given set of annihilation cross-section and density profile) using the constraint set by the detected galactic signal.
The line emission at 511 keV detected by INTEGRAL from the galactic center region is at a level of ph cm-2 s-1 (Knodlseder05, ). Several types of astrophysical sources have been considered as potential candidates to explain this emission. However, SNIa fall short sustaining the high positron injection rate Cassé et al. (2004); Prantzos (2004). Hypernovae (Schanne et al., 2005) and the related gamma-ray bursts (Cassé et al., 2004; Schanne et al., 2005; Parizot et al., 2005; Bertone04, ) are in a better position, but since the number of massive stars is about ten times larger in the disk than in the bulge, hot spots of 511 keV emission should show up in the disk plane 777Except if positrons escape rapidly from the thin disk, where the gas is concentrated., which is not the case. Low mass X-ray binaries have also been suggested (Prantzos, 2004), but no 511 keV emission has been observed from these objects. We therefore consider the hypothesis that light Dark Matter particles annihilate into electron-positron pairs, mainly in the galactic center region where the Dark Matter density is at a maximum boehmfayet ; Fayet (2004); boehmetal ; asc . The resulting low-energy positrons are confined by the magnetic field of the bulge, where they are progressively slowed down by ionisation losses. A large fraction (0.93) forms positronium with ambient electrons and annihilate into two (25% of probability) or three photons (Guessoum et al., 2005). Positronium formation plays therefore an important role because it decreases by a factor of about 3 the intensity of the keV line.
The flux of gamma rays (from a direction making an angle with the direction of the galactic center) is given by the integral of the emissivity along the line of sight
| (8) |
where is the volume emissivity. We assume that essentially no annihilation can take place outside the stellar bulge, due to a lack of gas (corresponding roughly to an angle ).
The resulting profiles are convolved with the INTEGRAL/SPI Point Spread Function (PSF). This method allows a fair comparison between observations and models, and depends only weakly of the poorly known size of the gaseous bulge. For each couple of cross-section - dark matter profile, we have computed which mass fits best the observed level of 511 keV emission. The results are summarized in Table 1.
| (MeV) | -Wave | -wave | |
|---|---|---|---|
| c=15 | 1500 | 2.4 | |
| Moore | c=10 | 900 | 1.2 |
| c= 5 | 440 | 0.44 | |
| c=15 | 190 | 0.42 | |
| NFW | c=10 | 110 | 0.20 |
| c= 5 | 45 | 0.060 |
As expected, the most peaked profiles (such as Moore profile) and the most concentrated ones () require the largest values of , since for a given mass density the number density, and hence the annihilation rate decreases when the Dark Matter particle mass increases. It is worth noting that there is a factor of for the mass (corresponding to in flux) in favor of the -wave cross-section compared to the -wave one. Both the NFW -wave case and the Moore -wave reproduce the total flux of the bulge keV emission with reasonable Dark Matter particle mass of the order of MeV and MeV, respectively. On the opposite, the NFW -wave case would require masses ( MeV) so small that they are unable to produce 511 keV photons. And the Moore -wave case required such high masses ( MeV) that they would lead to an excessive bremsstrahlung emission of soft gamma-ray photons beacom .
Among the specific cases considered two models (NFW with -wave and Moore with -wave) are therefore favored by the galactic signal. If one considers only the total emission from the bulge, neither the -wave nor the -wave cross-section can be excluded. If one considers the emission profile however, a different conclusion could be drawn: according to a recent article asc the shape of the emission profile could be used to exclude the -wave scenario. We address this interesting question in the Appendix, in which we conclude that, to our opinion, both scenarios cannot be discriminated yet.
III.6 Results

Using the calibration on the Milky Way, we are now able to compute the diffuse background for our two best models: -wave cross-section, NFW profile with a MeV Dark Matter mass; and -wave cross-section, Moore profile with a MeV Dark Matter mass. These are used here as specific benchmarks for the the purposes of our analysis, many other intermediate situations being obviously also possible.
As shown in Fig. 6, the background predictions in the two models are at the same level with a slightly different spectral signature. The main conclusion is that the level of the predicted background is more than a factor of 100 below the observed background. Calibrating on the Milky Way, the relative smallness of the obtained results for the cosmic gamma-ray background shows that the light Dark Matter annihilation hypothesis is by far not ruled-out by the current soft gamma-ray extragalactic background constraint.
Note that this conclusion can be applied more generally to other positron sources since the keV emission from the Milky Way is quite weak compared to the observed background intensity. In order to make this background large, one has to assume that other galaxies have much higher positron production rates than the Milky Way. Indeed, in this case, the Milky Way would not be representative from other halos of the same mass.
IV Constraints on dark matter candidates
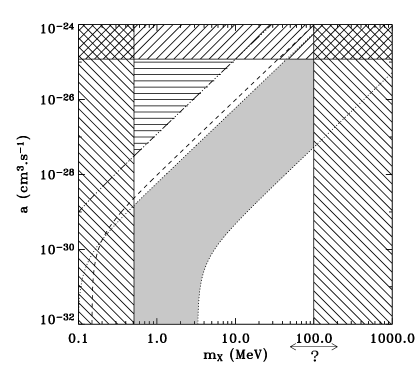
The grey region is the one compatible with the galactic constraint, based on the total level of emission, using the (Moore or NFW) dark-matter distributions of Table I (its upper part corresponds to a Milky-Way emission that would-be -wave-dominated, with behaving like ).
The dot-dashed line is associated with a dark-matter induced background (for a NFW profile) that would correspond to the missing keV cm-2 s-1 sr-1, the top left-hand corner above this line being excluded on the basis of the cosmic background data (same for the dashed line with Moore profiles).
The main objective of this paper is the computation of the Dark Matter induced background in the 100 keV-511 keV energy range taking into account the important role of baryons. Using standard concentration parameters for the Dark Matter halo profiles (as given by N body simulations), the net result of this exercice is a decrease by a factor of 10 of the level of the background emission compared to the precedent computation in (Ahn and Komatsu, 2005).
Calibration of and on the INTEGRAL signal is however uncertain. Indeed, it depends strongly on the Milky-Way Dark Matter profile which is not well known. The grey region in Fig. 7 shows the range of allowed parameters corresponding to this calibration. To obtain this domain we have considered a reasonable range of Dark Matter profiles from peaked and concentrated ones (Moore profile and ) to less peaked and less concentrated ones (NFW and ). Then we have found for each profile which cross-section and particle mass reproduce the level of the galactic emission. As a result, each mass and cross-section in the grey region could reproduce the level of the bulge emission with a reasonable Dark Matter profile. The corresponding background is below the observed background (see the previous Section). As a consequence, no light Dark Matter candidate is ruled out by the diffuse background constraint and one has to invoke another gamma-ray source in order to explain the missing 4 keV cm-2 s-1 sr-1.
If we consider now that the Milky-Way Dark Matter halo is totally different from other halos of similar mass in the Universe, we could relax the previous calibration and obtain independent constraints on the mass and the cross-section (following in that sense the strategy used in Ahn and Komatsu (2005) on the observed background only). In the present paper, constraints are of course less stringent than in Ahn and Komatsu (2005), since baryon physics has led us to decrease the level of the emission by a factor of 10. As shown in Fig. 7, constraints exclude only the upper left hand corner, corresponding to low-mass Dark Matter particles and -wave dominated cross-section. Interestingly, for halos with a Moore profile, the Dark Matter candidate mass and cross-section required to reach the level of the observed background are not so far from the region favored by the galactic constraints.
V Conclusions
Having estimated the SNIa contribution in the 100 keV-10 MeV energy range, we have found that an unexplained gamma-ray background emission at most of the order of 4 keV cm-2 s-1 sr-1 remains. As proposed in (boehmetal, ), the strong 511 keV emission from the galactic center detected by the INTEGRAL satellite could be explained by light Dark Matter annihilation, and we have verified that the observed emission profile can be reproduced, both for and -wave annihilation cross-sections. Using the hierarchical model of structure formation, we have computed the corresponding gamma-ray background, and found it to be compatible with current observational bounds, if one takes into account the minimal halo mass for galaxy formation. The new positron-generated (Dark Matter-induced) extragalactic background is in fact overwhelmed by other emissions from SNIa, Seyferts, and blazars. The exclusion of small mass halos as (redshifted) 511 keV photon sources leads to an order of magnitude decrease of the extragalactic flux around 500 keV as compared to earlier studies. The spectral shape of the extragalactic background is also modified in the sense that the number of Dark Matter halos capable of hosting gas rich galaxies decrease very strongly with increasing redshift.
Acknowledgements: The authors would like to thank the anonymous referee for his helpful remarks that have greatly improved the quality of the paper.
References
- (1)
- (2)
- (3)
- (4)
- (5)
- (6)
- (7)
- (8)
- (9)
- (10)
- (11)
- Zdziarski (1996) A. A. Zdziarski, MNRAS 281, L9+ (1996).
- Strong et al. (2004) A. W. Strong, I. V. Moskalenko, and O. Reimer, Astrophys. J. 613, 956 (2004).
- Krivonos et al. (2005) R. Krivonos et al., Astrophys. J. 625, 89 (2005).
- Comastri (1999) A. Comastri, Astrophysical Letters Com. 39, 181 (1999).
- Watanabe et al. (1999) K. Watanabe et al., Astrophys. J. 516, 285 (1999).
- Strigari et al. (2005) L. Strigari et al., astro-ph 0502150 (2005).
- Ruiz-Lapuente et al. (2001) P. Ruiz-Lapuente, M. Cassé, and E. Vangioni-Flam, Astrophys. J. 549, 483 (2001).
- (19) J. Knödlseder et al., Astron. Astrophys. 411, L457 (2003); P. Jean et al., Astron. Astrophys. 407, L55 (2003); J. Knödlseder et al., Astron. Astrophys. 441, L513 (2003);
- (20) C. Bohm and P. Fayet, Nucl. Phys. B 683, 219 (2004).
- Fayet (2004) P. Fayet, Phys. Rev. D 70, 023514 (2004).
- (22) C. Bohm et al., Phys. Rev. Lett. 92, 101301 (2004); C. Bohm, P. Fayet and J. Silk, Phys. Rev. D 69, (2004) 101302 (2004).
- Rasera and Teyssier (2005) Y. Rasera and R. Teyssier, Astron. Astrophys. 385, 1 (2006).
- Ahn and Komatsu (2005) K. Ahn and E. Komatsu, Phys. Rev. D 71, 021303 (2005); K. Ahn and E. Komatsu, Phys. Rev. D 72, 061301 (2005); K. Ahn, E. Komatsu and P. Höflich, Phys. Rev. D 71, 121301 (2005).
- Teyssier (2002) R. Teyssier, Astron. Astrophys. 385, 337 (2002).
- Springel and Hernquist (2003) V. Springel and L. Hernquist, MNRAS 339, 312 (2003).
- Somerville et al. (2001) R. S. Somerville, J. R. Primack, and S. M. Faber, MNRAS 320, 504 (2001).
- Pei et al. (1999) Y. C. Pei, S. M. Fall, and M. G. Hauser, Astrophys. J. 522, 604 (1999).
- Hughes et al. (1998) D. H. Hughes, et al., Nature (London) 394, 241 (1998).
- Steidel et al. (1999) C. C. Steidel, et al., Astrophys. J. 519, 1 (1999).
- Flores et al. (1999) H. Flores, et al., Astrophys. J. 517, 148 (1999).
- Glazebrook et al. (1999) K. Glazebrook, et al., MNRAS 306, 843 (1999).
- Yan et al. (1999) L. Yan, et al., Astrophys. J. 519, L47 (1999).
- Massarotti et al. (2001) M. Massarotti, A. Iovino, and A. Buzzoni, Astrophys. J. 559, L105 (2001).
- Giavalisco et al. (2004) M. Giavalisco, et al., Astrophys. J. 600, L103 (2004).
- Dahlen et al. (2004) T. Dahlen, et al., Astrophys. J. 613, 189 (2004).
- Nomoto et al. (1984) K. Nomoto, F.-K. Thielemann, and K. Yokoi, Astrophys. J. 286, 644 (1984).
- Press and Schechter (1974) W. H. Press and P. Schechter, Astrophys. J. 187, 425 (1974).
- Bullock et al. (2001) J. S. Bullock, et al., MNRAS 321, 559 (2001).
- Navarro et al. (1997) J. F. Navarro, C. S. Frenk, and S. D. M. White, Astrophys. J. 490, 493 (1997).
- Moore et al. (1999) B. Moore, et al., MNRAS 310, 1147 (1999).
- (42) P. Fayet, Nucl. Phys. B 187, 184 (1981); B 347, 743 (1990); Phys. Lett. B 142, 263 (1984).
- (43) C. Bohm, T. Ensslin and J. Silk, J. Phys. G 30, 279 (2004).
- (44) J. Beacom, N. Bell and G. Bertone, Phys. Rev. Lett. 94, 171301 (2005).
- (45) C. Bohm and Y. Ascasibar, Phys. Rev. D 70 (2004) 115013; Y. Ascasibar et al., astro-ph/0507142 (2005).
- Gnedin (2000) N. Y. Gnedin, Astrophys. J. 542, 535 (2000).
- Hoeft et al. (2004) M. Hoeft, et al., Baryons in Dark Matter Halos (2004).
- Cassé et al. (2004) M. Cassé, et al., Astrophys. J. 602, L17 (2004).
- Prantzos (2004) N. Prantzos, astro-ph/0404501 (2004).
- Schanne et al. (2005) S. Schanne, et al., 35th COSPAR Scientific Assembly (2005), pp. 2307-+.
- Parizot et al. (2005) E. Parizot, et al., Astron. Astrophys. 432, 889 (2005).
- (52) G. Bertone et al., astro-ph/0405005 (2004).
- Guessoum et al. (2005) N. Guessoum, P. Jean, and W. Gillard, Astron. Astrophys. 436, 171 (2005).
- (54) A. C. Robin, et al., Astron. Astrophys. 409, 523 (2003)
- (55) R. Launhardt, R. Zylka, and P. G. Mezger, Astron. Astrophys. 384, 112 (2002)
- (56) M. Cassé and P. Fayet, astro-ph/0510490
- (57) J.F. Beacom and H. Yuksel, astro-ph/0512411
- (58) P. Fayet, D. Hooper and G. Sigl, hep-ph/0602169
Appendix A 511 keV emission from the galactic bulge
The computation of the Milky-Way emission profile is not the main goal of this paper, since we only used the integrated emission (and not the shape) for calibration purposes. However, it is essential to compare carefully predicted profiles to the observed one (see the recent paper asc ). In this Appendix, we would like to outline some interesting issues concerning this point. Using the same hypothesis as in Section 2, we consider the three different cases of Table 1: a NFW profile with and a -wave cross-section; a NFW profile with and a -wave cross-section; and finally, a Moore profile with and a -wave cross-section.
In the pure -wave case with an essentially constant cm3 s-1, we have chosen to consider and test, with the above NFW distribution, a Dark Matter particle with mass MeV. Let us note however that, given our hypothesis, the same emission profile would have been obtained from the same but with a mass of (or 1.1) MeV only, and an term that would be (or 104) times smaller. The corresponding (-wave) cross-section would then be -wave dominated at freeze-out, while appearing as -wave-dominated for low-velocity annihilation in the galactic center.
In the pure -wave case on the other hand, for which the annihilation cross-section in the galactic center should be lower (i.e. typically cm3 s-1), should in general be taken relatively small, to get (with a correct relic density) a sufficiently intense gamma-ray line. In practice we test about 0.5 (with the NFW profile) and 1.2 MeV (with the Moore profile).
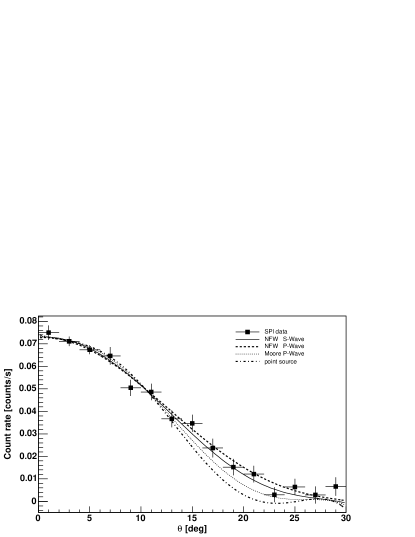
At first sight, all three tested profiles seem compatible with the observations, within the precision of the analysis. Attempting to discriminate between them (or with analogous ones) would require a careful chi-squared analysis and is beyond the scope of this article, as we are mainly interested here in the total observed intensity and global morphology of the 511 keV emission of the galactic bulge.
If the cross-section for Dark Matter annihilation in halos is velocity-independent (-wave or effectively -wave annihilation), the emissivity of a NFW Dark Matter halo scales near the center as . Convolving this emission with the SPI Point Spread Function (PSF), we obtain the profile presented as a continuous line in Fig. 8. We emphasize here that the profiles shown are the profiles after convolution by the PSF.
If, however, this cross-section is -wave suppressed, the emissivity now depends on the Dark Matter 3D velocity dispersion asc . We then compute as a function of the radius by solving the Jeans equation, at first for a NFW potential. The resulting emission profile (shown after convolution as a dashed line in Fig. 8) also turns out to fit the data, although it is less peaked, as the velocities increase with , within the region of interest. Furthermore, as mentioned earlier, to get in this case the appropriate intensity for the 511 keV line we need to consider both rather small values of (about MeV) and somewhat extreme parameters for the Milky -Way Dark Matter halo (choosing ).
These restrictions may be avoided to some extent, however, with a steeper profile such as the Moore profile (Moore et al., 1999), which enhances the rate of Dark Matter annihilation, especially near the center of the galaxy, so that the resulting emission profile (shown after convolution as a dotted line in Fig. 8) gets now more peaked. With such profiles, -wave annihilation with standard Milky-Way parameters appear to be compatible with the data, even for less small values of . Furthermore, note that if Dark Matter is subject to the stellar gravitational potential that dominates the central region of the galaxy robinetal , with a radial density profile declining roughly as launhardtetal , the - and -wave cases would be essentially indistinguishable.
To conclude this Appendix, we have verified that one can reproduce the photon flux and distribution observed by INTEGRAL, both for - and wave cross-sections, with standard Dark Matter profiles and appropriate mass . Again, in this approach, attempting to further discriminate between emission profiles associated with - or -wave annihilation appears as difficult, given the width of the PSF function and the variety of the Dark Matter profiles, gravitational potential profiles and gas density profiles which may be considered.