11email: mdp@mssl.ucl.ac.uk, luigi.piro@rm.iasf.cnr.it, bruce.gendre@rm.iasf.cnr.it, enrico.costa@rm.iasf.cnr.it, marco.feroci@rm.iasf.cnr.it, paolo.soffitta@rm.iasf.cnr.it 22institutetext: INAF - Istituto di Astrofisica Spaziale e Fisica Cosmica, via P. Gobetti 101, I-40219, Bologna, Italy
22email: amati@bo.iasf.cnr.it 33institutetext: Rome Astronomical Observatory, via di Frascati 33, 00044 Rome
33email: a.antonelli@mporzio.astro.it 44institutetext: Universit di Ferrara, Via Paradiso 12, 44100 Ferrara, Italy
44email: frontera@fe.infn.it 55institutetext: Space Research Organization of the Netherlands, Sorbonnelaan 2, 3584 CA Utrecht, Netherlands.
55email: j.heise@sron.nl, jeanz@sron.nl 66institutetext: Istituto Astrofisica Spaziale e Fisica Cosmica, Sezione di Palermo, INAF, Via U. La Malfa 153, 90146 Palermo, Italy.
66email: nicastro@pa.iasf.cnr.it
The BeppoSAX catalog of GRB X-ray afterglow observations
We present the X-ray afterglow catalog of BeppoSAX from the launch of the satellite to the end of the mission. Thirty-three X-ray afterglows were securely identified based on their fading behavior out of 39 observations. We have extracted the continuum parameters (decay index, spectral index, flux, absorption) for all available afterglows. We point out a possible correlation between the X-ray afterglow luminosity and the energy emitted during the prompt -ray event. We do not detect a significant jet signature within the afterglows, implying a lower limit on the beaming angle, neither a standard energy release when X-ray fluxes are corrected for beaming. Our data support the hypothesis that the burst should be surrounded by an interstellar medium rather than a wind environment, and that this environment should be dense. This may be explained by a termination shock located near the burst progenitor. We finally point out that some dark bursts may be explained by an intrinsic faintness of the event, while others may be strongly absorbed.
Key Words.:
X-rays:general– Gamma-rays:bursts – Catalogs1 Introduction
Discovered in the early 70’s (Klebesadel et al. 1973), Gamma-Ray Bursts (GRBs) have been a mysterious phenomenon for 25 years. The lack of any optical counterpart prevented observers from determining the distance - galactic or extragalactic - and therefore the amount of energy involved, which was uncertain within 10 orders of magnitude. A lot of different models were at that time able to explain the observed prompt gamma-ray emission.
The situation changed dramatically with the first fast and precise localization of GRB, that was obtained by the BeppoSAX satellite (Piro 1995; Boella et al. 1997) in 1997. This satellite was combining a gamma-ray burst monitor (that provided the burst trigger) with X-ray cameras (that were able to asses a precise position and to carry out follow-up observations). This observational strategy led to the discovery of the X-ray (Costa et al. 1997), optical (van Paradijis et al. 1997) and radio (Frail et al. 1997) afterglows. The spectroscopy of the optical counterpart of the burst also allowed the distance of these events to be firmly established as cosmologic (Metzger et al. 1997).
With the end of the BeppoSAX mission (April 2002) and its reentry, a page of the GRB afterglow study was turned, but the observations remain within the archives. To prepare the future, we have initiated a complete re-analysis of all X-ray observations done. In this first paper, we present the legacy of BeppoSAX : its X-ray afterglow catalog, focusing on the continuum properties. We will also compare our results with those of previous studies on GRB X-ray afterglows (Frontera et al. 2003; Piro 2004). In two forthcoming papers (Gendre et al. 2005, Gendre et al. in preparation), we will discuss GRB afterglow observations made by XMM-Newton and Chandra, and a systematic study of line emission in the X-ray afterglow spectra.
2 Data reduction and analysis
BeppoSAX detected and localized simultaneously in the Gamma Ray Burst Monitor (GRBM, Frontera et al. 1997) and Wide Field Cameras (WFC, Jager et al. 1997) 51 GRBs within its six year long lifetime (Frontera et al. 2004). These bursts have been included in our analysis sample. We note that this set is biased against X-ray rich GRBs and especially X-ray flashes (Heise et al. 2002), i.e. bursts with weak or absent signal in the GRBM and normal counterpart in the WFC. In our sample, we also included GRB991106, GRB020410 and GRB020427, although they gave no detection in the GRBM111In the case of GRB020410, GRBM was actually switched off at the time of the burst. A -ray signal was detected by Konus(Nicastro et al. 2004), due to the fact that a subsequent observation with BeppoSAX was performed after the localization with the WFC. Data on these bursts are reported in Tables The BeppoSAX catalog of GRB X-ray afterglow observations and The BeppoSAX catalog of GRB X-ray afterglow observations. We have not included the bursts discovered after an archive re-analysis. Overall, it was possible to follow up 36 burst with the narrow field instruments. One other afterglow observation (GRB 000926) was carried out following external triggers. Finally, in the case of GRB 980703, BeppoSAX detected the burst while it was outside failed the WFC field of view, and the follow up observation was performed on the basis of a localization by the RXTE All Sky Monitor. In this paper we present the data gathered by the Narrow Field Instruments (NFI) Low Energy Concentrator Spectrometer (LECS, 0.1 - 10 keV, Parmar et al. 1997) and Medium Energy Concentrator Spectrometer (MECS, 1.6 - 10 keV, Boella et al. 1997). The first of this sample (GRB 960720) was followed up late, while 38 had fast (within 1 day2222 days for GRB000926) follow up observations. We analyzed 37 of these fast follow-up, excluding GRB 990705 due to its high contamination of a nearby X-ray source.
A typical observation starts hours after the burst and its duration is about seconds for MECS and for LECS. The net exposure lasts of the observation for MECS and for LECS.
2.1 Afterglow identification and temporal analysis

The first step of data analysis is source detection, in order to find the afterglow. For this purpose, we used the MECS data, because this instrument has a sensitivity higher than that of the LECS. We extracted the image, ran the detection tool Ximage 4.3333see http://heasarc.gsfc.nasa.gov/docs/xanadu/ximage/ximage.html on this image and selected all the sources with at least a significance located inside the WFC error box. In the special cases of GRB 980703 and GRB 000926 we used the IPN error box (Hurley et al. 2000) and ASM error box (Levine et al. 1998) respectively as these bursts were outside the WFC field of view. The afterglow was recognized by its fading behavior. The light curves were generated from counts extracted within a circle area centered on the source with a radius of 4 arcminutes. We chose this value because of the source energy is within this region (Fiore et al. 1999). We also selected counts between 1.6 and 10 keV interval, which is the optimal range of work for the MECS.
The associated background was extracted using an annulus centered at the same position than the source extraction region, with inner and outer radii of 4.5 and 10 arcminutes respectively. To take into account the effects of effective area variation and the MECS support, we renormalized the counts extracted in the annuli by a factor determined by comparing the counts in the same regions of the library background fields.
We used the local background rather than the library background for light curves in order to take into account any possible time fluctuation. We developed an IDL script to construct and fit light curves. This algorithm can calculate adequate errors even in the case of few counts per bin, by using a Poissonian statistics. However, if possible, the width of temporal bins was chosen wide enough to have at least 15-20 counts/bin (background subtracted) at least, in order to apply a proper Gaussian fit (see below). When available, subsequent TOOs were also used to better constraint the light curve behavior.
The light curves were fitted using a simple power law, using the Levenberg-Marquardt method to minimize the statistic. We detected 31 sources with a positive decaying index (in the following, we used the convention , thus a decaying source has a positive decay index) at the confidence level. These sources were identified as the X-ray afterglow of each burst444In the cases of GRB000926 and GRB020427, we have used data gathered by the Chandra X-ray observatory to constrain the decay index (see Piro et al. 2001; Gendre et al. 2005). For GRB011121, we have used the last WFC data points (see Piro et al. 2005). For three of these sources (GRB 971227, GRB 990217 and GRB 000529) the value of the decay index is greater than zero but not well constrained. We report in Table 1 the decay index we obtained for all these 31 sources (henceforth, all errors reported are at , while upper limits are quoted at the 90% confidence level, unless otherwise specified).
In three cases (GRB 970111, GRB 991106 and GRB 000615), we detected within the WFC error box only one source that did not display any significant fading behavior. We refer to these as candidate afterglows. We have calculated the probability to observe a serendipitous source at the observed flux level within the WFC error box for these 3 bursts, adopting the Log N - Log S distribution for BeppoSAX released by Giommi et al. (2000). The probability are for GRB 000615 and for GRB 970111 and GRB 991106. The probability that all of these 3 sources are not afterglows is . We note, however, that these probabilities have been calculated for extragalactic sources; for low Galactic latitude events, like GRB991106 (), the value may differ significantly. Cornelisse et al. (2002) indicated that GRB 991106 could in fact be a Galactic type-I X-ray burster.
In two cases (GRB 010220 and GRB020321) we did not detect any source with significance within the WFC error box. We report in Table 1 the detection upper limits.
Some observations deserve special comments. GRB 990907 was observed for seconds only and no decaying behavior can be detected within the light curve of the source found inside the WFC error box. However, given the high flux of this source ( erg cm-2 sec-1 in the 1.6-10 keV band), the probability to have observed a serendipitous source was . We have thus assumed that this source was indeed the X-ray afterglow of GRB 990907. In the case of GRB 980425, we analyzed the source S1 coincident with SN1998bw (Pian et al. 1999). We do not include it in the following discussion as the detected X-ray emission could be strongly affected by SN1998bw.
We present the light curves in Fig. 12.
2.2 Spectral analysis
The X-ray afterglow spectra have been accumulated from the LECS and MECS during the first TOO only, for those afterglows with more than 150 photons in the MECS (background subtracted). 15 GRBs passed this criterion; their spectra are presented in Fig. 1.
We have generally collected LECS counts within a circle centered on the source with radius arcminutes, which again encircles of source energy. We operated with LECS data in the range 0.1-4.0 keV, where the response matrix is more accurate. As for MECS, we collected counts with the same criteria we applied for the time analysis. For spectral analysis, we used the library spectral backgrounds for both LECS and MECS as they have a very good signal-to-noise ratio, due to long exposition555In the case of GRB970111 and GRB970402, better results were obtained by using local background. However, the library backgrounds have been taken at high Galactic latitudes, with an average Galactic absorption around 2-3 . Several afterglows in our sample have been observed in fields with an absorption much higher than this value. For these bursts, the local background would differ from the library one at low energy (e.g. below 0.3 keV). The use of a library background from 0.1 keV would result in an underestimate of the low-energy signal and consequently a too high estimate of the intrinsic absorbing column of the burst. Therefore, to evade this problem, we have taken the minimum energy for LECS to be 0.4 keV if the Galactic column density was cm-2. Similarly to the time analysis, the spectral analysis was performed by requiring at least counts/bin. The standard model to fit the spectral data consists of a constant, a Galactic absorption, an extragalactic absorption (i.e. in situ) and a power law. The constant has been included because of the differences in the LECS and MECS instruments. Its value is obtained in each case by fitting LECS and MECS data in the 1.6 - 4 keV interval (to avoid absorption effects) with a simple power law model.
In our work, we have calculated the 1.6 - 10 keV flux of X-ray afterglows 11 hours after the burst trigger. We have chosen this time to avoid effects of changes in the decaying slope. The average count rate in the MECS has been associated with the average flux given by the spectrum. Successively, we have taken the count rate at 11 hours, which is given by the light curves, to compute the flux at that time. In most cases, observations include it. In a few cases (e.g. GRB 000926) the flux has been extrapolated.
For those afterglows with counts, we used a canonical model with an power law energy index of (which is typical of X-ray afterglow spectra) to convert the count rate 11 hours after the trigger to the corresponding flux.
| GRB name | keV Flux | Decay | Spectral | Density |
|---|---|---|---|---|
| ( | index | index | column | |
| erg cm-2 s-1) | ( cm-2) | |||
| GRB 970111 | — | — | ||
| GRB 970228 | ||||
| GRB 970402 | — | — | ||
| GRB 970508 | ||||
| GRB 971214 | ||||
| GRB 971227 | — | — | — | |
| GRB 980329 | ||||
| GRB 980425 | — | — | ||
| GRB 980515 | — | — | ||
| GRB 980519 | ||||
| GRB 980613 | — | — | ||
| GRB 980703 | ||||
| GRB 981226 | — | — | ||
| GRB 990123 | ||||
| GRB 990217 | — | — | ||
| GRB 990510 | ||||
| GRB 990627 | — | — | ||
| GRB 990704 | ||||
| GRB 990806 | ||||
| GRB 990907 | — | — | — | |
| GRB 991014 | — | — | ||
| GRB 991106 | — | — | ||
| GRB 000210 | ||||
| GRB 000214 | ||||
| GRB 000528 | — | — | ||
| GRB 000529 | — | — | ||
| GRB 000615 | — | — | ||
| GRB 000926 | — | — | ||
| GRB 001109 | ||||
| GRB 010214 | — | — | ||
| GRB 010220 | — | — | — | |
| GRB 010222 | ||||
| GRB 011121 | — | — | ||
| GRB 020321 | — | — | — | |
| GRB 020322 | — | — | ||
| GRB 020410 | ||||
| GRB 020427 | — | — |
All the results of our X-ray afterglow analysis are summarized in Table 1. In Table 2, we report results of the previous analysis on single BeppoSAX GRBs, mostly taken by a review of Frontera et al. (2004). We can see a general agreement of the previous results with ours.
In order to increase the statistical significance of the sample of X-ray afterglows with known redshift, we included in our successive analysis GRB011211. For this burst, which was observed by XMM-Newton, we assumed a flux of 10-13 erg cm-2 s-1, a spectral and decay index of and respectively (Gendre et al. 2005).
| GRB | Temporal | Energy | nH /n | 2–10 keV flux | Ref. |
| name | indexa | index | at 105 s a | ||
| ( cm-1) | (erg cm-2s-1) | ||||
| GRB 970111 | 1.5 | — | — | Feroci et al. (1998) | |
| GRB 970228 | 1.3 0.2 | 1.10.3 | 3.5 / 1.6 | Costa et al. (1997); Frontera et al. (1998) | |
| GRB 970402 | 1.70.6 | 20 / 2.0 | Nicastro et al. (1998) | ||
| GRB 970508 | 1.10.1b | 1.50.55 | 6.0 / 0.5 | Piro et al. (1998b); Piro et al (1999) | |
| GRB 971214 | 0.60.2 | 1.0 / 0.6 | — | Dal Fiume D. et al. (2000) | |
| GRB 971227 | 1.12(W) | [1.1] | [0.13] / 0.13 | Antonelli et al. (1999) | |
| GRB 980329 | 1.30.03 (W) | 1.40.4 | 104 / 0.9 | in’t Zand et al. (1998) | |
| GRB 980425 | 0.160.04 | 1.00.18 | [0.39] / 0.39 | Pian et al. (2000) | |
| GRB 980519 | 1.830.30 | 1.8 | 3–20 / 1.73 | Nicastro et al. (1999) | |
| GRB 980613 | 1.190.17(W) | —- | — | Soffitta et al. (2002) | |
| GRB 980703 | 0.91 | 1.510.32 | 36c / 0.34 | Vreeswijk et al. (1999) | |
| GRB 981226 | 1.3 | 0.920.47 | [0.18] / 0.18 | Frontera et al. (2000b) | |
| GRB 990123d | 1.460.04 | 0.940.08 | 0.9 / 0.21 | Maiorano et al. (2005) | |
| GRB 990510 | 1.420.07 | 1.030.08 | 2.10.6/0.94 | Kuulkers et al. (2000) | |
| GRB 990704 | 0.830.16 | 0.7 | [0.3] / 0.3 | Feroci et al. (2001) | |
| GRB 990705 | 1.580.06 | — | - | Frontera et al. (2003) | |
| GRB 990806 | 1.150.03(W) | 1.16 | [0.35] / 0.35 | Montanari et al. (2002) | |
| GRB 991014 | 0.4 | 0.530.25 | [2.5]/ 2.5 | in’t Zand et al. (2000b) | |
| GRB 000210 | (W) | Piro et al. (2002) | |||
| GRB 000214 | 0.80.3 | 1.00.18 | 0.7/ 0.55 | Antonelli et al. (2000) | |
| GRB 000926 | 1.89 | 4/0.27 | Piro et al. (2001) | ||
| GRB 001109 | 1.180.05 | 1.40.3 | 8.70.4 | Amati et al. (2003) | |
| GRB 010214 | 2.1 | 0.3 | [0.27] / 0.27 | — | Guidorzi et al. (2003) |
| GRB 010222 | 1.330.04 | 0.970.05 | 1.50.3/ 0.16 | in’t Zand et al. (2001) | |
| GRB 011121 | (W) | Piro et al. (2005) | |||
| GRB 020321 | — | — | — | in’t Zand et al. (2004) | |
| GRB 020410 | — | Nicastro et al. (2004) | |||
| GRB 020427 | 0.29/0.29 | Amati et al. (2004) |
a All upper limits are 3 except for GRB990705 which are 2.
b from 6104 s to 5.8105 s
c nH value corrected for redshift.
d Spectral data of the first 20,000 s. The time decaying index includes the whole NFI TOO.
e SAX plus CHANDRA data (Piro et al. 2001).
f Corrected for redshift (Piro et al. 2001). This n value was added to the Galactic column density n.
3 Results and Discussion
3.1 General properties of X-ray afterglows


We detect an X-ray afterglow in 31 of 36 cases. This constitutes of the sample. If all doubtful sources are considered as afterglows, then the fraction of X-ray afterglows increases up to .
In Fig. 2 we present the distribution of the X-ray afterglow flux FX in the 1.6-10 keV band. It spans approximately 2 orders of magnitude. GRB 020410 afterglow is the object with the highest flux, erg cm-2 s-1, while the weakest is , erg cm-2 s-1. The fit of this distribution with a Gaussian provides a logarithmic mean and width of and respectively. One may wonder if some faint afterglows could be missed due to the detection limit (either due to a low luminosity or to a large distance). In this case, the true distribution could be broader than that we measure. However, the fact that we detect X-ray afterglows in of follow-up observations indicates that this is not the case.
We have also estimated the distribution of the spectral and decay indexes (Fig.3). The values we have obtained for those parameters are the result of the convolution of the intrinsic distribution with the measurement error. Under the assumption that both are Gaussian, it is possible to deconvolve the two distributions. We have adopted a maximum likelihood method (see De Pasquale et al. 2003; Maccacaro et al. 1988) to gather the best estimates of the parent distribution in the BeppoSAX sample. We have obtained from the spectral index distribution a mean value of with a width of , and from the decay index distribution a mean value of with a width of . These values depend on the value of , the energy power law index of the electrons which radiate by synchrotron emission within the fireball, and the state of the fireball itself (fast/slow cooling, position of the cooling frequency, beaming, surrounding medium). In section 3.4 we will show that the average properties of the afterglow are consistent with a cooling frequency below the X-ray range. In this case, following Sari et al. 1998, we can determine an average value for .
| GRB name | ||||
| erg s-1 | erg | rad | erg s-1 | |
| GRB 970228 | 28.6 | 9.9 | ||
| GRB 970508 | 16.1 | 3.5 | 0.391 | 1.23 |
| GRB 971214 | 147 | 125 | ||
| GRB 980613 | 7.21 | 4.26 | ||
| GRB 980703 | 37.4 | 74.1 | 0.2 | 0.75 |
| GRB 990123 | 373 | 692 | 0.089 | 1.48 |
| GRB 990510 | 269.7 | 144.5 | 0.054 | 0.39 |
| GRB 990705 | 79.4 | 0.096 | ||
| GRB 990712 | 3.32 | |||
| GRB 000210 | 6.96 | 130 | ||
| GRB 000214 | 3.4 | 3.17 | ||
| GRB 000926 | 335 | 155 | 0.140 | 2.14 |
| GRB 010222 | 377 | 375 | 0.08 | 13.1 |
| GRB 011121 | 5.1 | 3.74 | 0.145 | 0.05 |
| GRB 011211 | 20 | 68.8 | 0.115 | 0.12 |
3.2 General properties of the prompt emission and selection effects
We list in Table The BeppoSAX catalog of GRB X-ray afterglow observations the properties of the prompt emission of GRB detected by BeppoSAX, extracted from the literature. Figure 4 displays the distribution of the -ray fluence of the BeppoSAX sample. The fit with a Gaussian provides a mean logarithmic fluence of and a width of distribution 666GRB 980425 has not been included in this calculation and in the successive ones for its peculiarity..

An important question regards the possible selection effects on the flux of the prompt phase. In Fig. 5 we present the isotropic gamma-ray energy and X-ray energy for events of known redshift, emitted in the 40-700 and 2-10 keV band respectively in the GRB cosmological rest frames. They have been calculated by using the k-correction of Bloom et al. 2001, with cosmological parameters =65 km s-1 Mpc-1, =0.7, =0.3.
The continuous lines indicate the detection thresholds as function of the redshift, for a typical GRB. Note that these are indicative values because the sensitivity depends on the exposed area as function of the off-set angle and the duration of the event. The minimum energy required for a detection have been calculated taking the fluence detection thresholds of the two instruments, around erg cm-2 for the GRBM and erg cm-2 for the WFC. In the case of the WFC this corresponds to about 200 mCrab in 20 seconds. From the figures it is evident that the gamma-ray energies are well above the GRBM threshold. On the contrary the sample is limited by the WFC detection threshold, roughly corresponding to a isotropic energy in the 2-10 keV range of erg at z=1 and erg at z=4.
We note, however, that this may not be true for X-ray rich GRBs and X-ray Flashes (Heise et al. 2002): the -ray emission of these objects is weak or absent. In these cases, only the WFC could detect distant events.
3.3 Correlation between Afterglow Luminosity and Gamma-Ray Energy.
We note that the width of the -ray fluence distribution is not very different from that of the X-ray afterglow flux distribution (see Fig. 2 and Fig. 4) A few authors, e.g.Kumar & Piran (2000), have proposed that the energy emission from the fireball surface need not be isotropic, but that large spatial variations of in the fireball could exist. During the prompt emission phase, the radiation is highly beamed, due to very high Lorentz factor of the ejecta. These circumstances would lead to a large spread of -ray fluences. In the afterglow phase, X-rays are less beamed due to the lower Lorentz factor, and hence the fluctuations are averaged over a larger region. Therefore, X-ray flux afterglow distribution would be less broad than the -ray fluence. As we do not observe such a difference in the two distribution widths, we cannot support the hypothesis of Kumar & Piran (2000).


The distribution of Sγ - FX ratio is not very broad (), suggesting a correlation between the X-ray afterglow luminosity and the gamma-ray energy (see Fig. 6). For the sample of burst with known redshift we have then derived LX by the formula (Lamb & Reichart 2000) :
| (1) |
Luminosity is obtained in the 1.6-10 keV energy band and at 11 hours after the burst in the rest frame. We have adopted the average values of , reported in the previous section. The cosmological parameters used are the same as for the computation of the emitted energy (see Sec. 3.1) 777As for GRB000214, was adopted..
In Fig.7 we plot LX vs Eγ. The correlation coefficient is r=0.74 and the probability of chance correlation is 0.008. It is worth noting that some indication of correlation between prompt and afterglow luminosity is also found in a small set of Swift bursts (Chincarini et al. 2005).


Assuming that the observed X-ray frequency is above the cooling frequency , the measurement of X-ray luminosity at a fixed time after the burst gives an estimate of isotropic kinetic energy of the fireball (Freedman & Waxman 2001) :
| (2) |
In that equation, is a parameter which depends very weakly on the fraction of energy carried by the magnetic field , the luminosity distance, the flux density, the time and the frequency of observation . has a stronger dependence on the value of , however henceforth we will make the simplifying assumption that the value of this parameter is the same for all bursts examined. For our purposes, the value of can thus be considered constant. We also note that Eqn. 2 does not depend on the value of the density of the circumbust medium, so it holds either in the case of expansion in interstellar medium, with constant density, or in the case of medium affected by wind of the progenitor star, with a typical density profile decreasing from the center of the explosion.
Using , the value determined from the data, a luminosity distance of cm, time and frequency of observation of sec and Hz, a flux density of Jy, =0.01, Eqn. 2 becomes :
| (3) |
In the case of gamma-ray emission, we have to consider an unknown coefficient of conversion of relativistic energy of the fireball into gamma-ray energy (Piran et al. 2001).
| (4) |
where is the isotropic relativistic energy of the fireball in the prompt phase. We may suppose , because cannot be too close to unity otherwise there will not be an afterglow (Kobayashi et al. 1997; Piran et al. 2001). We assume that radiative losses also are negligible. From the previous equations we derive:
| (5) |
We plot in Fig. 7 this relationship (dotted lines), assuming equal to 0.01, 0.1, 1 and 10 respectively. As one can see, the correlation we have found implies that the ratio does not strongly vary from burst to burst. Assuming that is not too close to zero (a common value observed is 0.3 Freedman & Waxman 2001), this implies that is approximately proportional to . Thus, the fraction of fireball energy carried by relativistic electrons in the external shock and emitted in the afterglow is roughly proportional to the fraction of the fireball relativistic energy converted into -rays during the prompt phase.
3.4 Jet collimation
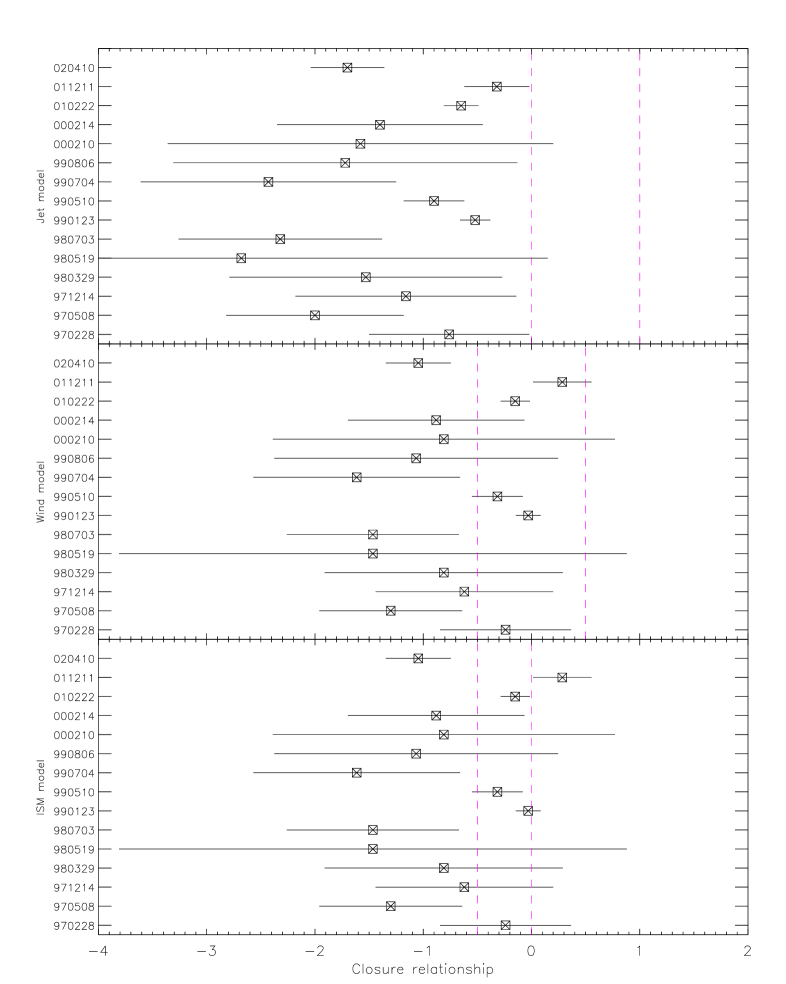
According to Sari et al. (1998); Chevalier & Li (1999); Rhoads (1997), the decay index and the spectral index values are linked together by closure relationships that depend on the burst geometry and environment. We present the closure relationships for each burst in Fig. 8, and focus first on the burst geometry (shown in the top panel of Fig. 8).
As one can see, the jet signature is ruled out in most of the cases from our analysis. This is also evident when we calculate the mean value for the closure relationship. For a jet signature, this is :
| (6) | |||||
| (7) |
In Eq. 6 and 7 we should expect a value of 0, clearly excluded by the data. This implies that the beaming angle may be large. We can set a lower limit on its value (). According to Sari et al. (1999), we have :
| (8) |
In Eqn. 8, Eγ,i,53 represents the isotropic energy emitted in -rays by the fireball in units of erg, is the density in 0.1 particle cm-3 unit, is the efficiency of conversion of explosion energy into -rays, and the date when the break of light curve, due to the beamed emission, appears (expressed in days).
BeppoSAX TOOs are mostly carried out within 2 days after the GRB. Because decay and spectral slopes are not consistent with a collimated outflow, we can derive . Assuming a typical Eγ,i,53=, , (Berger et al. 2003) we obtain a limit of rad, which in turn give us a lower limit on the beaming factor . This result is of the same order of magnitude of that claimed by Frail et al. (2001). We note that the majority of beaming angles, mostly inferred by breaks in optical light curves, are consistent with this result. Only GRB 990510 and GRB010222 seem to represent exceptions (see table 3).
A density of is typical of the interstellar medium. On the other hand, several authors proposed that GRBs are originated by massive stars (e.g. Woosley 1993). In such a case, these stars should produce the GRB within their original forming region, which are usually very dense. If we assume , which is typical of Giant Molecular Clouds, the beaming angle limit increase to rad, which corresponds to a beaming factor limit of .

Berger et al. (2003) claimed that the distribution of X-ray afterglow luminosity appears to converge significantly toward a common value after beaming correction. We have tested this hypothesis with our sample, using the beaming angle values reported in the literature (see Table 3; most of them are extracted from the article by Berger et al. 2003). The isotropic luminosity is corrected for beaming by applying a multiplicative factor depending on the beaming angle (see Berger et al. 2003, for details). Before beaming correction, the luminosity distribution displays a logarithmic width of 0.8 (see Fig. 9), with a mean value of erg s-1. After the beaming correction, the distribution width shrinks to a value of 0.4, very similar to the 0.3 value Berger et al. (2003) obtained. The mean luminosity decreases to erg s-1 (Fig. 9).
One may note that the beaming angle was calculated assuming a density of 10 cm-3 when it was unknown. This may have strong consequences. As an example, in’t Zand et al. (2001) has reported a density value of cm-3 for GRB 010222. When using this value, rather than that reported by Berger et al. (2003), the beaming angle increases up to 0.26 rad. This leads the beaming corrected luminosity distribution width to increase to a value of 0.7, clearly not supporting anymore the hypothesis of a standard energy release in the afterglow. Thus, such claims should be accepted with caution, depending on the assumptions made on the density values.
3.5 The density profile of the environment
Figure 8 displays also the closure relationships for an expansion into a wind environment (the WIND case, middle panel) and a constant density medium (the ISM case, bottom panel). These closure relationships present a degeneration when , which prevents us from drawing any conclusion. One can see from Fig. 8 that most of the bursts are in that situation. The uncertainties of other bursts do not allow us to draw any conclusion for most of them using only the X-ray data. This is also shown by the mean closure relationships reported in Table 4: the two medium cases can fit the mean value if the cooling frequency is below the X-rays, while none of them can fit the mean value in the opposite case.
| ISM | Wind | |
|---|---|---|
To get rid of this degeneration, we need to use also the optical observations. From the fireball model, the X-ray decay index is larger than the optical one if the cooling frequency is between the optical and X-ray bands and if the fireball is expanding into a constant density medium (Sari et al. 1998). The difference between the optical and X-ray decay index is . If the fireball expands into a wind environment (also assuming the cooling frequency to be between the optical and X-ray bands), then it is the optical decay index which is larger than the X-ray decay index. The difference between the optical and X-ray decay index is now 0.25. Assuming that the cooling frequency is indeed between the optical and the X-ray bands, we can remove the degeneration.
| GRB | Reference | ||
|---|---|---|---|
| GRB 970228 | 0.11 | 1 | |
| GRB 970508 | 0.65 | 2 | |
| GRB 971214 | -0.20 | 3 | |
| GRB 980329 | 0.14 | 4 | |
| GRB 980613 | 0.69 | 5 | |
| GRB 980703 | -0.12 | 6 | |
| GRB 990123 | 0.34 | 7 | |
| GRB 990510 | 0.64 | 8 | |
| GRB 010222 | 0.03 | 9 | |
| GRB 011121 | -0.33 | 10 | |
| GRB 011211 | 1.15 | 11 | |
| GRB 020322 | 0.34 | 12, 13 |
References : 1: Masetti et al. (1998) 2: Galama et al. (1998, the index shown is relative to the BeppoSAX observation interval) 3: Diercks et al. (1998) 4: Reichart et al. (1999) 5: Hjorth et al. (2002) 6: Bloom et al. (1998) 7: Kulkarni et al. (1999) 8: Harrison et al. (1999) 9 : Masetti et al. (2001) 10: Price et al. (2002) 11: Jacobsson et al. (2003) 12: Bloom et al. (2002) 13: Greiner et al. (2002)

In Table 5 we show the optical vs X-ray band decay indexes (results taken from the literature). We excluded GRB 980519 and GRB000926 from our set because in their case the jet phase started slightly after the beginning of BeppoSAX observations (Jaunsen et al. 2001, Fynbo et al. 2001), therefore we may have their decaying behavior largely affected by the change of slope.
For the remaining GRBs with both X-ray and optical afterglows detected, the average value of the decay index is in the optical and in the X-rays. The difference between these two values is . A constant density medium surrounding the burst is thus favored, but a wind environment is not ruled out. This is also visible in Fig. 10, where we plot the value for each single burst. For a majority of them, the value 0.25 is preferred, thus implying also that we observe a constant density medium surrounding the burst, for some others, we observe indeed a wind medium. This is tricky, as one should expect, if the long GRB progenitor is indeed a massive star (as the GRB-supernova association claimed for several GRBs implies, see e.g. Stanek et al. 2003; Hjorth et al. 2003), the surrounding medium to be the wind arising from the star for all bursts (Chevalier & Li 1999). Ramirez-Ruiz et al. (2001) suggested the existence of a termination shock that could maintain the wind close to the star (see also Chevalier et al. 2004). This would explain our observations. In such a case, this implies that the termination shock has been crossed before the observations (thus early after the burst), which should then imply a dense surrounding medium. This is supported by the large absorption observed around the bursts (see Table 1): such a high density column may be due to a compact and dense layer around the burst. This is also supported by the observation of GRB 010222. For this burst, the surrounding medium is indeed the interstellar medium (see Fig. 8). in’t Zand et al. (2001) has proposed this burst to be surrounded by a very dense ( cm-3) medium or affected by a jet effect. We can discard the jet effects (see Fig. 8), and thus confirm the proposed explanation. Such a medium, with a large density, would be very efficient to maintain the termination shock nearby the GRB progenitor.
Finally, we would like to underline the fact that inferences drawn from our afterglow analysis are in general agreement with those of the reviews of Frontera et al. (2003) and Piro (2004). This is not very surprising, however, because of the wide consistency of Frontera et al. (2003) results with ours, while Piro (2004) used a large part of the same GRB X-ray afterglow set and basically the same data analysis to derive his conclusions.
4 Dark GRBs
About 90 % of the GRBs detected by BeppoSAX present an X-ray afterglow. On the other hand, only 16 GRBs present an optical afterglow. Taking into account the late follow up of GRB 960720 and the absence of optical observations of GRB 980515 and GRB 020427, this implies that only 42 % of the GRBs detected by BeppoSAX have an identified optical afterglow. This led to the definition of the so called Dark bursts (De Pasquale et al. 2003). Several authors (e.g. Fynbo et al. 2001; Fox et al. 2003; Rol et al. 2005) pointed out that this definition can in fact hide an instrumental bias (as this does not take into account the date of the optical follow up and the decay rate of the optical afterglow). In fact, the non detection of the optical afterglow can be due to several reasons: a late follow up, a steep decay, an intrinsic faintness, a large dust extinction and a distant burst. While the first two possibilities are instrumental bias, the last three give information about the burst.
For those bursts with a rapid optical follow up and a non detection of the optical follow up, it has been shown that on average the optical flux should be magnitude lower than bursts with an optical afterglow in order to explain the non detection of the optical source (Lazzati et al. 2002). Another study made with a sample of 31 BeppoSAX GRB afterglows indicated that the X-ray afterglow fluxes of dark GRBs are, on average, times weaker than those of normal bursts (De Pasquale et al. 2003). The probability that this flux distribution comes from a single population of burst is 0.002, i.e.a rejection. Using the whole BeppoSAX sample, this probability does not change significantly.
The results exposed in Sec. 3.3 imply that this X-ray faintness should extend to the prompt phase, and thus that dark GRBs should present a fainter -ray fluence. We have tested this hypothesis and present the result in Fig. 11. As one can see, there is indeed a trend for the dark burst (dotted line) to have a low -ray fluence compared to GRBs with optical transient (OT GRBs). The ratio between the average dark GRB fluence and OT GRBs fluence is 5.7, similar to the value of the ratio of X-ray fluxes and the expected value derived from the correlation observed in Sec. 3.3. The probability that optically bright GRBs and dark GRBs fluence distributions derive from an unique population of burst is 0.01. It thus seems that faintness is an intrinsic property of dark GRBs at all wavelengths.
The above statements can explain the non detection of the optical afterglow. But they imply that the whole afterglow is affected by this effect (i.e. the faintness is observed in all the observation bands). On the contrary, extinct optical afterglow and distant bursts should also feature a faintness that is wavelength dependent (due to dust-to gas laws in the first case and due to the Lymann- forest redshifted in the optical band in the second case). To discriminate all these effects and to validate their interpretation, De Pasquale et al. (2003) also carried out a comparison of the X-ray and optical fluxes. They found that 75 % of dark bursts were compatible with a global faintness, and thus that these bursts were dark because searches were not fast or deep enough.
For the remaining GRBs, the optical-to-X-ray flux ratio is at least a factor 5-10 lower than the average value observed in normal GRBs. In terms of spectral index, these events have optical to X-ray spectral index , whereas for OT GRBs the average value is . These facts strongly suggest that for these bursts the spectrum is depleted in the optical band. Jacobsson et al. (2004), using a similar method and comparing their results with the fireball model expectations, indicated that at least 10 % of their sample was not compatible with the fireball model and thus were truly dark GRBs. It is worth noting that the Swift mission (Gehrels et al. 2005), recently begun, has already confirmed that a considerable fraction of GRBs has tight upper limits for the optical emission (Roming et al. 2005, in preparation) We can thus indicate that about 10-20 % of GRBs is characterized by an optical afterglow emission fainter than that expected from the X-ray afterglow flux. These bursts could be distant (z) or extinct bursts.
Two dark bursts have been associated with host galaxies at z (Djorgovski et al. 2001; Piro et al. 2002). We also note (see Table 1) that the X-ray absorption around some bursts is important and could be responsible of an important optical extinction (see e.g. Stratta et al. 2004). Thus, for some of these events, the likely explanation of the darkness is an optical depletion by dust in star forming region. This in turn supports the massive star progenitor hypothesis for long GRBs, as these massive stars are likely to explode in their original star forming region. On the other hand, this does not rule out the distance explanation for some dark bursts with no known host. In fact, it is likely that the dark burst population is the sum of these three (faint, distant and extinct) populations. In principle, these cases could be disentangled by other measurements such as column density, prompt Epeak, X-ray flux. However, it is important to be cautious, because a few X-ray flashes (see Heise et al. 2001) could have the values of these parameters consistent with those of very high redshift GRBs, even if they are not actually placed at .

5 Conclusions
We have presented the BeppoSAX X-ray afterglow catalog. Thirty-nine BeppoSAX afterglow observations were carried out on a sample of 52 detected GRBs. Thirty-one X-ray afterglows were securely identified due to their fading behavior. Three other observations led to the detection of only one source within the prompt positional error box. Thus, X-ray afterglows are present in % of the observations.
We derived the main properties - flux, decay index, spectral index, absorption - for 15 afterglows, and give constraints on decay slope and flux for the remaining. The width of the prompt fluence and X-ray afterglow flux distributions are similar, suggesting no strong spatial variation of the energy emission within the beamed fireball. We pointed out a likely correlation between the X-ray afterglow luminosity and the energy emitted during the prompt -ray event. Such a correlation suggests that the fraction of fireball energy carried by relativistic electrons in the external shock and emitted in the afterglow is roughly proportional to the fraction of the fireball relativistic energy converted into -ray during the prompt phase.
We do not detect significant jet signature within the afterglow observations, implying a lower limit on the beaming angle of . Moreover, we note that the hypothesis of standard energy release in the afterglow as claimed by Berger et al. (2003) may be consistent with our sample, but it strongly depends on the assumptions made about the density of the surrounding medium.
The average value of the spectral index of the electron energy distribution, inferred by our time and spectral analysis, is .
Our data support the fact that GRBs should be typically surrounded by a medium with a constant density rather than a wind environment, and that this medium should be dense. This may be explained by a termination shock located near the burst progenitor. We finally pointed out that some bursts without optical counterpart may be explained by an intrinsic faintness of the event, while others can be strongly absorbed.
A first comparison with the bursts observed by XMM-Newton and Chandra are presented in Gendre et al. (2005). In a forthcoming paper (Gendre et al., in preparation), we will search the spectra for metal lines and other deviations from the continuum properties.
Acknowledgements.
The BeppoSAX satellite was a joint program of Italian (ASI) and Dutch (NIVR) space agencies. BG acknowledges a support by the EU FP5 RTN ’Gamma ray bursts: an enigma and a tool’.References
- Amati et al. (1998) Amati L., Frontera F., Costa E., Feroci, M., 1998, GCN #146
- Amati et al. (1999) Amati L., 1999, private comunication
- Amati et al. (2002) Amati L., Frontera F., Tavani M. et al. 2002, A&A, 390, 81
- Amati et al. (2003) Amati L., Frontera F., Castro-Ceron J.M. et al, 2003, Prooceedings of “GRB and Afterglow Astronomy 2001”, AIP Conference Proceedings, 662, 387
- Amati et al. (2004) Amati L., Frontera F., in’t Zand J. et al. 2004, A&A, 426, 415
- Antonelli et al. (1999) Antonelli L.A., Fiore F., Amati L. et al. 1999, A&AS, 138,435
- Antonelli et al. (2000) Antonelli, L. A., Piro, L., Vietri, M. et al. 2000, ApJ, 545L, 39
- Berger et al. (2003) Berger E., Kulkarni S.R. & Frail D.A., 2003, ApJ, 590, 379
- Bloom et al. (1998) Bloom J.S. Frail D.A., Kulkarni S.R. et al., 1998, ApJ, 508, L21
- Bloom et al. (2002) Bloom J.S., Mirabal N., Helpern J.P., Fox, D.W., Lopes, P.A.A., 2002, GCN #1296
- Boella et al. (1997) Boella G., Butler, R.C., Perola, G.C., et al., 1997, A&AS, 122, 299
- Chevalier & Li (1999) Chevalier, R.A., & Li, Z.Y., 1999, ApJ, 520, L29
- Chevalier et al. (2004) Chevalier, R.A., Li, Z.Y., & Fransson, C., 2004, ApJ, 606, 369
- Chincarini et al. (2005) Chincarini, G., Moretti, A., Romano, P., et al., 2005, submitted to ApJ, astro-ph/0506453
- Cornelisse et al. (2002) Cornelisse R., Verbunt F, in ’t Zand J., et al., 2002, A&A, 392, 885
- Costa et al. (1997) Costa E., Frontera F., Heise J., et al. 1997, Nature, 387, 783
- Dal Fiume D. et al. (2000) Dal Fiume D., Amati, L., Antonelli, L. A., 2000, A&A, 355, 454
- De Pasquale et al. (2003) De Pasquale M., Piro L., Perna R., et al. 2003, ApJ, 592, 1018
- Diercks et al. (1998) Diercks A.H., Deutsch E.W., Castander F.J., et al. 1998, ApJ, 503, L105
- Djorgovski et al. (2001) Djorgovski, S.G., Frail, D. A.; Kulkarni, S. R., et al., 2001, ApJ, 562, 654
- Feroci et al. (1998) Feroci, M., Antonelli, L.A., Guainazzi, M., et al., 1998, A&A, 332, L29
- Feroci et al. (2001) Feroci M., Antonelli, L. A., Soffitta, P., et al., 2001, A&A, 378, 441
-
Fiore et al. (1999)
Fiore F., Guinazzi M. & Grandi P., 1999, Handbook for BeppoSAX NFI Spectral Analysis, ftp:
www.sdc.asi.it/pub/sax/doc/software_docs/saxabc_v1.2.ps.gz - Fox et al. (2003) Fox, D.W., Price, P.A., Soderberg, A.M., et al., 2003, ApJ, 586, L5
- Frail et al. (1997) Frail D.A., Kulkarni S.R., Nicastro S.R., Feroci, M., Taylor, G. B., 1997, Nature, 389, 261
- Frail et al. (2001) Frail D.A., Kulkarni S.R., Sari R., et al. ApJ, 2001, 562, L55
- Freedman & Waxman (2001) Freedman D. & Waxman E., 2001 ApJ, 547, 922
- Frontera et al. (1997) Frontera, F., Costa, E., Dal Fiume, D., et al., 1997, A&AS, 122, 357
- Frontera et al. (1998) Frontera F., Costa E., Dal Fiume D. et al, 1998, ApJ, 493L, 67
- Frontera et al. (2000a) Frontera F., Amati L., Costa, E., et al., 2000a, ApJS, 127, 59
- Frontera et al. (2000b) Frontera F., Antonelli L. A., Amati L., et al. 2000b, ApJ, 540, 697
- Frontera et al. (2004) Frontera F., 2004, Proceedings of “GRBs in the afterglow Era 2002”, ASP conference series, 312, 3
- Frontera et al. (2003) Frontera F., 2003, Lecture Notes in Physics, 598, p.317 (astro-ph/0406579)
- Fynbo et al. (2001) Fynbo, J.U., Jensen, B.L., Gorosabel, J., et al., 2001, A&A, 369, 373
- Galama et al. (1998) Galama T.J., Groot, P.J., van Paradijis J., et al., 1998, ApJ, 497, L13
- Gandolfi et al. (1999) Gandolfi, G., Soffitta, P., Heise, J., et al., 1999, GCN #448
- Gehrels et al. (2005) Gehrels, N., Chincarini, G., Giommi, P., et al., 2005, ApJ, 611, 1005
- Gendre et al. (2005) Gendre, B., Corsi, A., & Piro, L, 2005 submited to A&A
- Giommi et al. (2000) Giommi, P., Perri, M., & Fiore, F., 2000, A&A, 362, 799
- Greiner et al. (2002) Greiner J, Thiele U., Klose S., Castro-Tirado, A.J., 2002, GCN #1298
- Guidorzi et al. (2000) Guidorzi C., Montanari E., Frontera F., et al., 2000, GCN #675
- Guidorzi et al. (2003) Guidorzi C., Frontera, F., Montanari, E., et al., 2003, A&A, 401, 491
- Harrison et al. (1999) Harrison F.A., Bloom J.S., Frail D.A., et al., 1999, ApJ, 523, L121
- Heise et al. (2002) Heise J., in ’t Zand J., Kippen M. et al. 2002, Proceedings of the 2000 Rome Workshop on ”Gamma Ray Burst in the Afterglow Era”, AIP, 229
- Hjorth et al. (2002) Hjorth J., Thomsen, B., Nielsen, S.R., et al., 2002, ApJ, 576, 113
- Hjorth et al. (2003) Hjorth J., Sollerman, J., Møller, P., et al. 2003, Nature, 423, 847
- Hurley et al. (2000) Hurley K., Mazets E., Golenetskii S., et al. 2000, GCN 801
- Jacobsson et al. (2003) Jakobsson, P., Hjorth, J., Fynbo, J.P.U., et al., 2003, A&A, 408, 941
- Jacobsson et al. (2004) Jakobsson, P., Hjorth, J., Fynbo, J.P.U., et al., 2004, ApJ, 617, L21
- Jager et al. (1997) Jager, R., Mels, W.A., Brinkman, A.C., et al., 1997, A&AS, 125 557
- Jaunsen et al. (2001) Jaunsen A.O., Hjorth J., Björnsson, G., et al., 2001, ApJ, 546, 127
- Klebesadel et al. (1973) Klebesadel, R.W., Strong, I.B., & Olson, R.A., 1973, ApJ, 182, L85
- Kobayashi et al. (1997) Kobayashi, S., Piran, T., Sari, R., 1997, ApJ, 490, 92
- Kulkarni et al. (1999) Kulkarni, S.R., Djorgovski, S.G., Odewahn, S.C., et al, 1999, Nature, 398, 389
- Kuulkers et al. (2000) Kuulkers, E., Antonelli, L.A., Kuiper, L, et al., 2000, ApJ, 538, 638
- Kumar & Piran (2000) Kumar, P., & Piran, T., 2000, ApJ, 535 152
- Lamb & Reichart (2000) Lamb, D. & Reichart, E., 2000, ApJ, 536, 1
- Lazzati et al. (2002) Lazzati, D., Covino, S., & Ghisellini, G., 2002, MNRAS, 330, 583
- Levine et al. (1998) Levine, A., Morgan, E., & Muno, M., 1998, IAUC 6966
- Maccacaro et al. (1988) Maccacaro T, Gioia I.M., Wolter A. et al., 1988, ApJ, 326, 680
- Maiorano et al. (2005) Maiorano E., Masetti N., Palazzi E. et al. 2005, A&A, in press (astro-ph/0504602)
- Masetti et al. (1998) Masetti N., Bartolini C., Guarnieri A., & Piccioni, A., 1998, Proceedings of the Active X-ray Sky symposium 1997, Editors L. Scarsi, H. Bradt, P. Giommi, and F. Fiore, p.674
- Masetti et al. (2001) Masetti N., Palazzi E., PianE. et al., 2001, A&A, 374, 382
- Meszaros & Rees (1997) Meszaros, P, & Rees, M.J., 1997, ApJ, 476, 232
- Metzger et al. (1997) Metzger, M.R., Djorgovski, S.G., Kulkarni, S.R., et al., 1997, Nature, 387, 879
- Montanari et al. (2002) Montanari, E., Amati, L., Frontera, F., et al., 2002, Proceedings of “2nd Rome Workshop on Gamma-Ray Burst in the afterglow Era”, 195
- Muller et al. (1999b) Muller, J.M, Costa, E., Gandolfi, G., et al., 1999b, IAUC 7211
- Nicastro et al. (1998) Nicastro, L. Amati, L. Antonelli, L. A. et al., 1998, A&A 338, L17
- Nicastro et al. (1999) Nicastro L., Amati, L., Antonelli, L.A., et al., 1999, A&AS, 138, 437
- Nicastro et al. (2001) Nicastro L., Cusumano G., Antonelli L.A., et al. 2001, Proceedings of “GRBs in the afterglow Era 2000”, Eds Enrico Costa, Filippo Frontera, and Jens Hjorth, 198
- Nicastro et al. (2004) Nicastro L., in’t Zand, J.; Amati, L., et al. 2004, A&A, 427, 445
- Panaitescu et al. (1998) Panaitescu, A., Meszaros, P., & Rees, M.J., 1998, ApJ, 503, 314
- Panaitescu & Kuman (2002) Panaitescu, A., & Kumar, P., 2002, ApJ, 571, 779
- Parmar et al. (1997) Parmar, A.N., Martin, D.D.E., Bavdaz, M., et al. 1997, A&AS, 122, 309
- Pian et al. (1999) Pian E. Amati, L., Antonelli, L. A., et al., 1999, A&AS, 138, 463
- Pian et al. (2000) Pian, E., Amati L., Antonelli, L. A. et al., 2000, ApJ, 536, 778
- Piran et al. (2001) Piran, T., Kumar, P., Panaitescu, A., & Piro, L., 2001, ApJ, 560, L167
- Piro (1995) Piro, L., 1995, “SAX Observer Handbook”, Agenzia Spaziale Italiana, —c1995, Issue 1.0, edited by Piro, L.
- Piro et al. (1998) Piro, L., Heise, J., Jager, R., et al., 1998, A&A, 329, 906
- Piro et al. (1998b) Piro, L., Amati, L., Antonelli, L.A. et al., 1998b, A&A, 331, L41
- Piro et al (1999) Piro L., Costa, E., Feroci, M. et al., 1999, 514, L73
- Piro et al. (2001) Piro, L., Garmire, G., Garcia, M., et al., 2001, ApJ, 558, 442
- Piro et al. (2002) Piro, L., Frail, D.A., Gorosabel, J., et al. 2002, ApJ, 577, 680
- Piro (2004) Piro, L., 2004, Proceedings of “GRBs in the afterglow Era 2002”, ASP conference series, p. 149
- Piro et al. (2005) Piro, L., De Pasquale, M., Soffita, P., et al., 2005, ApJ, 623, 314
- Price et al. (2002) Price, P., Berger, E., Reichart, D.E., et al., 2002, ApJ572, L51
- Ramirez-Ruiz et al. (2001) Ramirez-Ruiz, E., Dray, L.M., Madau, P., Tout, C.A., 2001, MNRAS, 327, 829
- Rees & Meszaros (1992) Rees, M.J., & Meszaros, P., 1992, MNRAS, 258, 41
- Reichart et al. (1999) Reichart, D.E., Lamb, D.Q, Metzger, M.R., et al., 1999, ApJ, 517, 692
- Rhoads (1997) Rhoads, J.E., 1997, ApJ, 487, L1
- Rol et al. (2005) Rol, E., Wijers, R.A.M.J., Kouveliotou, C., Kaper, L., Kaneko, Y., ApJ, 624, 868
- Sari et al. (1998) Sari, R., Piran, T., & Narayan, N., 1998, ApJ, 497, L17
- Sari et al. (1999) Sari, R., Piran, T., & Helpern, J.P., 1999, ApJ, 519, L17
- Soffitta et al. (2002) Soffitta P., Amati L., Antonelli L.A., et al., 2002, Proceedings of “GRB in the Afterglow Era 2000”, p.201
- Stanek et al. (2003) Stanek, K.Z., Matheson, T., Garnavich, P. M., et al., 2003, ApJ, 591, L17
- Stratta et al. (2004) Stratta, G., Fiore, F., Antonelli, L.A., et al., 2004, ApJ, 608, 846
- Tassone et al. (1999) Tassone, G., in ’t Zand, J., Frontera, F., & Gandolfi, G., 1999, IAUC #7281
- van Paradijis et al. (1997) van Paradijs, J., Groot, P.J., Galama, T.J., et al., 1997, Nature, 386, 686
- Vreeswijk et al. (1999) Vreeswijk, P. M., Galama, T. J., Owens, A., 1999, ApJ, 528, 171
- Woosley (1993) Woosley, S., 1993, ApJ, 405, 273
- in’t Zand et al. (1998) in ’t Zand J., Amati, L., Antonelli, L. A. et al., ApJ, 505L 119
- in’t Zand et al. (1999) in’t Zand J., Heise, J., van Paradijs, J., & Fenimore, E. E., 1999, ApJ, 516, L57
- in’t Zand et al. (2000a) in’t Zand J., Heise J., Kuulkers E. et al. 2000a, GCN #677
- in’t Zand et al. (2000b) in’t Zand J., Kuiper L., Amati L., et al. 2000b, ApJ, 545, 266
- in’t Zand et al. (2001) in’t Zand J., Kuiper L., Amati, L. et al., 2001, ApJ559, 710
- in’t Zand et al. (2004) in’t Zand J., Kuiper L., Heise J. et al. 2004, Proceedings of “GRBs in the afterglow Era 2002”, ASP Conference Series, p. 209
[x]lcccccl
GRBs localized and/or observed by BeppoSAX.
We indicate the position the first TOO start and end times, the sum
of the Good Time Interval (GTI), and the date of the subsequent
TOOs. A ’WFC’ following the position means that this GRB was
localized only the the WFC, ’NFI’ a localization obtained by NFI. An
external trigger of a BeppoSAX TOO is indicated by giving in
parenthesis the satellite that localized the burst, but the
localization displayed has been provided by NFI. We also indicate in
the table if an optical afterglow was detected together with the
distance and other information obtained from the
optical study.
GRB name Position Localization First TOO Sum of Other TOOs Optical afterglow
(Right Ascention, start-end GTIa start-end detection (redshift)
Declination) (hours) (ksec) (hours)
\endfirstheadcontinued.
GRB name Position Localization First TOO Sum of Other TOOs Optical afterglow
(Right Ascension, start-end GTIa start-end detection (redshift)
Declination) (hours) (ksec) (hours)
\endhead\endfootGRB 960720 WFC 3715-3765.2 49.1 — N
GRB 970111 NFI 16-46.5 56 — N
GRB 970228 NFI 8-16.7 14.3 89.6 - 98.8 Y (z=0.695)
GRB 970402 NFI 8-19 23.6 40.9-58.5 N
GRB 970508 NFI 6-21.6 35.5 66-74 Y (z=0.835)
136.3-160
GRB 971214 NFI 6.5-60.7 101 — Y (z=3.42)
GRB 971227 NFI 12-31.2 37 — N
GRB 980109 WFC — — — N
GRB 980326 WFC — — — Y
GRB 980329 NFI 7-48.6 63.8 — Y
GRB 980425 NFI 10.2-52.4 52.1 161-185 SN (z=0.0085)
Nov 10.75-12
GRB 980515 NFI 10-47.2 49.1 218-265 No study
GRB 980519 NFI 9.7-35.2 78 — Y
GRB 980613 NFI 8.6-35.3 61.5 — Y (z=1.1)
GRB 980703 (RXTE) 22.3-45.6 39.2 110.3-132.6 Y (z=0.97)
GRB 981226 NFI 6.5-61 89 172-191 N
GRB 990123 NFI 5.8-53.9 81.9 — Y (z=1.62)
GRB 990217 NFI 6-44 56.4 — N
GRB 990510 NFI 8-44.4 67.9 — Y (z=1.6)
GRB 990625 WFC — — — No study
GRB 990627 NFI 8-39.7 30 — N
GRB 990704 NFI 7.5-29.5 37 169.8-195 N
GRB 990705 WFC 11-33.8 77.8 — Y (z=0.86)
GRB 990712 WFC — — — Y (z=0.43)
GRB 990806 NFI 8-48.9 77.9 — N
GRB 990907 NFI 11-11.4 1.1 — N
GRB 990908 WFC — — — N
GRB 991014 NFI 13-33.9 36.1 258-285.8 N
GRB 991105 WFC — — — N
GRB 991106 NFI 8-26.8 31.6 — N
GRB 000210 NFI 7.2-40.2 44.4 — N (z=0.835)
GRB 000214 NFI 12-41.5 50.8 — N (z=0.37-0.47)
GRB 000528 NFI 12-27.3 26.6 78.8-99 N
GRB 000529 NFI 7.4-50.5 34.8 — N
GRB 000615 NFI 10-41.6 44.6 — N
GRB 000620 WFC — — — N
GRB 000926 (IPN) 48.9-61 19.6 — Y (z=2.066)
GRB 001011 WFC — — — N
GRB 001109 NFI 16-37.8 33.2 70-106 N
GRB 010213 WFC — — — no study
GRB 010214 NFI 6-51.8 83 — N
GRB 010220 WFC 15-36 17.2 — N
GRB 010222 NFI 8-64 88.3 — Y (z=1.48)
GRB 010304 WFC — — — no study
GRB 010412 WFC — — — N
GRB 010501 WFC — — — no study
GRB 010518 WFC — — — no study
GRB 011121 NFI 21.9-65 32.5 86.7-120 Y (z=0.36)
GRB 011211 WFC — — — Y (z=2.14)
GRB 020321 WFC 6-10.8 6.1 — N
GRB 020322 NFI 6-12.4 12.3 26.8-33.2 Y
GRB 020409 WFC — — — N
GRB 020410 NFI 20-27.5 22.8 54.3-59.6 Y
GRB 020427 NFI 11-14.3 6.8 60.2-66 N
First TOO.
[x]lccccc
Properties of the prompt emission of BeppoSAX
Gamma Ray Bursts reported in Table The BeppoSAX catalog of GRB X-ray afterglow observations. We indicate the
duration and fluence both in X-ray (2.0-10.0 keV band) and
-ray (40.0-700) keV band. A X following the source name
denotes an X-ray rich GRB or an X-ray flash
GRB name -ray X-ray -ray X-ray Ref.
duration duration fluence fluence
(T, s) (T, s) erg cm-2 erg cm-2
\endfirstheadcontinued.
GRB name -ray X-ray -ray X-ray Ref.
duration duration fluence fluence
(T, s) (T, s) erg cm-2 erg cm-2
\endhead\endfootGRB 960720 8 17 1, 2, 3
GRB 970111 43 60 4, 2, 3
GRB 970228 80 80 5
GRB 970402 150 150 2
GRB 970508 15 29 5
GRB 971214 35 35 5,3
GRB 971227 7 7 1 6,3
GRB 980109 20 20 — 3,7
GRB 980326 9 9 5, 3
GRB 980329 58 68 5,
GRB 980425 31 40 2, 3
GRB 980515 15 20 - 7, 3
GRB 980519 30 190 18 8,9, 3
GRB 980613 50 50 5, 3
GRB 981226X 20 260 10,3
GRB 980703 90 — — 11
GRB 990123 100 100 5, 3
GRB 990217 25 25 — 7, 3
GRB 990510 75 80 3, 5
GRB 990625 11 11 — — 3
GRB 990627 28 60 — 3,12
GRB 990704X 23 40 13, 3
GRB 990705 42 45 5, 3
GRB 990712 30 30 5, 3
GRB 990806 30 30 14, 3
GRB 990907 1 220 — — 3
GRB 990908 50 130 — — 3
GRB 991014 3 10 1 15,16, 3
GRB 991105 13 40 — — 3
GRB 991106a — 5 b 17
GRB 000210 10 115 18, 3
GRB 000214 115 100 5, 3
GRB 000528 80 120 — 19, 20
GRB 000529 14 30 — — 3
GRB 000615X 12 120 21, 3
GRB 000620 15 20 — — 3
GRB 001011 31 60 — — 3
GRB 001109 60 65 22, 3
GRB 010213 23 25 — — 3
GRB 010214 15 30 23
GRB 010220 40 150 — — 3
GRB 010222 170 280 5, 3
GRB 010304 15 24 — — 3
GRB 010501 37 41 — — 3
GRB 010412 74 90 — — 3
GRB 010518 25 30 — — 3
GRB 011121 105 100 24, 3
GRB 011211 400 400 24, 3
GRB 020321 70 90 30 0.9 25, 3
GRB 020322 15 50 — — 3
GRB 020409 40 60 — — 3
GRB 020410 1800 1290 26, 3
GRB 020427X — 60 27, 3
Perhaps not a GRB. See Cornelisse et al. 2000.
Conservative upper limit based on GCN 448
References : 1: Piro et al. (1998), 2: Frontera et al. (2000a), 3: Frontera et al. (2004), 4: Feroci et al. (1998), 5: Amati et al. (2002), 6. Antonelli et al. (1999), 7: Amati et al. (1999), 8 : Nicastro et al. (1999), 9 : in’t Zand et al. (1999), 10: Frontera et al. (2000b), 11: Amati et al. (1998), 12: Muller et al. (1999b), 13: Feroci et al. (2001), 14: Montanari et al. (2002), 15: Tassone et al. (1999), 16: in’t Zand et al. (2000b), 17: Gandolfi et al. (1999), 18: Piro et al. (2002), 19: Guidorzi et al. (2000), 20: in’t Zand et al. (2000a), 21: Nicastro et al. (2001), 22: Guidorzi et al. (2003), 23: Guidorzi et al. (2003), 24: Piro et al. (2005), 25: in’t Zand et al. (2004), 26: Nicastro et al. (2004), 27: Amati et al. (2004).
Note 1: When not available, values of 2-10 keV fluences have been calculated from the 2-26 keV fluences and assuming the spectral parameters reported in the references.
Note 2: The X-ray and fluences reported by Amati et al. (2002) have been obtained by reporting at z the parameters of the WFC and GRBM spectra fit (see table 2 of the same article).


