1–6
A Spitzer/IRAC Survey of Massive Star-Forming Regions
Abstract
We are conducting a survey of several regions of high-mass star formation to assess their content and structure. The observations include Spitzer observations, ground-based optical and near-IR imaging surveys, and optical and IR spectra of objects and locations in the molecular clouds. The goal of the survey is to gain a better understanding of the processes involved in high mass star formation by determining the characteristics of the stars detected in these regions and investigating the properties of the interstellar medium (ISM) environment in which these stars form. In this contribution, we present results on the identification and spatial analysis of young stars in three clusters, W5/AFGL 4029, S255, and S235. First we show how the IRAC data are used to roughly segregate young stars according to their mid-infrared colors, into two groups corresponding the SED Class I and Class II young stellar objects. Then using the IRAC data in combination with 2MASS, we show how more young stars can be identified. Finally, we examine the spatial distributions of young stars in these clusters and find a range of morphologies and of peak surface densities.
keywords:
Stars:formation, Stars:pre–main–sequence, ISM: HII regions, Infrared:stars1 Introduction
Star formation is a self regulating process: once stars form they immediately begin to alter and disrupt their natal environments and eventually destroy their parental molecular clouds. A detailed understanding of this feedback is a necessary step toward developing a theory of the star formation efficiency and initial mass function in molecular clouds. The destruction of giant molecular clouds by OB stars is best studied in bright rimmed clouds, regions where an edge–on molecular cloud surface is externally illuminated by nearby young massive stars. The edge–on geometry of the resulting molecular cloud/H ii region interface provides a cross section of the photoevaporation process. At such an interface, the ionization front advances into the molecular cloud as the H ii region expands. The shock fronts associated with these disruptive processes may trigger secondary or sequential star formation. In order to investigate these processes, we have initiated a survey of massive star forming regions with prominent infrared photodissociation regions. In this contribution we report on the spatial distributions of young stars in three such regions.
2 Observations
The Spitzer data were obtained with the InfraRed Array Camera (IRAC; Fazio et al. 2004). For each region, a map was made in all 4 IRAC bands covering 0.25 deg2. An integration time of 12 seconds per dither, with 3 dithers per map position, was used. Short integration frames (0.6 sec) were also obtained at each position, for the recovery of bright sources that are saturated in the longer frames. The Basic Calibrated Data frames, products of the Spitzer Science Center pipeline, were used to construct mosaics in each IRAC band. Photometry was performed on the mosaics, and photometric completeness limits were estimated to be 16, 15, 14 and 13 mag. at 3.6, 4.5, 5.8 and 8 m, respectively.
3 Identifying Young Stars
3.1 IRAC only
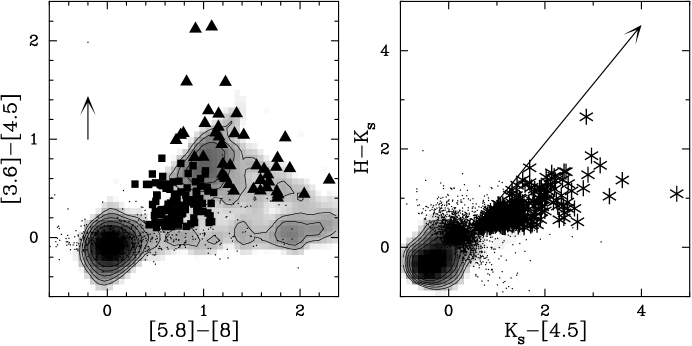
By comparing the measured IRAC colors with model predictions, we have found that young stars occupy somewhat distinguishable regions in the IRAC color-color diagram, corresponding to their SED class (Allen et al. 2004; Megeath et al. 2004; see also Whitney et al. 2004). This was recently verified using data for the Taurus molecular cloud, in which the nature of individual sources is well known (Hartmann et al. 2005). The IRAC color-color diagram for W5/AFGL 4029 is shown in Figure 1 (left panel). Most of the sources are concentrated in three groups. Near (0,0) the sample consists of field stars, background stars with modest or no reddening, and young stars with no infrared excess emission in the IRAC bands (points). Since we cannot distinguish between these, we shall limit our analysis to the remaining two groups: one group occupying the range (x,y)=(0.4,0.2) to (1.1,0.8) corresponds to the colors of Class II objects, or young stars with accretion disks (squares), and a more dispersed group redward of the Class II domain containing Class I sources, or stars with disks and infalling envelopes (triangles).
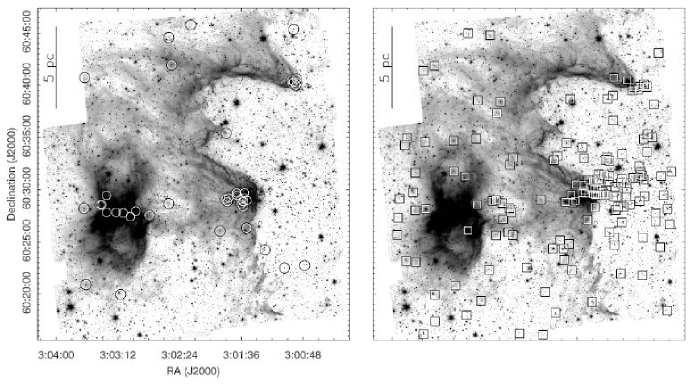
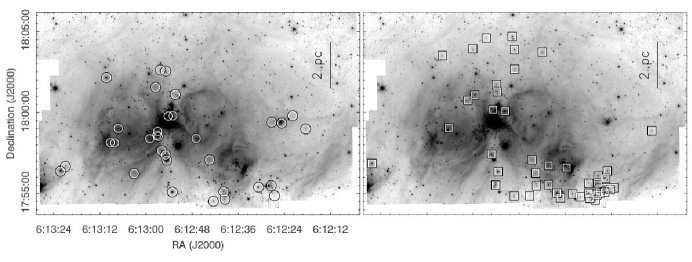
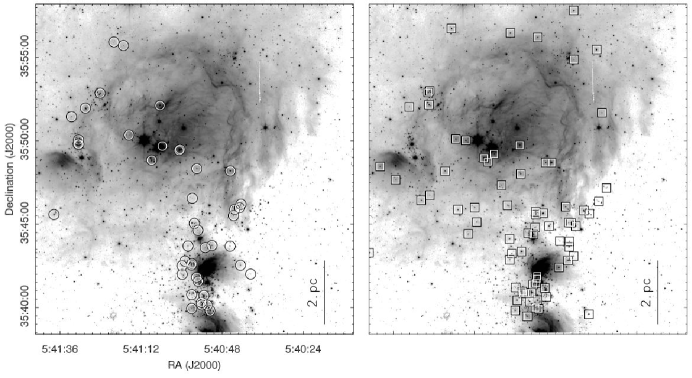
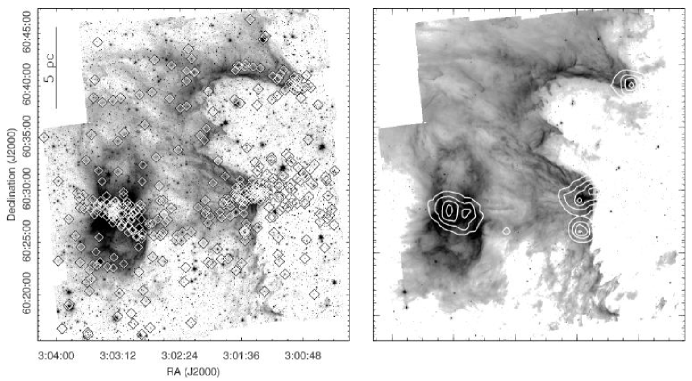
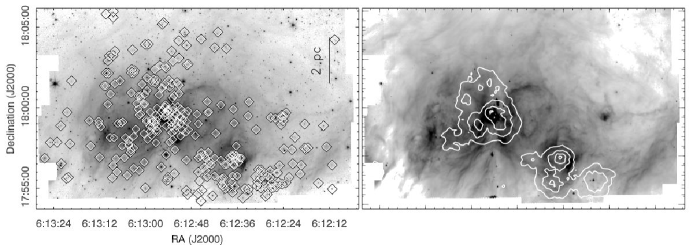
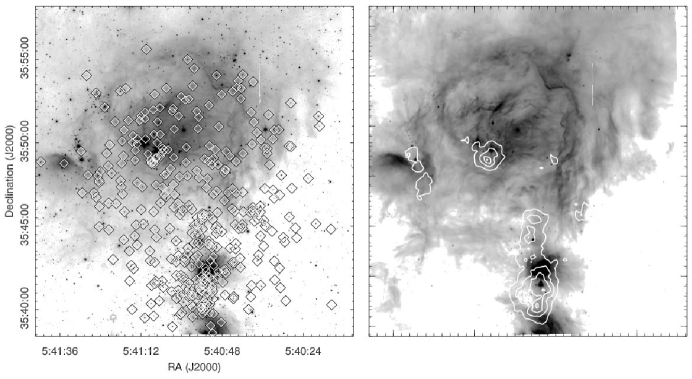
Due to the sensitivity of the IRAC observations and the relative transparency of molecular clouds in the mid-infrared, contamination of our sample by background stars and galaxies is probable. Here we attempt to quantify that contamination, using data from the IRAC Shallow Survey, which imaged 8.5 deg2 in Boötes (Eisenhardt et al. 2004). Because the Shallow Survey was significantly deeper than our observations, we first selected only those sources with magnitudes equal to or brighter than the completeness limits of our study. Next we scaled the Shallow Survey data by the area of our map. The resulting distribution of IRAC colors from the Shallow Survey are plotted as contours in number of sources per map area, in Figure 1. Among the Class I and II sources, the highest concentration of background sources is in the boundary between the Class I and Class II domains, where there may be as many as 20 background sources, mostly AGN (Stern et al. 2005). In Figure 2, we show the spatial distributions of Class I and Class II sources in W5/AFGL 4029. Most of the Class I sources are concentrated in the embedded clusters near the edge of the molecular cloud, while the Class II sources are more widely distributed and include stars located in the adjacent H ii region. In Figures 3 and 4, we plot the distributions of Class I and II sources in S255 and S235, respectively. They show similar behavior to W5 in the relative spatial distributions of Class I and II sources.
3.2 IRAC and 2MASS combined
While the IRAC colors are effective for finding Class I and Class II sources, the technique is limited to those stars detected in all four IRAC bands. Because IRAC is more sensitive to stellar photospheres at 3.6 and 4.5 m than at 5.8 or 8.0 m, we can use a combination of near-IR fluxes and fluxes in the first two IRAC bands to identify more young stars by their infrared excess. In Figure 1 (right panel) we show one such attempt, using 2MASS H, Ks and IRAC 4.5 m photometry. Points to the right of the reddening vector are stars with infrared excess. As in the left panel, we have plotted the contaminating background colors as contours of surface density. The numbers are negligible in the region of IR excess sources.
4 Spatial Distributions and Surface Densities of Young Stars
Using the combined 2MASSIRAC data as described in the previous section, we plot the distribution of all IR excess sources in W5/AFGL 4029 (Figure 5, left panel). In general, they follow the distribution of the Class II sources in Figure 2, but are more numerous. In the right panel of Figure 5 is shown the surface density of the young stars, where the lowest contour level corresponds to approximately 10% of the peak value of 5000 stars pc-2. At a distance of 2 kpc, W5 is comprised of several overlapping bubbles of ionized gas, extending over 2 x 1.5 degrees on the sky. The easternmost bubble is ionized by an O7 star. AFGL 4029 borders the eastern edge of this bubble, and has been the subject of several previous investigations. Both Wilking et al. (1984) and Karr & Martin (2003) analyzed the distribution of IRAS sources across the region. Their consideration of the timescales for star formation and the expansion of the H ii region led them to conclude that triggering is a plausible mechanism for the star formation observed there. The IRAC data support this scenario: the protostars are tightly clustered in two groups on the edge of the molecular cloud, coincident with the H ii/molecular interface. The (presumably more evolved) Class II stars are more widely dispersed, both inside the cloud and in the adjacent H ii region. The Spitzer/IRAC images also highlight the interface between the molecular and ionized gas, and provide a dramatic illustration of the edge–on geometry of the region. Spatial distributions and surface densities of S255 and S235 are shown in Figures 6 and 7, respectively.
While the peak surface densities measured here range from 2000 stars pc-2 in S235 to 5000 stars pc-2 in W5/AFGL 4029 (with a peak in S255 of 4000 stars pc-2), our survey is complete only to stars of spectral type K5 for a population of age 2 Myr. Assuming these clusters are forming stars in accordance with the IMF measured in nearby star-forming regions (Meyer et al. 2000), then the actual surface densities are probably 2–10 times higher.
5 Summary
We have conducted a Spitzer/IRAC survey of the three massive star-forming regions W5/AFGL 4029, S255 and S235. We find that IRAC colors are useful for identifying Class I and II young stellar objects. When combined with near-IR fluxes from 2MASS, all of the young stars with infrared excess can be identified. Class II objects are more widely distributed than Class I, and the IR-excess sources identified using IRAC2MASS are more widely distributed still. The peak surface densities of young stars of mass 1 M⊙ range from 2000 to 5000 stars pc-2. When the incompleteness of the survey is taken into account, peak surface densities may be higher by a factor of 2 to 10.
Acknowledgements.
The original P.I. of this IRAC GTO program was Lynne K. Deutsch, who died on April 2, 2004. She is dearly missed. This work is based on observations made with the Spitzer Space Telescope, operated by the Jet Propulsion Laboratory under NASA contract 1407.References
- [Allen et al. (2004)] Allen, L. E., Calvet, N., D’Alessio, P., Merin, B., Hartmann, L., Megeath, S. T., Gutermuth, R., Muzerolle, J., Pipher, J., Myers, P. & Fazio, G. G. 2004, ApJSS, 154, 363
- [Eisenhardt et al. (2004)] Eisenhardt, P. R., et al. 2004, ApJSS, 154, 48
- [Fazio et al. (2004)] Fazio, G. G. et al. 2004, ApJSS, 154, 10
- [Hartmann et al (2005)] Hartmann, L., Megeath, S. T., Allen, L., Luhman, K., Calvet, N., D’Alessio, P., Franco-Hernandez, R., Fazio, G. 2005, ApJ, in press
- [Karr & Martin (2003)] Karr, J. L. & Martin, P. G. 2003, ApJ, 595, 100
- [Megeath et al. (2004)] Megeath, S. T., Allen, L. E., Gutermuth, R., Pipher, J., Myers, P., Calvet, N., Hartmann, L., Muzerolle, J. & Fazio G. G. 2004, ApJSS, 154, 367
- [Meyer et al (2000)] Meyer, M. R., Adams, F. C., Hillenbrand, L. A., Carpenter, J. M. & Larson, R. B. 2000, in Protostars and Planets IV, p. 121, Univ. Arizona Press, Mannings, Boss & Russell, eds.
- [Stern et al. (2005)] Stern, D., Eisenhardt, P., Gorjian, V., Kochanek C. S., Caldwell, N., Eisenstein, D., Brodwin, M., Brown, M., Cool, R., Dey, A., Green, P., Jannuzi, B., Murray, S., Pahre, M. A., Willner, S. P. 2005, ApJL, in press
- [Whitney et al (2004)] Whitney, B. A., Indebetouw, R., Bjorkman, J. E. & Wood, K. 2004, ApJ, 617, 1177
- [Wilking et al (1984)] Wilking, B. A., Harvey, P. M., Lada, C. J., Joy, M. & Doering, C. R. 1984, ApJ, 279, 291