High-order 2MASS galaxy correlation functions: Probing the primordial density field and the linearity of galaxy bias
Abstract
We use the 2 Micron All Sky Survey (2MASS) extended source catalogue to determine area-averaged angular correlation functions, , to high orders (9). The main sample used contains 650 745 galaxies below an extinction-corrected magnitude of =13.5 and limited to 10∘ and represents an order of magnitude increase in solid angle over previous samples used in such analysis (34 000 deg2). The high-order correlation functions are used to determine the projected and real space hierarchical amplitudes, and . In contrast to recent results, for these parameters are found to be quite constant over a wide range of scales to 40Mpc, consistent with a Gaussian form to the primordial distribution of density fluctuations which has evolved under the action of gravitational instability. We test the sensitivity of our results to the presence of rare fluctuations in the local galaxy distribution by cutting various regions of over-density from the main sample; unlike previous analyses, we find that at least for 4, the high-order clustering statistics are relatively robust to the removal of the largest superclusters. Since we probe well into the linear regime we are able to make direct comparisons with perturbation theory; we use our constraints on the -band parameters in two ways. First, we examine their consistency with non-Gaussian initial conditions; we are able to rule out strong non-Gaussianity in the primordial density field, as might be seeded by topological defects such as cosmic strings or global textures, producing relations of the form , at the 2.5 confidence level. Second, we investigate the way in which galaxies trace the underlying mass distribution. We find evidence for a non-zero quadratic contribution to the galaxy bias, parameterised by =0.570.33. This positive result represents a significant difference from the negative values found previously; we examine a possible explanation in the light of recent observations which universally provide negative values for .
keywords:
surveys - galaxies: clustering - cosmology: observations - large-scale structure of the Universe - infrared: galaxies1 Introduction
The variance of local galaxy density fluctuations has been measured to high accuracy over the last decade, both through the 2-point correlation function (e.g. Zehavi et al., 2004; Maller et al., 2005; Hawkins et al., 2003) and its Fourier transform, the power spectrum (e.g. Cole et al., 2005; Frith et al., 2005b). For a perfectly Gaussian density field, the 2-point statistic forms a complete description of the galaxy distribution as all higher order connected moments are zero.
Assuming a Gaussian form for the primordial distribution of density fluctuations, perturbation theory predicts non-zero higher order correlation functions of the local galaxy density field; as the initial inhomogeneities grow gravitationally, the density distribution becomes asymmetric, developing non-zero skewness and kurtosis etc. However, it is possible to construct models of inflation, and also models which contain non-linear structures in the primordial density field, such that the initial conditions themselves are non-Gaussian (e.g. Silk & Juszkiewicz, 1991; Weinberg & Cole, 1992). Therefore, if non-zero high-order moments of the local galaxy density field are detected, these arise either via the gravitational collapse of initially Gaussian density fluctuations or from some degree of primordial non-Gaussianity.
Examining the high-order correlation functions of the local galaxy distribution therefore represents a particularly powerful approach to understanding the nature of the primordial density field. It is now well established that under the assumption of Gaussian initial conditions, these high-order moments are expected to display a hierarchical scaling such that the p-order cumulants of the local density field can be expressed in terms of the variance of the distribution, such that (e.g. Peebles, 1980; Fry, 1984; Bouchet et al., 1992; Bernardeau, 1992, 1994a; Gaztañaga & Baugh, 1995; Baugh et al., 2004).
These coefficients, which quantify the departure from Gaussian behaviour, are insensitive to cosmic epoch or assumed cosmology at scales where the growth of the density field is linear or quasi-linear. Departures from the hierarchical scaling of the high-order galaxy correlation functions on these scales might be expected only in the case of strongly non-Gaussian initial conditions or some form of scale-dependency at large scales in the bias between the galaxy distribution and the underlying mass distribution.
Several surveys have made a significant contribution to our understanding of this issue. It has long been known that high-order correlation functions are non-zero on small scales (e.g. Groth & Peebles, 1977; Saunders et al., 1991; Bouchet et al., 1993; Gaztañaga, 1994; Szapudi et al., 2000; Hoyle et al., 2000). More recently, Croton et al. (2004) used volume-limited catalogues drawn from the 2dF Galaxy Redshift Survey (2dFGRS) to constrain in redshift space (for 5) to 10Mpc. For 4Mpc the hierarchical scaling parameters, , were found to be approximately constant. However, at larger values of these coefficients increased with scale for some luminosities, consistent with some models of structure formation with strongly non-Gaussian initial density fields (Gaztañaga & Mahonen, 1996; Gaztañaga & Fosalba, 1998; White, 1999; Bernardeau et al., 2002). However, the results were complicated by the presence of two massive superclusters which, when removed from the analysis (corresponding to a reduction in the volume of 2 per cent), now resulted in constant scaling parameters on all scales to 10Mpc, consistent with Gaussian initial conditions. It appears therefore that the 2dFGRS does not probe a large enough volume to constitute a fair sample of the local galaxy distribution for high-order correlation functions.
The form of the scaling parameters on larger scales are also poorly constrained. Previously, Gaztañaga (1994) used the APM galaxy survey to to constrain high-order (9) angular correlation functions and the associated angular scaling parameters, , to 7∘ (corresponding to 30Mpc). Despite the fact that the APM galaxy survey covers a 4 larger solid angle than the 2dFGRS, a similar increase in on large scales was found as seen for observed in the 2dFGRS. At higher orders, further departures from the expected hierarchical scaling were also observed, although the scales probed were limited to 3∘ and the statistics became increasingly uncertain. These features have also been measured in the smaller Edinburgh-Durham Galaxy Catalogue (Szapudi & Gaztañaga, 1998). Of course, the increase in at large scales detected by Gaztañaga (1994) may also be due to the same massive supercluster observed in the Southern 2dFGRS field, as the 2dFGRS is drawn from the larger APM galaxy sample. However, it would be surprising if the volume probed by the APM galaxy survey still did not constitute a fair sample of the Universe.
High-order correlation functions and the amplitude of the associated scaling parameters also provide us with a powerful probe of the way in which galaxies trace the underlying mass distribution. Recent measurements of the linear bias, that is the bias associated with the variance of the density field such that , indicate that in the near infra-red 1 (e.g. Frith et al., 2005b) whereas for optically-selected galaxies 1 (e.g. Verde et al., 2002; Gaztañaga et al., 2005). Whether there exist non-linear contributions to the galaxy bias, such that the bias is a function of the density field, can be examined using high-order moments of the galaxy density field (e.g. Fry & Gaztañaga, 1993).
Previous high-order clustering analyses have universally found that the observed skewness etc. are significantly lower than the expected values in a CDM cosmology. This discrepancy has been interpreted as evidence for a negative, non-linear contribution to the galaxy bias. Most recently, Gaztañaga et al. (2005) used volume-limited samples of the 2dFGRS to determine the redshift space 3-point correlation function and constrained -band bias parameters to and a non-linear, quadratic bias of , although as with previous 2dFGRS analyses these results are significantly affected by the presence of two massive superclusters. Independently, Pan & Szapudi (2005) determined the monopole contribution to the 2dFGRS 3-point correlation function and determined a similar -band linear bias to Gaztañaga et al. (2005) and a negative parameter as well, although considerably smaller and at a reduced significance to the other 2dFGRS constraint. Computing the bispectrum for the PSCz catalogue (which is selected from the 60m IRAS galaxy sample), Feldman et al. (2001) also constrain infra-red bias parameters of and .
The 2 Micron All Sky Survey (2MASS) has recently been completed and provides , and -band photometry for 1.6106 extended sources over the entire sky to 13.5. 2MASS is the largest existing all-sky galaxy survey and therefore represents a uniquely powerful probe of the local galaxy density field at large scales; the solid angle of the 2MASS 10∘ sample used in this paper represents an order of magnitude increase over the APM galaxy survey, meaning that clustering statistics determined from the 2MASS galaxy sample will suffer less from projection effects while probing a comparable volume. The 2MASS survey also represents an order of magnitude increase in volume over the largest volume-limited 2dFGRS sample; it is therefore possible to probe much larger scales than the 2dFGRS although with the added complication of projection effects. A further advantage of 2MASS over previous datasets is that the photometry is extremely accurate with high completeness for 10∘; correcting for the variable completeness over the 2dFGRS survey area for instance, complicates the analysis and increases the uncertainty from possible systematic effects. The main drawback to high-order clustering analysis of the 2MASS data (as with the APM galaxy survey) is the lack of availiable three-dimensional information; the clustering signal from a particular scale in real space is smeared over a range of angular scales. For this reason detailed features in the real space correlation function, such as the shoulder at 10Mpc (Baugh, 1996; Hawkins et al., 2003; Zehavi et al., 2004), may not be detected by the 2MASS projected correlation function.
In this work, we aim to determine the high-order angular correlation functions and the associated scaling parameters of the local galaxy density field to high precision and large scales, using the final 2MASS extended source catalogue. In section 2, the details of the method for estimating high-order correlation functions are given. The galaxy sample used and the error analysis are described in section 3. We present the -point angular correlation functions (for 9) and the hierarchical scaling relations in section 4. We also examine possible systematic effects arising from extreme fluctuations in the observed galaxy density field. The implications for the form of primordial density fluctuations and non-linear galaxy bias are discussed in section 5. The conclusions follow in section 6.
2 Method of Estimation
2.1 The p-point correlation function
The p-point galaxy correlation function estimates the joint probability that p galaxies are separated by a certain scale and can be defined through considering fluctuations in the galaxy density field. The connected or reduced part of this statistic corresponds to the contribution to this probability which does not include any conditional probability on lower orders:
| (1) |
where denotes the density fluctuation; for 3, the unreduced and reduced correlation functions are the same. In this paper, we work with the reduced p-point correlation function only.
The 2-point angular galaxy correlation function, , is given in terms of the probability of finding two galaxies in area elements and separated by angle :
| (2) |
where is the mean number of galaxies per unit solid angle (e.g. Groth & Peebles, 1977; Peebles, 1980). Similarly, the 3-point function, , is defined by the joint probability of finding galaxies in each of three area elements:
| (3) |
The first terms in equations 2 and 3 correspond to the contributions from galaxy pairs or triplets respectively which are accidentally seen as close together in projection but are at very different radial distances. Similarly, the following three terms in equation 3 account for the contribution from one correlated pair and a third uncorrelated galaxy which forms a triplet by chance line-of-sight clustering. This leaves the final term which defines the contribution from the real clustering of triplets.
A simple way in which to estimate the high-order correlation functions is through the area-averaged correlation function, , defined as:
| (4) |
where is the solid angle of the cone defined by its angular radius . The area-averaged correlation function, , is estimated by considering the central moments of the angular counts:
| (5) |
where denotes the count probability distribution function and is calculated by placing circular cells of angular radius over the survey area and determing the number of cells containing exactly N galaxies:
| (6) |
where NN and NC denote the number of cells containing N galaxies and the total number of cells respectively. in equation 5 is the mean number of galaxies in a cell of angular radius and may be determined directly from the count probability distribution function:
| (7) |
The moments of the count probability distribution function determined via equation 5 yield the unreduced correlation function through the relation . In order to obtain the reduced correlation function, the connected moments are determined:
| (8) |
(see Gaztañaga (1994) for higher order relations). In addition we apply a shot noise correction (Gaztañaga, 1994; Baugh et al., 1995) such that:
| (9) |
The area-averaged, reduced angular correlation function is then determined from the relation .
2.2 Hierarchical scaling
In perturbation theory, the density field, evolved by gravity from an initially Gaussian distribution, leads to a hierarchical clustering pattern, such that all high-order correlations can be expressed in terms of the 2-point correlation function:
| (10) |
where is the volume-averaged p-point dark matter correlation function. Importantly, this relation is preserved for the galaxy density field such that (Fry & Gaztañaga, 1993). The relation between the dark matter and galaxy density fields may be expressed through a Taylor expansion of the dark matter density contrast:
| (11) |
For the skewness, it can be shown that (Fry & Gaztañaga, 1993):
| (12) |
where is the linear bias such that on scales where the variance of the density field is small, and quantifies the second-order contribution to the galaxy bias.
Using perturbation theory, it is possible to determine precise quantitative predictions for the parameters. Assuming a power law form for the three-dimensional power spectrum of density fluctuations, , and a top-hat window function, the skewness of the matter distribution, may be determined (Juszkiewicz et al., 1993):
| (13) |
We later use these expressions to determine constraints on non-linear bias through comparisons with in the linear and quasi-linear regimes. We assume a power spectrum slope of =-2 (Percival et al., 2001; Cole et al., 2005). The uncertainties on are small (0.1) compared to the sampling errors in the measurement of ; we therefore assume the concordance value cited above to generate predictions for and neglect small uncertainties in this parameter.
2.3 Transformation to three dimensions
For a projected galaxy distribution, a hierarchical scaling relation may also be defined in terms of the area-averaged p-point galaxy correlation functions and angular scaling coefficients, :
| (14) |
We wish to transform these angular scaling parameters, , to the three-dimensional coefficients, , in order to make comparisons with perturbation theory and constrain non-linear galaxy bias. Following the method of Gaztañaga (1994), we transform to three dimensions via the relation:
| (15) |
where is the mean scale probed at an angular scale for a survey of median depth , is the slope of the 2-point real space correlation function, and and are related to the number of different configurations of the three-dimensional and angular hierarchical tree graphs respectively (Gaztañaga, 1994). Here we use the form of the real space correlation function determined from the 2dFGRS (Hawkins et al., 2003). The factor is related to the selection function :
| (16) |
where
| (17) |
where describes the evolution of clustering with redshift (Groth & Peebles, 1977) and is taken to be =0 in good agreement with recent observational and theoretical considerations (Hamilton et al., 1991; Peacock & Dodds, 1994; Carlberg et al., 2000; Wilson, 2003). Here, denotes the comoving distance and a correction for curvature such that . In this work we use the concordance value of =0.3. For the selection function we use a parameterised form for the such that:
| (18) |
(Baugh & Efstathiou, 1993; Maller et al., 2005) where is determined from the 2MASS-2dFGRS matched sample described in Frith et al. (2005a). For reference =0.074 for 13.5. In this case, the normalisation of the selection function factors out (see equations 16 and 17).
The transformation described in equation 15 is robust to reasonable changes in the selection function and choice of cosmological parameters (Gaztañaga, 1994). However, this relation becomes uncertain on large angular scales, 2∘ (Gaztañaga, 1994), due to the fact that the power law form to the 2-point correlation function and the value of are not well constrained on large scales.
3 Analysis of the 2MASS data
3.1 The 2MASS Extended Source Catalogue
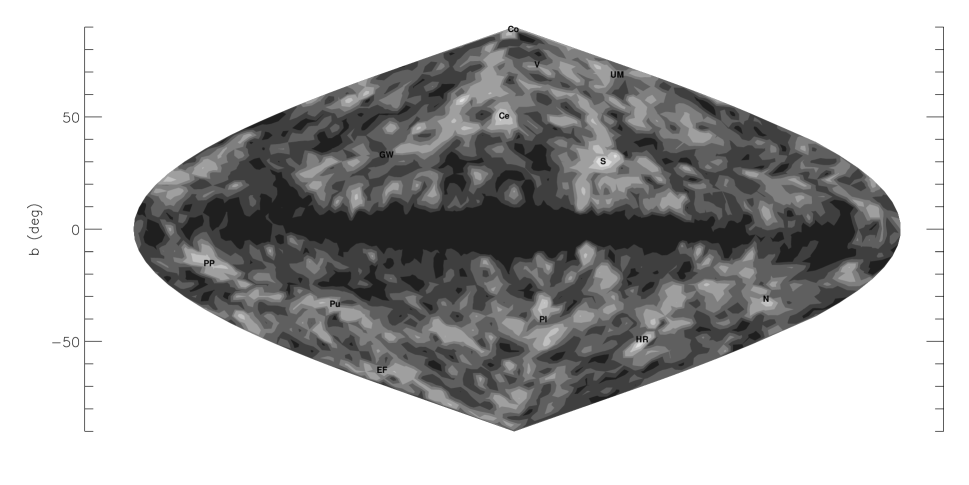
We select objects from the 2MASS final release extended source catalogue (Jarrett, 2004) above a galactic latitude of in order to remove regions of high extinction and stellar contamination (see Fig. 5) and below an extinction-corrected magnitude limit of =13.5 using the dust maps of Schlegel et al. (1998). The 2MASS dataset removes or flags sources identified as artefacts such as diffraction spikes and meteor streaks (Jarrett et al., 2000); we use the 2MASS to remove such objects. We also employ a colour cut (0.7 and 1.4) below =12 in order to remove a small number of objects identified as non-extragalactic extended sources (Maller et al., 2003, 2005). The subsequent sample of 650 745 galaxies probes to a median depth of 220Mpc and covers 83 per cent of the entire sky (34 000 deg2).
We estimate the total -band flux using the magnitude estimator described in Frith et al. (2005a, b), based on the method of Cole et al. (2001). To recap, we use the deeper and more accurate 2MASS -band extrapolated magnitudes and colour-correct to the -band using the and -band fiducial elliptical Kron magnitudes; this provides excellent agreement with the independent -band photometry of Loveday (2000) and also the 2MASS-selected 6dF Galaxy Survey total magnitude estimator (Jones et al., 2004).
In order to calculate the high-order correlation functions of this 2MASS sample, we determine the count probability distribution function detailed in equation 6 by randomly placing =106 cell centres over the survey area. Each cell is then allowed to grow and the number of galaxies as a function of the angular radius is recorded. The size of the cells is limited by the galactic latitude limit of in the 2MASS sample. We replace cells which are lost as they encroach the boundary of the galaxy sample such that =106, independent of the angular scale probed. We use cell radii in the range 0∘.01 to 25∘.1, equivalent to a range in the mean scale probed of 0.04Mpc to 104Mpc.
3.2 Error estimation
The statistical uncertainty associated with the correlation function and angular scaling parameters in this work are determined using bootstrap estimates. The full 2MASS sample is split into 20 equal area regions of 1700 deg2; 20 of these sub-areas are selected at random (with repeats) and the associated clustering statistic is determined. We repeat this 1000 times and determine the standard deviation; these are indicated by the errorbars in Figs. 1 and 2. The size of these errors is not significantly altered if we vary the number of realisations or sub-areas within reasonable limits.
Once we have determined the angular correlation functions and scaling parameters and the associated errors in this way, we wish to carry out comparisons with predictions from perturbation theory. Since correlation function estimates determined at different cell radii are highly correlated being integral quantities, it is necessary to account for the covariance between each datapoint when performing fits to the data. We determine the covariance matrix () using the bootstrap method above. We then determine :
| (19) |
where for example. We compute the inverse covariance matrix, , using the Numerical Recipes Singular Value Decomposition algorithm. As noted by Croton et al. (2004), previous constraints on the high-order scaling parameters (except for the 2dFGRS results) ignored the correlations between different bins leading to unrealistically small errors in the fitted values.

First column: Area-averaged correlation functions for 650 745 13.5 2MASS galaxies. In the panel, the best fit result at small scales from Maller et al. (2005) is indicated by the dotted line.
Second column: The angular scaling parameters () determined via equation 14 for the full sample.
Third column: The real space scaling parameters () determined via equation 15 for the full sample.
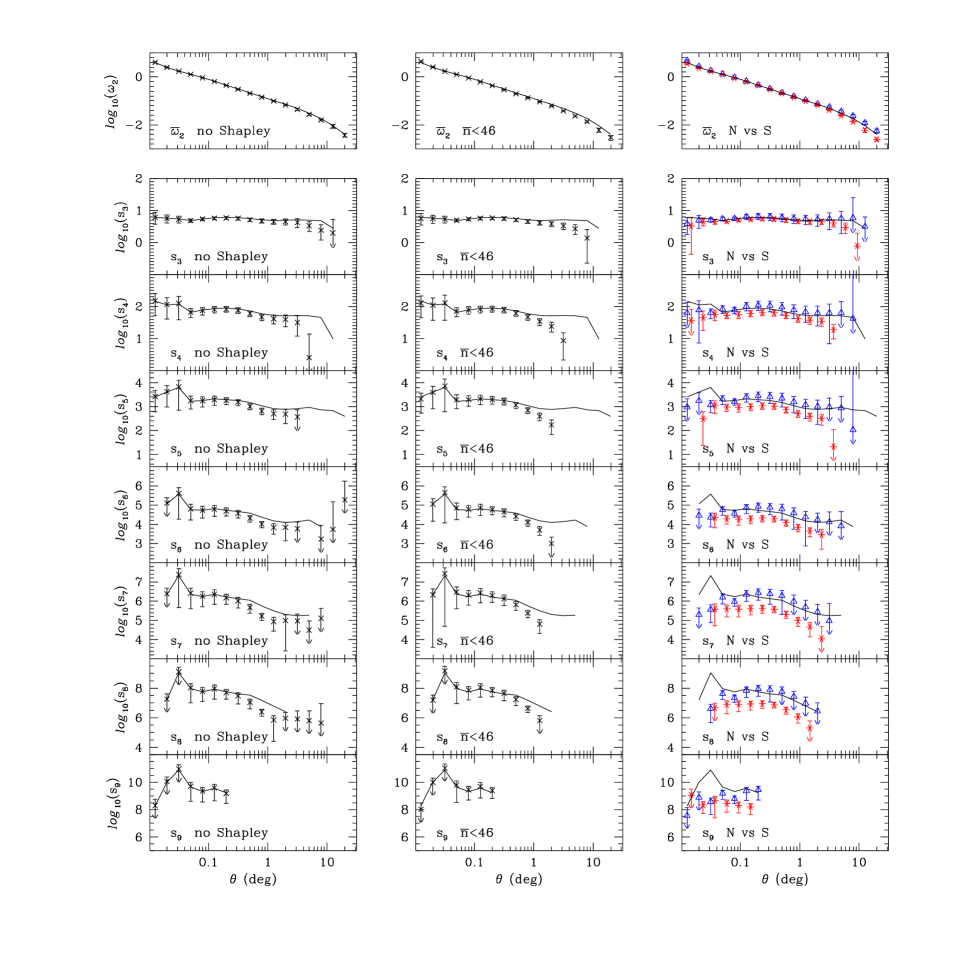
First column: We show the 2-point function and the higher-order angular scaling parameters having removed a region of radius 6∘ centred on the largest over-density in the sample, the Shapley supercluster (see section 4.2). This corresponds to a removal of 1.1 per cent of the galaxies and 0.33 per cent of the solid angle of the full sample.
Second column: We apply a more stringent cut such that areas of radius 6∘ centred on the ten most over-dense pixels in Fig. 5 are removed (see table 3) corresponding to a removal of 6.3 per cent of the galaxies and 2.6 per cent of the solid angle of the full sample.
Third column: Here, we split the full sample into north (triangles) and south (stars). For clarity, we have displaced the southern angular scaling parameter datapoints to the right.
4 Results
4.1 Area-averaged correlation functions
In the first column of Fig. 1 we plot the area-averaged correlation functions for 9 determined for the full 10∘ 2MASS galaxy sample described in section 3.1. In each case the errors are determined via the bootstrap technique described in section 3.2. For reference we compare our result for with the best fit to the 2MASS 13.5 2-point correlation function of Maller et al. (2005) (=0.100.01, 1-=-0.790.02, determined on scales of 2 where ).
The -point correlation functions are consistent with power laws over several orders of magnitude in angular scale. In particular, we note that the area-averaged determined in this work is in good agreement with the directly-determined result of Maller et al. (2005) at small scales (we find , 1-=-0.770.04 for 2). This agreement is robust to changes in the magnitude estimator and galactic latitude cut; Maller et al. (2005) use the -band elliptical Kron magnitude estimator and a cut.
| 3 | 5.28 0.45 | 4.29 0.39 |
| 4 | 57.7 9.2 | 36.0 5.7 |
| 5 | 1510 507 | 678 228 |
| 6 | (3.68 2.08)104 | (1.20 0.68)104 |
| 7 | (9.74 8.72)105 | (2.25 2.01)105 |
| 8 | (2.64 3.69)107 | (4.19 5.86)106 |
| 9 | (2.03 1.56)109 | (2.26 1.74)108 |
| 3 | 4.91 0.60 | 4.00 0.49 |
| 4 | 54.2 11.1 | 33.8 6.9 |
| 5 | 740 240 | 332 108 |
| 6 | (1.01 0.67)104 | (3.30 2.19)103 |
In order to determine whether these results are consistent with the hierarchical scaling described in section 2.2 we compute the angular scaling parameters, (see equation 14); these are shown in the second column of Fig. 1. The angular scaling parameters are transformed into the real space parameters in the third column of Fig. 1 (see equation 15). The and coefficients are consistent with constant values to large scales ( 20∘, 100Mpc), although there may be a decrease in amplitude between the non-linear and quasi-linear regime (1∘, 4Mpc). One caveat to this is that while these coefficients are consistent with a slope of zero, the constraints become increasingly weak at higher orders such that in the range 110∘ the slopes are constrained to , , and at 1 confidence (where , marginalising over the normalisation); we investigate the constraint on the slope of and the level to which this can reject primordial non-Gaussianity in section 5.1.
Since we probe well into the linear and quasi-linear regimes we are able to make comparisons with predictions from perturbation theory. We perform fits to these scaling parameters considering the covariance in the datapoints (see equation 19). We consider small and large scales separately due to the fact that, despite the consistency of the scaling parameters over all scales considered, perturbation theory is not expected to be valid on small scales (Bernardeau et al., 2002); approximately, the scales used represent fits in the non-linear and quasi-linear or linear regimes. Also, it is important to remember that the conversion from angular to real space scaling parameters becomes increasingly uncertain at large angular scales (2∘). The best fit scaling parameters are shown in Table 1 for small scales and Table 2 for large scales.
| (∘) | (∘) | (deg-2) | Cluster | |
|---|---|---|---|---|
| 1 | 312.2 | 30.0 | 69.1 | Shapley supercluster |
| 2 | 266.5 | -51.3 | 54.4 | Horologium-Reticulum |
| 3 | 45.0 | 57.4 | 52.4 | Centaurus |
| 4 | 10.4 | 51.3 | 52.2 | Centaurus |
| 5 | 303.8 | 32.8 | 49.4 | Shapley supercluster |
| 6 | 266.8 | -48.1 | 47.5 | Horologium-Reticulum |
| 7 | 219.4 | -32.8 | 47.5 | NGC 1600 Group |
| 8 | 343.1 | -32.8 | 46.8 | Pavo-Indus wall |
| 9 | 312.2 | 35.7 | 46.2 | Shapley supercluster |
| 10 | 9.6 | 48.1 | 46.1 | Centaurus |
4.2 Fair sample issues
It was noted in section 1, that a considerable problem in previous high-order clustering analyses is the presence of extreme fluctuations in the galaxy samples which have a significant effect on the observed scaling parameters. The APM and 2dF Galaxy Redshift Surveys observe rising values for 4Mpc for example, consistent with some models of structure formation with strongly non-Gaussian inital consitions (Gaztañaga & Fosalba, 1998; Gaztañaga & Mahonen, 1996; Bernardeau et al., 2002); with the 2dFGRS at least the clustering signal is significantly altered when two superclusters are removed from the sample (corresponding to a reduction in the volume of 2 per cent) yielding constant parameters for to scales of 10Mpc (Baugh et al., 2004; Croton et al., 2004).
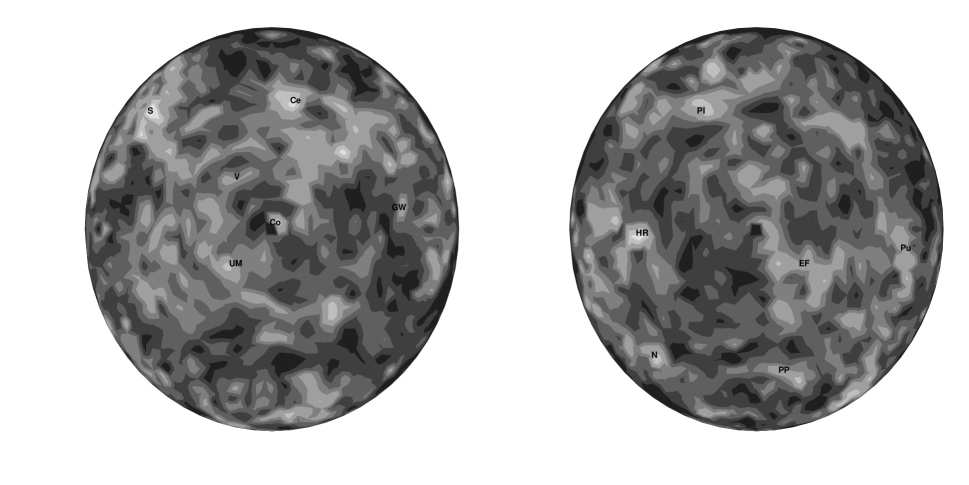
We therefore wish to examine the level of such systematic effects by removing large over-densities from the 2MASS galaxy sample and examining the effect on the observed scaling parameters. In Fig. 5, we show the pixelated 2MASS 13.5 galaxy density distribution smoothed on 7∘ scales (each pixel has a solid angle of 13.5 deg2); clusters are indicated by lighter filled contours and regions of under-density by darker shades. In the upper panel we show the entire 13.5 2MASS sample in Aitoff projection; in the lower panels the galaxy density field for each galactic hemisphere is plotted in projection separately. We also list the ten most over-dense pixels (corresponding to a limit in the number density of 46 deg-2) in table 3.
In Fig. 2, we plot and the high-order angular scaling parameters with various cuts to the full galaxy sample used in Fig. 1. In each case, the corresponding result for the full sample is indicated by a solid line. First, we omit the largest supercluster only; in the first column, we have removed a circular region with an angular radius of 6∘ centred on the most over-dense pixel in Fig. 5 sampling the Shapley supercluster. This corresponds to a removal of 1.1 per cent of the galaxies and 0.33 per cent of the solid angle of the full 10∘ sample. The effect of this removal on the 2-point correlation function is insignificant. The form of remains consistent with the result for the full sample, although the best fit slope at large scales (110∘) changes to (compared to for the full sample). At higher orders, there is also no significant effect although the statistical uncertainty increases at large scales (datapoints with extremely large errorbars are omitted for clarity).
In the second column in Fig. 2 we omit all galaxies within 6∘ of the ten most over-dense pixel centres (see table 3). This corresponds to a removal of 6.3 per cent of the galaxies and 2.6 per cent of the solid angle of the full sample. There is a small effect on the 2-point correlation function at large scales ( 10∘). The effect on the higher order angular scaling parameters also becomes more significant. However the effect on at least is limited; the best fit slope at large scales (110∘) is .
It has previously been observed that the form of the galaxy distribution in the northern and southern galactic caps are significantly different in many respects; Maller et al. (2005) detected a difference in the 20∘ and -20∘ 2MASS 2-point angular correlation functions at large scales for example. It has also recently been suggested that the southern galactic cap may contain a large local under-density in the galaxy distribution covering 4000 deg2 around the Southern Galactic Pole to 300Mpc, which may be at odds with the form of the CDM at large scales (Frith et al., 2005a, 2004, 2003; Busswell et al., 2004). It is therefore interesting to compare the form of high-order clustering statistics in the galactic caps.
We plot the 2-point angular correlation functions and high-order scaling parameters for 10∘ and -10∘ 13.5 2MASS galaxies in the third column of Fig. 2. We observe a similar discrepancy in the 2-point function as determined previously by Maller et al. (2005) with a steeper slope in the southern at large scales. However, the high-order scaling parameters in the northern and southern local galaxy distributions, for 4 at least, are consistent with each other and constant values over 3 orders of magnitude of angular scales to 20∘. At higher orders there are differences between the two which increase with . Whether these differences are due to real north-south differences in the local galaxy distribution, or simply due to other systematic effects is unclear.
5 Discussion
In the previous section, high-order angular and real space hierarchical scaling parameters were determined to extremely large scales ( 40Mpc) from a sample of 650 745 13.5 2MASS galaxies. Unlike previous high-order clustering analyses, the scaling relations for 4 are relatively robust even when the most prominent clusters are removed from the sample.
As described in sections 1 and 2, high-order clustering statistics have significant implications for the nature of the primordial density distribution and also the way in which galaxies trace the underlying mass distribution. In the following section we examine the consistency of our results with Gaussian initial conditions and hierarchical clustering and discuss the implications for non-Gaussian models of the primordial density distribution. Assuming the former, we also infer constraints on non-linear galaxy bias.
5.1 Implications for the primordial density field
5.1.1 Consistency with Gaussian initial conditions
The nature of the primordial distribution of density fluctuations is predicted to be close to or exactly Gaussian in standard inflationary models (Falk et al., 1993; Gangui et al., 1994; Lesgourgues, 1997; Wang & Kamionkowski, 2000; Maldacena, 2002; Acquaviva et al., 2003). This occurs as a consequence of the slow-roll conditions on the inflation potential which require the potential energy of the field to dominate over the kinetic energy in order to produce a phase of accelerated expansion which lasts for a sufficiently long period of time. Deviations from Gaussianity under these assumptions depend on the inflationary model but are generally extremely small; in recent power spectrum analyses for example it is assumed that the primordial density field has exactly random phases (e.g. Cole et al., 2005; Frith et al., 2005b).
Under the assumption of Gaussian initial conditions, a hierarchical scaling (see equation 10) of the high-order moments of the dark matter and galaxy density fields (Fry & Gaztañaga, 1993) is expected through the evolution under gravitational instability of the primordial density fluctuations (e.g. Peebles, 1980; Fry, 1984; Bouchet et al., 1992; Bernardeau, 1992, 1994a; Gaztañaga & Baugh, 1995; Baugh et al., 2004). This holds on scales where the gravitational collapse of dark matter haloes evolves linearly; it is important therefore to examine high-order moments in the linear and quasi-linear regime.
It is clear from Fig. 1 that our results provide an excellent agreement with the expected scaling relations at large scales, with and parameters consistent with constant values over several orders of magnitude in scale for 7. As noted previously by the 2dFGRS (Baugh et al., 2004), this hierarchical scaling extends to smaller scales than expected by perturbation theory predictions (Bernardeau et al., 2002). This consistency with Gaussian initial conditions is also apparent from Tables 1 and 2 where we perform fits to the scaling parameters to unprecedented scales; there is good agreement between the small and large scale fits (although there is a small correlation between the two). Alternatively, we can examine the measured slope of the parameter at the scales of interest; in Fig. 3 we determine confidence limits for the slope and amplitude of the parameter at large scales (4.040Mpc) as shown in Fig. 1. The constraints provide excellent agreement with the expected constant value as a function of scale, with a best fit slope of (where , marginalising over the normalisation).
This consistency with hierarchical scaling represents a departure from recent constraints on high-order correlation functions. The APM (Gaztañaga, 1994) and Edinburgh-Durham Southern Galaxy Catalogue (Szapudi & Gaztañaga, 1998) surveys observe significant upturns in the angular skewness at scales of 1∘ (corresponding to 4Mpc). Also, analysis of the 2dFGRS (Croton et al., 2004; Baugh et al., 2004) indicates rising parameters. The issue is complicated by the fact that these measurements are not independent as there is significant overlap between the observed survey fields. Coupled with this, the 2dFGRS identify two superclusters which significantly alter their results; when removed there is good agreement with the expected hierarchical scaling. However, due to the survey volume the scaling parameters are determined only below 10Mpc and do not probe the larger scales of interest here.
5.1.2 Constraints on non-Gaussianity
While the assumption of Gaussian initial conditions is acceptable assuming the validity of the simplest inflationary models, there also exist alternative models of inflation in which deviations from a Gaussian form for the primordial density field are predicted. For example, it is possible to introduce non-Gaussianity if the scalar field driving inflation has more than one component (e.g. Kofman & Pogosyan, 1988; Bernardeau & Uzan, 2003); strongly non-Gaussian initial conditions are also a feature of models in which the inflaton is not a slowly rolling scalar field but a fast moving ghost condensate (Arkani-Hamed et al., 2004). Additionally, it is possible to construct models in which the initial conditions are non-Gaussian as a result of non-linear structures, such as cosmic strings or global textures, within the primordial density field (e.g. Gaztañaga & Mahonen, 1996; Avelino et al., 1998; Gaztañaga & Fosalba, 1998).
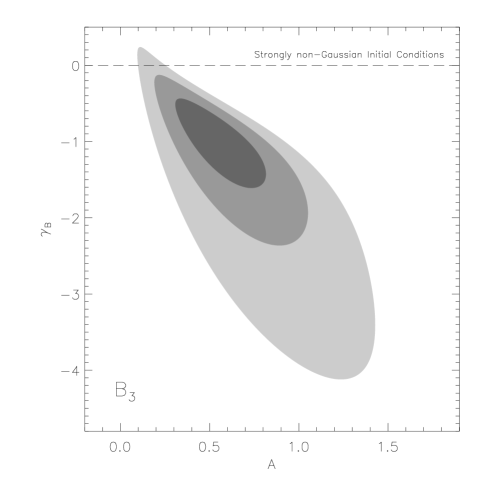
When considering the effect of non-Gaussian initial conditions on moments of the local galaxy density field, it is convenient to consider the departure from primordial Gaussianity in two ways. Here, we consider the strongly non-Gaussian regime as might arise from cosmic strings or textures; weak departures from Gaussianity as might arise from the various models of inflation described above are more difficult to constrain since the effect can be a shift in the and parameter amplitudes rather than a change in slope. In the case of strong departures from Gaussian initial conditions, the scaling of high-order moments of the density field is expected:
| (20) |
where for non-Gaussian models seeded by topological defects the scaling parameters (not to be confused with used in equation 15) are expected to be constant at large scales and of order unity (Turok & Spergel, 1991; Gaztañaga & Mahonen, 1996; Bernardeau et al., 2002). Equivalently, the typical signature of strong non-Gaussianity in the scaling parameters is a slope of 0.6 (where ) at large scales, with a characteristic minimum at 10Mpc (Gaztañaga & Mahonen, 1996).
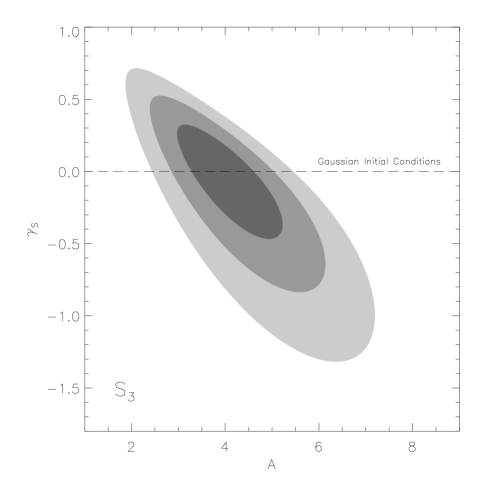
In Fig. 4 we constrain the slope and amplitude of the parameter through fits to the 2MASS results (measuring the projected and using the transformation to real space described in equation 15) at large scales (4.040Mpc). We are able to reject the scaling expected in strongly non-Gaussian models (i.e. constant parameters, =0) as described in equation 20, and therefore non-Gaussian models seeded by topological defects, at the 2.5 confidence level.
5.2 Non-linear galaxy bias
High-order clustering analysis also represents a powerful probe of the way in which galaxies trace the underlying mass distribution. We have previously noted that the galaxy bias associated with the variance of the density field has been constrained to in the -band at the level (Frith et al., 2005b) and for optically-selected galaxies. It is unclear whether deviations from the linear bias model exist, and if they do, how this coincides with current theories of galaxy evolution.
Assuming Gaussian initial conditions, we use predictions from perturbation theory for the dark matter skewness and the relationship between the dark matter and galaxy skewness (equations 12 and 13) to compute the -band non-linear bias coefficient implied by our results. We use an =-2 power spectrum slope (Percival et al., 2001; Cole et al., 2005) and a -band linear bias of =1.390.12 measured from the 13.5 2MASS galaxy angular power spectrum (Frith et al., 2005b). Since these predictions from perturbation theory are valid only in the quasi-linear and linear regimes (Bernardeau, 1994b), we use only the fits on large scales. First, we use the best fit galaxy skewness in the range 4.040Mpc (see Table 2); we find that c2=0.570.41. Since the conversion from to becomes increasingly uncertain at scales of (Gaztañaga, 1994), we also use a narrower range of 4.010Mpc (equivalent to 1.5). Using the best fit galaxy skewness in this range of =4.010.34, we find that .
We therefore detect a positive quadratic contribution to the -band galaxy bias at the level. This means that the density of 2MASS galaxies rises more quickly than the mass density contrast. This differs from all previous constraints on the non-linear bias parameter which have been negative, most recently with constraints from the 2dFGRS which limit and in the optical -band (Gaztañaga et al., 2005), and also from the IRAS PSCz catalogue of and in the infra-red (Feldman et al., 2001). This compares to near infra-red -band constraints of (Frith et al., 2005b) and the optimal constraint in this work of .
It is possible to understand these results by examining the analytic predictions of Mo et al. (1997) for the high-order bias coefficients, formed via the Press & Schechter (1974) formalism and an initially Gaussian density field. From this the first two terms in the Taylor expansion of equation 11 are predicted to be:
| (21) |
| (22) |
where , denotes the linear rms fluctuation on the mass scale of a dark matter halo of mass and is the linear theory over-density at the time of collapse (for reference =1.686 for =1).
This relatively simplistic scenario is not able to provide accurate quantitative predictions which match the observational results above. However, by considering haloes of differing mass it is possible, qualitatively at least, to understand these apparently contradictory constraints on . For instance, if we consider the most massive haloes for which 3, Mo et al. (1997) predict 1 and 0. In contrast, for typical mass haloes for which 1, bias parameters of 1 and 0 might be expected. With this in mind, it is possible to understand why a near infra-red survey, which is more sensitive to early-type galaxies than optical or infra-red surveys (e.g. Jarrett, 2004; Croton et al., 2005; Oliver et al., 1996, respectively), produces galaxy samples with higher values for the linear and quadratic bias parameters.
6 Conclusions
We have measured reduced angular correlation functions, , to ninth order using 650 745 galaxies selected from the 2MASS extended source catalogue. From our estimates for the angular correlation functions, we have determined the projected and real space hierarchical scaling parameters, and respectively. The prime motivation for such analysis is to test the hierarchical scaling hypothesis which predicts these parameters to be constant in the linear and quasi-linear regimes (e.g. Peebles, 1980; Fry, 1984; Bouchet et al., 1992; Bernardeau, 1992). As such we are able to probe the primordial density field and constrain various models of inflation and structure formation. High-order clustering analysis also allows us to probe the way in which galaxies trace the underlying mass distribution; a negative offset between CDM predictions and observations by the 2dFGRS have recently been interpreted as evidence for a quadratic contribution to the galaxy bias, although these conclusions are based on constraints in the weakly non-linear regime (Gaztañaga et al., 2005).
The most comparable recent work are the analyses of the 2dFGRS (Croton et al., 2004; Baugh et al., 2004) and APM surveys (Gaztañaga, 1994); the galaxy sample used in this work represents an order of magnitude increase in volume and solid angle over each respectively. Previous analyses of high-order clustering statistics have proved extremely challenging; due to the relatively small volumes probed in 3-dimensional analyses for instance, the results have been sensitive to the presence of clusters and superclusters within the galaxy sample. Not only this, but direct comparisons with perturbation theory have also proved difficult since the statistical uncertainty at large scales is considerable, and frequently the covariance in the statistics has been ignored leading to unrealistically small errors. In addition, the results for the hierarchical scaling parameters have consistently displayed a puzzling upturn in values at 4Mpc, consistent with some models of structure formation with strongly non-Gaussian initial conditions (Gaztañaga & Mahonen, 1996; Gaztañaga & Fosalba, 1998; White, 1999; Bernardeau et al., 2002).
Here, we are able to determine the scaling parameters to high accuracy to unprecedented scales, 100Mpc. We also carry out a full covariance analysis in order to take account of correlations in the datapoints at different cell radii. We are therefore in a position to make direct comparisons with the predictions of perturbation theory since we probe well into the quasi-linear and linear regimes and we have a good understanding of the statistical uncertainty. However, since we are working with a projected galaxy sample, we have to convert the associated angular scaling parameters to real space via a transformation which becomes increasingly uncertain on large scales (2∘). Nevertheless, this work currently provides the best estimates of high-order clustering statistics at large scales. We are able to reach a number of conclusions:
(i) Our results are in line with the expected hierarchical scaling relation, with and parameters consistent with constant values over 3 orders of magnitude in scale to 40Mpc for 7; we constrain the slope of to (where ). Such a scaling pattern is expected if an initially Gaussian density field evolves under the action of gravitational instability (e.g. Peebles, 1980; Fry, 1984; Bouchet et al., 1992; Bernardeau, 1992). This result is in contrast to recent results drawn from the 2dFGRS, APM and EDSGC surveys (Gaztañaga, 1994; Szapudi & Gaztañaga, 1998; Baugh et al., 2004; Croton et al., 2004) which display rising scaling parameters at large scales.
(ii) The scaling parameters are relatively robust to the removal of the largest over-density, the Shapley supercluster, although the best fit slope of at large scales (110∘) becomes steeper, yet is still consistent with a constant value (). We also use a more stringent cut by removing the ten most over-dense regions (see Fig. 5 and Table 3) corresponding to a cut to the main sample of 6.3 per cent of the galaxies and 2.6 per cent of the total solid angle; the resulting parameter remains broadly consistent with the result for the main sample, although with a slightly steeper best fit slope at large scales ().
(iii) Since strong non-Gaussianity in the primordial density field, as might be expected in models seeded by topological defects such as cosmic strings or global textures (Avelino et al., 1998; Gaztañaga & Fosalba, 1998; Gaztañaga & Mahonen, 1996), results in a strong upturn in the hierarchical scaling parameters at large scales (e.g. Bernardeau et al., 2002), we are able to reject strongly non-Gaussian initial conditions, producing relations of the form , at the 2.5 confidence level.
(iv) We compare our constraints on at large scales (where we have assumed a constant value) to predictions from perturbation theory. We detect a significant deviation consistent with a non-linear, quadratic contribution to the -band galaxy bias, parameterised as =0.570.33 (derived from fits in the range 4.010Mpc), implying that the 2MASS galaxy density rises more quickly than the mass density contrast. This positive result represents a significant difference from the negative values found previously; constraints on from the optically-selected 2dFGRS and the infra-red PSCz samples yield negative values. We explain these apparently contradictory results through an examination of the model of Mo et al. (1997), which predicts bias parameters of (the linear bias) and 0 (the quadratic bias) if the surveyed galaxies typically reside in large mass haloes. Similarly, as observed previously, we might expect 1 and 0 from galaxy samples in which late-type galaxies are over-represented.
Acknowledgements
This publication makes use of data products from the 2 Micron All-Sky Survey, which is a joint project of the University of Massachusetts and the Infrared Processing and Analysis Centre/California Institute of Technology, funded by the Aeronautics and Space Administration and the National Science Foundation. We thank Carlton Baugh for kindly reading through this paper and providing useful feedback. We also thank Enrique Gaztañaga for useful discussion.
References
- Acquaviva et al. (2003) Acquaviva, V., Bartolo, N., Matarrese, S. & Riotto, A. 2003, Nucl. Phys. B, 667, 119
- Arkani-Hamed et al. (2004) Arkani-Hamed, N., Creminelli, P., Mukohyama, S. & Zaldarriaga, M. 2004, J. Cosmol. Astropart. Phys., 04, 001
- Avelino et al. (1998) Avelino, P.P., Shellard, E.P., Wu, J.H. & Allen, B. 1998, ApJ, 507, L101
- Baugh & Efstathiou (1993) Baugh, C.M. & Efstathiou, G. 1993, MNRAS, 265, 145
- Baugh et al. (1995) Baugh, C.M., Gaztañaga, E. & Efstathiou, G. 1995, MNRAS, 274, 1049
- Baugh (1996) Baugh, C.M. 1996, MNRAS, 280, 267
- Baugh et al. (2004) Baugh, C.M. et al. 2004, MNRAS, 351, L44
- Bernardeau (1992) Bernardeau, F. 1992, ApJ, 392, 1
- Bernardeau et al. (2002) Bernardeau, F., Colombi, S., Gaztañaga, E. & Scoccimarro, R. 2002, Phys. Rep., 367, 1
- Bernardeau (1994a) Bernardeau, F. 1994a, A&A, 291, 697
- Bernardeau (1994b) Bernardeau, F. 1994b, ApJ, 433, 1
- Bernardeau & Uzan (2003) Bernardeau, F. & Uzan, J.P. 2003, Phys. Rev. D., 67, 121301
- Bouchet et al. (1992) Bouchet, F.R., Juszkiewicz, R., Colombi, S. & Pellat, R. 1992, ApJ, 394, L15
- Bouchet et al. (1993) Bouchet, F.R., Strauss, M., Davis, M., Fisher, K., Yahil, A. & Huchra, J. 1993, ApJ, 417, 36
- Busswell et al. (2004) Busswell, G.S., Shanks, T., Outram, P.J., Frith, W.J., Metcalfe, N. & Fong, R. 2004, MNRAS, 354, 991
- Cabella et al. (2005) Cabella, P., Liguori, M., Hansen, F.K., Marinucci, D., Matarrese, S., Moscardini, L. & Vittorio, N. 2005, MNRAS, 358, 684
- Carlberg et al. (2000) Carlberg, R.G., Yee, H.K., Morris, S.L., Lin, H., Hall, P.B., Patton, D., Sarwicki, M. & Shepherd, C.W. 2000, ApJ, 542, 57
- Cole et al. (2001) Cole, S.M. et al. 2001, MNRAS, 326, 555
- Cole et al. (2005) Cole, S.M. et al. 2005, accepted by MNRAS, astro-ph/0501174
- Croton et al. (2004) Croton, D.J. et al. 2004, MNRAS, 352, 1232
- Croton et al. (2005) Croton, D.J. et al. 2005, MNRAS, 356, 1155
- Falk et al. (1993) Falk, T., Rangarajan, R. & Srednicki, M. 1993, ApJ, 403, L1
- Feldman et al. (2001) Feldman, H.A., Frieman, J.A., Fry, J.N. & Scoccimarro, R. 2001, Phys. Rev. Lett., 86, 1434
- Frith et al. (2003) Frith, W.J., Busswell, G.S., Fong, R., Metcalfe, N. & Shanks, T. 2003, MNRAS, 345, 1049
- Frith et al. (2004) Frith, W.J., Outram, P.J. & Shanks, T. 2004, ASP Conf. Proc., Volume 329, 49
- Frith et al. (2005a) Frith, W.J., Shanks, T. & Outram, P.J. 2005a, MNRAS, 361, 701
- Frith et al. (2005b) Frith, W.J., Outram, P.J. & Shanks, T. 2005b, submitted to MNRAS, astro-ph/0507215
- Fry (1984) Fry, J.N. 1984, ApJ, 279, 499
- Fry & Gaztañaga (1993) Fry, J.N. & Gaztañaga, E. 1993, ApJ, 413, 447
- Gangui et al. (1994) Gangui, A., Lucchin, F., Matarrese, S. & Mollerach, S. 1994, ApJ, 430, 447
- Gaztañaga (1994) Gaztañaga, E. 1994, MNRAS, 268, 913
- Gaztañaga & Frieman (1994) Gaztañaga, E. & Frieman, J.A. 1994, ApJ, 437, L13
- Gaztañaga & Baugh (1995) Gaztañaga, E. & Baugh, C.M. 1995, MNRAS, 273, L1
- Gaztañaga & Mahonen (1996) Gaztañaga, E. & Mahonen, P. 1996, ApJ, 462, L1
- Gaztañaga & Fosalba (1998) Gaztañaga, E. & Fosalba, P. 1998, MNRAS, 301, 524
- Gaztañaga & Bernardeau (1998) Gaztañaga, E. & Bernardeau, F. 1998, A&A, 331, 829
- Gaztañaga et al. (2005) Gaztañaga, E., Norberg, P., Baugh, C.M. & Croton, D.J. 2005, submitted to MNRAS, astro-ph/0506249
- Groth & Peebles (1977) Groth, E.J. & Peebles, P.J.E. 1977, ApJ, 217, 385
- Hamilton et al. (1991) Hamilton, A.J., Kumar, P., Lu, E. & Matthews, A. 1991, ApJ, 374, 1
- Hawkins et al. (2003) Hawkins, E. et al. 2003, MNRAS, 346, 78
- Hoyle et al. (2000) Hoyle, F., Szapudi, I. & Baugh, C.M. 2000, MNRAS, 317, 51
- Jarrett et al. (2000) Jarrett, T.H., Chester, T., Cutri, R., Schneider, S., Skrutskie, M. & Huchra, J.P. 2000, AJ, 119, 2498
- Jarrett (2004) Jarrett, T.H. 2004, astro-ph/0405069
- Jenkins et al. (1998) Jenkins, A. et al. 1998, ApJ, 499, 20
- Jones et al. (2004) Jones, D.H. et al. 2004, MNRAS, 355, 747
- Juszkiewicz et al. (1993) Juszkiewicz, R., Bouchet, F.R. & Colombi, S. 1993, ApJ, 412, 9
- Kofman & Pogosyan (1988) Kofman, L. & Pogosyan, D.Y. 1988, Phys. Lett. B, 214, 508
- Lesgourgues (1997) Lesgourgues, J., Polarski, D. & Starobinsky, A.A. 1997, Nucl. Phys. B, 497, 479
- Loveday (2000) Loveday, J. 2000, MNRAS, 312, 517
- Maldacena (2002) Maldacena, J. 2002, JHEP, 0305, 013
- Maller et al. (2005) Maller, A.H., McIntosh, D.H., Katz, N. & Weinberg, M.D. 2005, ApJ, 619, 147
- Maller et al. (2003) Maller, A.H., McIntosh, D.H., Katz, N. & Weinberg, M.D. 2003, ApJ, 598, 1
- Mo et al. (1997) Mo, H.J., Jing, Y.P. & White, S.D. 1997, MNRAS, 284, 189
- Oliver et al. (1996) Oliver, S.J. et al. 1996, MNRAS, 280, 673
- Pan & Szapudi (2005) Pan, J. & Szapudi, I. 2005, submitted to MNRAS, astro-ph/0505422
- Peacock & Dodds (1994) Peacock, J.A. & Dodds, S.J. 1994, MNRAS, 267, 1020
- Peebles (1980) Peebles, P.J.E. 1980, Principles of Physical Cosmology, Princeton University Press
- Percival et al. (2001) Percival, W.J. et al. 2001, MNRAS, 327, 1297
- Press & Schechter (1974) Press, W.H. & Schechter, P. 1974, ApJ, 187, 425
- Salopek & Bond (1991) Salopek, D.S. & Bond, J.R. 1991, Phys. Rev. D, 43, 1005
- Saunders et al. (1991) Saunders, W. et al. 1991, Nat, 349, 32
- Schlegel et al. (1998) Schlegel, D.J., Finkbeiner, D.P. & Davis, M. 1998, ApJ, 500, 525
- Scoccimarro et al. (2003) Scoccimarro, R., Sefusatti, E. & Zaldarriaga, M. 2003, Phys. Rev. D, 69, 103513
- Silk & Juszkiewicz (1991) Silk, J. & Juszkiewicz, R. 1991, Nat, 353, 386
- Spergel et al. (2003) Spergel, D.N. et al. 2003, ApJS, 148, 175
- Szapudi & Gaztañaga (1998) Szapudi, I. & Gaztañaga, E. 1998, MNRAS, 300, 493
- Szapudi et al. (2000) Szapudi, I., Colombi, S., Jenkins, A. & Colberg, J. 2000, MNRAS, 313, 725
- Turok & Spergel (1991) Turok, N. & Spergel, D.N. 1991, Phys. Rev. Lett., 66, 3093
- Verde et al. (2002) Verde, L. et al. 2002, MNRAS, 335, 432
- Wang & Kamionkowski (2000) Wang, L. & Kamionkowski, M. 2000, Phys. Rev. D, 61, 063504
- Weinberg & Cole (1992) Weinberg, D.H. & Cole, S.M. 1992, MNRAS, 259, 652
- Wilson (2003) Wilson, G. 2003, ApJ, 585, 191
- White (1999) White, M. 1999, MNRAS, 310, 511
- Zehavi et al. (2004) Zehavi, I. et al. 2004, ApJ, 608, 16