Spectroscopy of twelve Type Ia supernovae at intermediate redshift
We present spectra of twelve Type Ia supernovae obtained in 1999 at the William Herschel Telescope and the Nordic Optical Telescope during a search for Type Ia supernovae (SN Ia) at intermediate redshift. The spectra range from to , including five high signal-to-noise ratio SN Ia spectra in the still largely unexplored range . Most of the spectra were obtained before or around restframe B-band maximum light. None of them shows the peculiar spectral features found in low-redshift over- or under-luminous SN Ia. Expansion velocities of characteristic spectral absorption features such as SiII at Å, SII at Å and CaII at Å are found consistent with their low- SN Ia counterparts.
Key Words.:
cosmology:observations – supernovae:general1 Introduction
Type Ia supernovae (SN Ia) provide us with a powerful tool for constraining cosmology through the magnitude-redshift Hubble diagram. In the last decade, systematic searches for SN Ia have been performed in view of increasing the statistics at all redshifts, while at the same time trying to improve our understanding of these events. Programs launched in the early nineties were targeting high-redshift () supernovae and have lead to the discovery of the acceleration of the expansion of the universe (Riess et al., 1998; Perlmutter et al., 1999). More recently, even more distant SN Ia (up to redshift ) have been discovered and followed-up with HST/ACS allowing one to “observe” the turn-around epoch of the acceleration history of the universe (Riess et al., 2004). The nearby supernovae () have also received great attention, as they are necessary to anchor the Hubble diagram at low redshift and because they offer the possibility to study systematics since they are easier to observe than their high redshift counterparts.
Although the number of high-redshift SN Ia discovered and followed-up greatly increased along the years and is now rapidly approaching a thousand111current high-statistics programs such as ESSENCE (www.ctio.noao.edu/wsen) or SNLS (cfht.hawaii.edu/SNLS) now target number statistics of well measured SN Ia well above the several hundreds in large multi-year projects, the gap observed in the Hubble diagram at intermediate redshift range has endured. Indeed, optimizing supernova searches in that redshift range requires securing large fractions of observing time on an intermediate size telescope () with a large field of view () in order to ensure efficient detection of a large enough number of supernovae for the duration of the survey. Intermediate redshift supernova programs are thus subject to the availability of such telescopes and instruments. Nevertheless, observing supernovae at intermediate redshift is crucial not only to ”bridge the gap” between the low- and high-redshift samples to increase the precision in measuring the cosmological parameters, but also to obtain precise restframe U-band photometry and spectroscopy of SN Ia, otherwise difficult to obtain on nearby objects because of the low detector efficiency and strong variability of the atmosphere in the U-band.
Of utmost importance is to check that the properties of SN Ia do not significantly evolve with redshift. Among potential systematics is the evolution of SNe Ia spectral characteristics with . Differences in the SNe Ia environment and parent population are likely to translate into differences in the presence and evolution of spectral features. Indeed, as our knowledge of observable properties of SN Ia improves, it clearly appears that diversity rather than uniformity is common among type Ia supernovae (Branch, 1987; Branch et al., 1988; Hatano et al., 2000; Benetti et al., 2004, 2005). It is crucial to quantify this diversity in order to estimate to what extent it affects the validity and accuracy of the cosmic parameter determination from the Hubble diagram. In this respect, an enlarged sample of precisely measured intermediate redshift SN Ia spectra is needed to improve our understanding of their behavior.
It is thus important to discover and follow-up both photometrically and with spectroscopy a substantial number of SN Ia in the intermediate () redshift range. For this reason we launched, during the year of 1999, a campaign to search and follow-up SN Ia in that redshift range. A second campaign was pursued during the year 2002. In this paper, we present the spectra taken at the William Herschel Telescope (WHT) and at the Nordic Optical telescope (NOT) of the twelve supernovae discovered in the spring and fall 1999, at the Isaac Newton Telescope in La Palma observatory. The photometric follow-up of five of these supernovae and their inclusion in the Hubble diagram will be presented in a subsequent paper. In Sect. 2, we briefly describe the search strategy and discovery technique used. In Sect. 3, the spectroscopic observations of the supernova candidates, including the reduction procedure, are presented. In Sect. 4 and 5, we focus on the identification and analysis of our set of SN Ia spectra. Discussion of results and comparison to other works are done in Sect. 6. Concluding remarks are given in Sect. 7.
2 Search for SN Ia at intermediate redshift
As the present paper focuses on the spectral analysis of the SN Ia sample, we only briefly describe here the strategy and technique used to discover the supernovae.
2.1 Overall strategy
The search for supernovae was performed on images taken using the Wide Field Camera (WFC), a four 2k4k thinned EEV CCD mosaic with a square degree FOV mounted on the Isaac Newton telescope. Most of the observations were done as part of the Isaac Newton Group’s Wide Field Survey (WFS), a public access survey of multicolor data obtained over a 5 year period through the INT photometric filters set (u’ through z’) over more than 200 square degrees with a typical depth of and (Walton et al., 1999; McMahon et al., 2001). WFS observations were scheduled as to permit repeated observations of the same area of sky. Detection of the SN candidates was done by repeated imaging, in the Sloan-Gunn g’1996 filter, of the South Galactic Cap (SGC) fields over an area of square degrees. SGC fields at zero declination were chosen so that follow-up from both northern and southern hemispheres could be done. After a test period in April 1999 whose purpose was to validate our strategy and detection technique, 600 s images were taken around the new moon in August 1999 (new moon on August 11th) and then used as the input baseline reference images for the subsequent supernova search. As the restframe rise time for SN Ia is about 18 days (Aldering et al., 2000; Riess et al., 1999a), two new images of 240 s each of the same fields in the same g’ filter were taken roughly a month later (around the September new moon) in order to discover the supernovae around their maximum light (Perlmutter et al., 1997). The schedule of this new set of observations was optimized to ensure the best matching in seeing between the reference and new images. The image quality of the data was generally good, with a median seeing of arcsec.
2.2 Discovery technique
The search procedure generates potential SN Ia candidates, as well as other objects, such as AGN, other SNe types, asteroids, etc. The new image (the discovery image) consisted in two exposures taken one hour apart, so as to reject cosmic ray hits and asteroids. After pre-processing , the discovery images were co-added and three subtracted frames were built, by subtracting, from the reference image, one or the other discovery image, or their sum. These subtracted frames were then searched for point-like sources. The supernova candidates were selected by requiring that they were detected on the 3 subtracted frames, at the same place within 2 pixels (0.66 arcsec) in order to reject cosmic rays and asteroids, and that their flux within an aperture of 1 full width at half maximum (FWHM) in radius is at least larger than 15 % of the flux measured in a similar aperture on the reference frame (so as to eliminate subtraction residuals). This requirement also rejects slow varying objects, as plateau type II supernovae. Finally, the supernova candidates were visually checked by two independent scanners. These candidates were re-observed the following night, and kept only if re-detected with a similar (or higher) flux. This last procedure tends to eliminate any slow-moving object and supernovae on the decline. The quality of the candidate as a potential supernova was estimated from its flux and shape parameters and prioritized as very likely, probable or possible supernova. A total of fifteen candidates was obtained (the ’September candidates’ Astier & Goobar (1999)). Spectra were obtained within a few days after detection during pre-scheduled spectroscopic follow-up time at WHT. For two candidates, complementary spectra were obtained at the Nordic Optical Telescope (NOT) about three weeks after discovery. Ten out of the fifteen spectroed candidates have been confirmed as SN Ia . To this set, we add two more supernovae (the ’April candidates’ Hardin et al. (1999); Hardin (1999)) obtained in a similar way during the test run in April 1999 (see below).
3 Spectral observations and reduction
3.1 Observations
Spectra of all the supernova candidates were obtained with the ISIS spectrograph at the 4.2-m William Herschel telescope (WHT) on April 19 and 20 (SN 1999cj and SN 1999ck discovered during the test run) and on September 12th, 13th and 14th 1999 for the fifteen September candidates.
For April 1999 candidates, both the red and blue channels of ISIS were used along with the ISIS 6100 dichroic filter. For the blue part, we had a blue sensitive thinned EEV CCD of 4096 pixels combined with the grating R158B (useful spectral range from 4000 to 6200 Å, dispersion 1.62 Å per pixel). For the red part, the detector used was a pixel TEK CCD device operating in its standard mode and combined with the R158R grating covering a total useful spectral range of 6000 to 8000Å with a wavelength bin per pixel of 2.90 Å. With this device, fringing is negligible below 7500 Å.
Three exposures of 1800s each were obtained for the two April candidates, both in the blue and red parts, with a long slit of 1 arcsec width. Copper-neon arcs were used for wavelength calibration. Two standards were observed and used for flux calibration (BD+33∘2642 and BD+28∘4211, see below).
During the September campaign, only the red channel of the spectrograph was used in order to avoid some sensitivity loss due to the dichroic filter. Even though the two April spectra were of acceptable quality, removing the dichroïc filter allowed us to optimize the efficiency in the red channel, where the principal features of SN Ia are present for our redshift range. The red arm had the same detector as in April. Three long-slit spectra of 1800 s each were obtained for each candidate, except for SN 1999dx, SN 1999dv and SN 1999gx for which only two 1800 s exposures were taken. A slit width of 1.5 arcsec was used. Parallactic angle was generally used to minimize loss by differential refraction. In some cases, the slit was put at a specific orientation in an attempt to take a spectrum of the host galaxy at the same time as the supernova spectrum. Three spectrophotometric standards were observed each night (Feige 25, BD+28∘4211 and Feige 110), with both 1.5 arcsec and 8 arcsec widths. Copper-neon arcs were obtained at the beginning and end of each night for the purpose of wavelength calibration.
Weather conditions were good for the three September nights with a seeing of about 1 arcsec or less, except for the first half of the second night (seeing about 3 arcsec). Five candidates were observed during each night. Two additional exposures of one faint candidate (SN 1999dz first observed on September 13) were obtained during the night of September 14th.
Additional observations of SN 1999du and of SN 1999dv were obtained on October 2nd, 1999 at the 2.5m Nordic Optical Telescope (NOT) in La Palma. Long slit spectra have been acquired with the ALFOSC spectrometer, using a 300 lines/mm grism (number 4) and a CCD Loral (2048x2048 pixels) detector of 15 pixel size. The wavelength coverage ranges from 4200 to 8900 Å. However, due to the presence of the second order spectrum with this grism, the useful range is reduced to approximately 4200 to 6000Å. A slit width of 2.5 arcsec and of 1 arcsec, yielding a resolution of 35-40 Å and of 14 Å have been used for SN 1999du and SN 1999dv respectively. Five spectra of SN 1999du and six spectra of SN 1999dv were obtained with an exposure time of 1800 s. The last spectrum of SN 1999du is very weak and not considered in the following. BD+28∘4211, observed on October 3, has been used for flux calibration purposes and helium lamp spectra were taken for wavelength calibration. The seeing during the NOT observations was always better than 1 arcsec.
A summary of the spectroscopic observations are given in Table Spectroscopy of twelve Type Ia supernovae at intermediate redshift.
3.2 Reduction
A preliminary assessment of the spectroscopic data was performed interactively at the telescope to allow for confirmation of the candidate, so as to select the supernova sample for photometric follow-up as soon as possible after discovery.
The spectroscopic reduction was redone using the ESO-MIDAS data reduction software version 02SEP. An average bias and normalized flat field frames, obtained from an internal tungsten lamp, are produced for each night using a median filter in order to remove cosmic ray hits. A two dimensional wavelength calibration is done, using copper-neon arcs, by computing a dispersion relation for each row of pixels along the dispersion direction (horizontal with our set-up) over the entire two dimensional frame. This corrects for some distortion along the wavelength direction and minimizes subtraction residuals after sky removal. About 40 lines are identified and used, covering the total spectral range in a regular way. This leads to a precision better than 0.05% over the whole spectrum. Finally, we check on a few prominent sky emission lines (NaI at 5893Å and [OI] at 5577, 6300 and 6363 Å) that the wavelength accuracy is consistent with this value, corresponding to less than 1 Å difference between the calibrated sky line and its theoretical wavelength. Extraction of the spectrum is then performed from the 2D calibrated frame using a procedure based on Horne (1986) weighting algorithm optimizing sky subtraction and flux extraction. An error spectrum, essentially dominated by the sky signal, is generated.
After correcting for atmospheric extinction using the extinction curve of La Palma observatory (King, 1985), absolute flux calibration is done. A response curve is computed by comparing our observed spectrophotometric standard stars with their tabulated absolute flux (in practice, we used Feige 110 to calibrate all the September spectra, and BD+28∘4211 and BD+33∘2642 for, respectively, the blue and red part of the April spectra). This response curve is then applied to our spectra. Finally, we remove “by hand” sky residuals resulting from bad sky subtraction or remaining cosmics. We do not attempt to remove atmospheric absorption lines around 6900 Å.
For the two April spectra, the reduction and extraction was performed on the blue and red frames in a separate way. After flux calibration, the two parts of the spectrum were combined to give the final full spectrum, with a useful wavelength coverage from about 4000 to 7500 Å. The two parts overlap nicely over Å around 6100 Å , showing that our flux calibration or extraction procedure is not significantly in error.
As for the WHT data, standard reduction for NOT data was performed in the ESO-MIDAS environment (cosmic removal, bias subtraction, flat-field correction, 2D-wavelength calibration, and flux calibration). Again, the wavelength calibration was checked against sky lines. They were found within 3-4 Å from their tabulated wavelengths. Extraction was done following the same procedure as for WHT spectra.
4 Identification
4.1 Redshift determination
Redshift determination is based on the identification of characteristic galactic emission and absorption lines which are narrower than any supernova feature. We use mainly [OII] at 3727Å, CaII H&K at 3945 Å, [OIII] doublet at 5000Å or , or several of these lines together if present. We do a gaussian fit of the line profile. The relative spectral resolution is typically less than 0.05 % over the useful spectral range (see Sect. 3.2) which translates into an absolute error on the redshift less than 0.001 at and less than 0.0005 at . In the following, redshifts are thus given with three significant figures.
4.2 SN template fitting
Identification of the candidates is done using a software tool developed by one of us (Sainton, 2004a, b). The software, called -fit, is based on a minimization fitting of the reduced spectrum to a set of known spectral templates. As contamination from the host galaxy often occurs, a model spectrum consisting of the weighted sum of a fraction of a supernova and a fraction of a galaxy template (or of the observed galaxy host when available) is built in the restframe:
| (1) |
All template spectra are initially in the restframe and are appropriately redshifted. The redshift determined from galaxy lines (see previous subsection) is used to constrain the input redshift interval to search for the solution, although it is not mandatory as the input redshift interval can be left arbitrarily large ( is then considered as a free parameter). The fitting is done against the set of parameters (,,) and is robustified against undesirable points such as regions where atmospheric absorption takes place or where sky subtraction residuals are present.
The fit is done for every template couple (supernova, galaxy) available in our database and results are classified in increasing order of reduced . In order to assess the significance of the best-fit solution, we systematically examine the immediately following solutions to check for possible degeneracies in the models. It is clear that the result will greatly depend on the content of the database and special care has been put to build it. It contains about 150 spectra (mostly supernovae plus a dozen galaxy templates) taken from various sources. The set of supernova templates contains local ’normal’ SN Ia as well as several peculiar Ia and Ib/Ic/II supernovae. These spectra have been put into the restframe. Galaxy templates are taken from Kinney et al. (1996). Morphological types include bulge, E, S0, Sa, Sb, Sc, and starbursts (Stb) with various amount of reddening (Calzetti et al., 1994; Kinney et al., 1996). We refer the reader to Appendix A for more details.
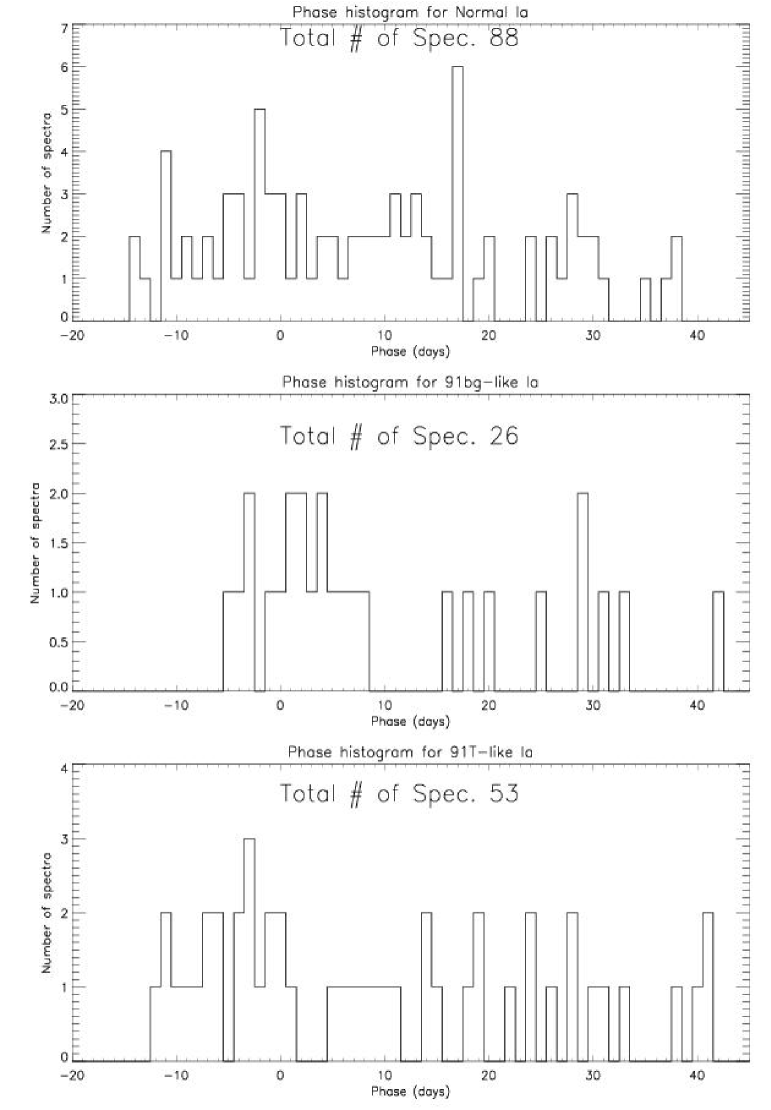
One concern with the database is the uniformity of the sampling of the supernova phase (the date of the SN spectrum template with respect to maximum light). If the sampling is too scarce, this limits the resolution on the phase of the observed spectrum we get from the fit (we call this phase the “spectral phase”). We find a typical day difference on the spectral phase. Higher differences between two solutions similar in terms of can happen when the SN signal is weak with respect to the host galaxy or when the spectrum of the SN is acquired well after maximum light, as spectral features evolve less rapidly a few weeks after maximum (phase degenerate solutions). Since the detection procedure is optimized to pick up SN around maximum, this latter case happens only rarely. Another concern is related to the fact that we do not try to make any accurate determination of the reddening to the SN. Indeed many effects combine to account for the reddening that are difficult to separate: differential slit losses when not at the parallactic angle, errors in flux calibration and template spectra uncorrected for reddening. Modeling ’reddening’ by adding a term in equation (1), as in Howell et al. (2002), is thus subject to caution as interpretation of such a term is difficult and we choose not to do so. This means that some degeneracy might exist between the best-fit phase and a possibly ’reddened’ SN or template. This might increase the uncertainty in the phase determination.
To quantify this effect, we have artificially reddened the template spectrum of SN 1994D at -2 days (Patat et al., 1996), using the reddening law of Howarth (Howarth, 1983) for E(B-V)=0.2, 0.4, 0.6 and 0.8. We have then fitted this spectrum, using -fit, with a set of spectral templates introduced by Nugent et al. (2002) and modified by Nobili et al. (2003). These templates are constructed from a broad sample of SN Ia and they are calibrated so as to reproduce the magnitude evolution along the supernova light-curve in the BVRI passbands. Spectrally, they offer, contrary to local templates of individual SN Ia , a phase resolution of 1 day over a large phase range. For our purpose, we only consider templates between -10 and + 10 days. For each value of E(B-V), we compute the phase from the first best-fit solutions by weighting the phase of each solution with the corresponding probability . For the unreddened spectrum of SN 1994D, as well as for E(B-V)=0.2, the phase obtained is days. The original -2 days phase is thus recovered within less than 2 days. For E(B-V)=0.4, 0.6 and 0.8, the difference between the original phase and the determination from -fit increases: the obtained phase is and respectively. As the original spectrum is progressively reddened, later-phase (i.e. redder) spectra are selected by the identification procedure. Note that the visual aspect of the fit is considerably degraded for E(B-V) values higher than 0.2. We conclude that for moderate reddening, the phase determination is reliable within 2 to 3 days. For higher values, no satisfying fit is obtained. In these cases, visual examination of the spectrum reveals the reddened nature of the spectrum.
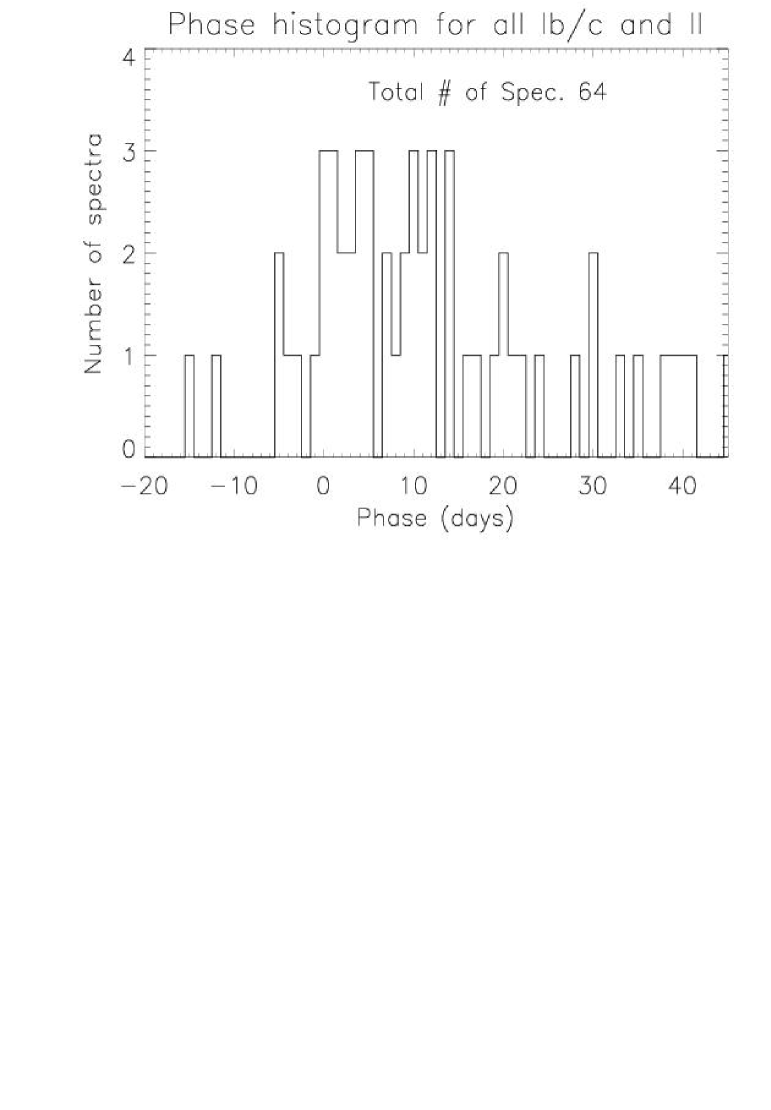
An other concern is the possible misidentification of a SN Ia spectrum around maximum as a type Ib/Ic or II supernova. The P-Cygni features of a type II spectrum might fit some portion of the red part of a SN Ia spectrum before or close to maximum. More likely, a type Ic spectrum might be misidentified as a type Ia. In particular, this can happen when the fit is performed on a too small portion of the spectrum to be identified. In any case, it is important to have a sufficient number of type Ib/Ic/II spectral templates in the database. At the time of this analysis, we dispose of 64 spectra of type Ib/Ic/II objects (see Appendix A).
In the present analysis, the redshift is always determined from galaxy lines and it can be safely constrained in -fit. Templates selected in the spectral database typically cover a large wavelength range but as they are redshifted, the overlap between the model spectrum (redshifted SN + Galaxy) and the observed spectrum might be small. This can lead to an unreliable identification as confusion with other types may occur. It is thus important to check a posteriori that the best-fit solution spans a large enough wavelength range. In case it is too small, inspection of adjacent solutions is necessary to assess the validity of the best-fit solution.
Obviously, the reliability of the identification depends on the underlying model, which is directly connected to the number, quality and variety of templates available in the database. A good phase sampling is necessary but a sufficient number of spectra of different SN Ia supernovae at a given phase is also required in order to reflect the intrinsic differences observed in SN Ia spectra at low redshift. Note that the higher the quality of the observed spectrum is, the more significant the discrepancies between the model and the observed spectrum are, in terms of value. A high best-fit value for a given spectrum either happens when the observed spectrum does not correspond to a supernova (and thus no satisfying model can be constructed from templates available in the database), or when the signal-to-noise of the observed spectrum is high. In any case, changes between solutions for a given supernova are meaningful but direct comparison of best-fit values for different supernovae should be done only in the case of comparable signal-to-noise.
4.3 Host galaxy subtraction
Host galaxy subtraction is clearly an important step in the supernova spectrum identification. In our sample, some of the supernova spectra are indeed deeply contaminated by the emission of their host. This is the case for SN 1999dt, SN 1999du (WHT spectrum), SN 1999dw, SN 1999dx, SN 1999dz or SN 1999gx. Identification of the host type is done on the full (i.e. SN+host) extracted spectrum by direct examination of several spectral features allowing to discriminate, at least broadly, between types. We adopt a division into three main morphological classes, similarly to Sullivan et al. (2003): type 0 corresponds to spheroids (E/S0/bulge), type 1 to early-type spirals (Sa/Sb) and type 2 to late-type spirals and starbursts (Sc/Stb). (We do not have any irregular galaxy template in our database.) Spectral features used for the identification (as well as for redshift determination; see §4.1) include CaII H&K absorption lines at and Å, the 4000 Å break (), Hydrogen Balmer lines (mostly and given the redshift range of the present spectra), oxygen forbidden lines [OII] and [OIII]. We also consider a feature around Å: the presence in early-type spectra of a large trough, absent in later-type spectra, due to CN molecular absorption blueward of Å in cool stars (we label it T3850). This feature correlates with the strength of Mgb absorption at Å (restframe), an other useful metallicity indicator. Using all these features allows classification of all host galaxies into one of the three main categories defined above.
Subtraction of the host from the supernova spectrum is performed as part of the fitting procedure by -fit. In two cases (SN 1999dr and the NOT spectrum of SN 1999du), it is possible to use the observed host spectrum to create the model to be fitted. Subtraction of galaxy lines is then optimal. In all other cases, however, it is not possible to extract separately the host. We then use a host galaxy template of high signal-to-noise ratio appropriately redshifted (see §4.2). This offers two advantages over a subtraction based on using the real host spectrum: first, as the template used has a high S/N ratio, the resulting supernova S/N is essentially not degraded by the subtraction; second, as the extraction procedure relies on a minimization, the best-fit solution gives in itself a hint of the host type (the ’best-fit host type’) that can be used as an a posteriori identification check by comparing to the identification based on galaxy features. Moreover, the ratio of the galaxy to the total supernova+galaxy signal is computed by -fit as a byproduct of the fitting procedure. This ratio represents the contribution of the galaxy in the best-fit model in the range of overlap with the observed spectrum. This allows us to quantify the degree of contamination by the host. Although limited by the imperfect sampling of galactic type templates in our database, it nevertheless gives a valuable indication on the host type and degree of contamination of the supernova.
5 Spectroscopic results
5.1 Notes on individual SN Ia
As an output of the fitting procedure, a host-subtracted supernova spectrum is thus obtained along with the best-fit supernova template and parameters. Table Spectroscopy of twelve Type Ia supernovae at intermediate redshift summarizes these results of the fitting procedure for each supernova. Columns 3 and 4 give the best-fit supernova template along with the percentage of galaxy contamination and galaxy type. Columns 5 and 6 give the best-fit redshift obtained from the fitting procedure and the host redshift respectively. is obtained by redoing a fit of the supernova spectrum obtained after a first fit, cleaned from any residual galactic line. Column 7 gives the phase associated with the best-fit supernova+galaxy spectrum. As mentioned above, the phase has to be considered with a typical day uncertainty. Finally, the minimum reduced and number of degrees of freedom are given in columns 8 and 9.
Examining, for each supernova, the solution immediately following the best-fit solution in the list of increasing reduced , we generally find that the phase is rather stable and within days of the best-fit solution. For three supernovae (SN 1999cj, SN 1999dr and SN 1999gx), the phase difference is larger, up to days. Note that SN 1999dr is a supernova well after maximum light (its spectral features evolve less rapidly than around maximum). The same argument may apply to SN 1999cj (+9 days), although the effect is not found for the +9 days SN 1999dv NOT spectrum. The signal-to-noise of this latter spectrum is however higher than for SN 1999cj and phase determination should be more accurate. Finally, SN 1999gx is a distant SN and is dominated by the host galaxy.
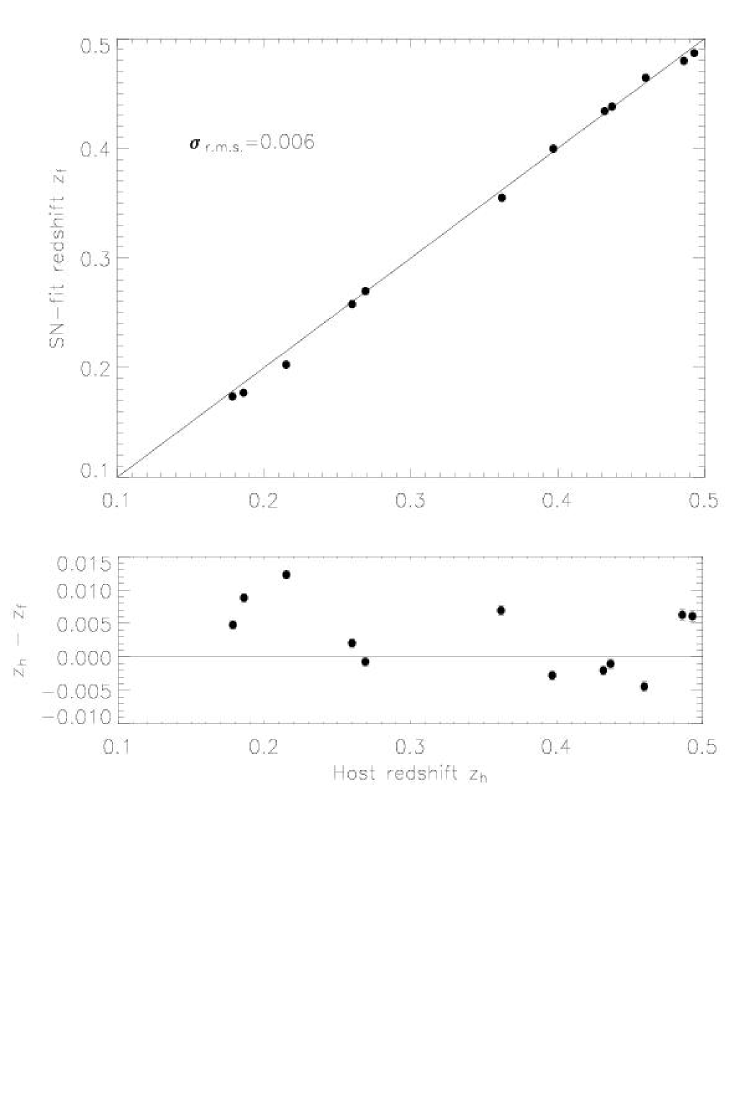
The best-fit solutions are obtained in all cases for ’normal’ SN Ia templates, as opposed to peculiar SN Ia and other types (Ib/c and II). Figure 1 (upper panel) shows the best-fit redshift (column 5 of Table Spectroscopy of twelve Type Ia supernovae at intermediate redshift) as a function of the redshift obtained from line identifications (the host redshift , column 6 of Table Spectroscopy of twelve Type Ia supernovae at intermediate redshift). Residuals are shown on the lower panel of Fig. 1. The two quantities agree within a few percent. Error bars on the host redshift are shown (they are smaller than the filled circle symbols and do not appear on the upper panel). When galactic features are weak, more difference is observed (see, e.g., SN 1999dy) but no clear systematic effect has been identified (see lower panel of Fig. 1). We find a r.m.s. dispersion of for the whole sample. This value can be considered as a typical error on the redshift determination by -fit. The average redshift of the sample is .
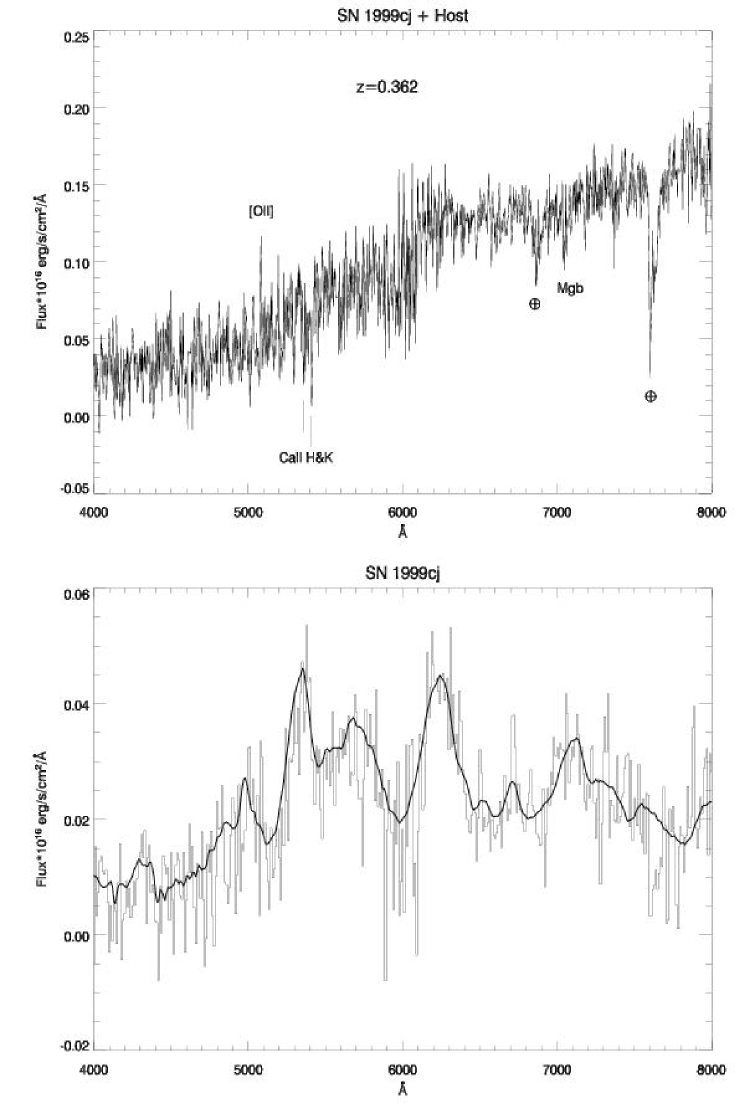
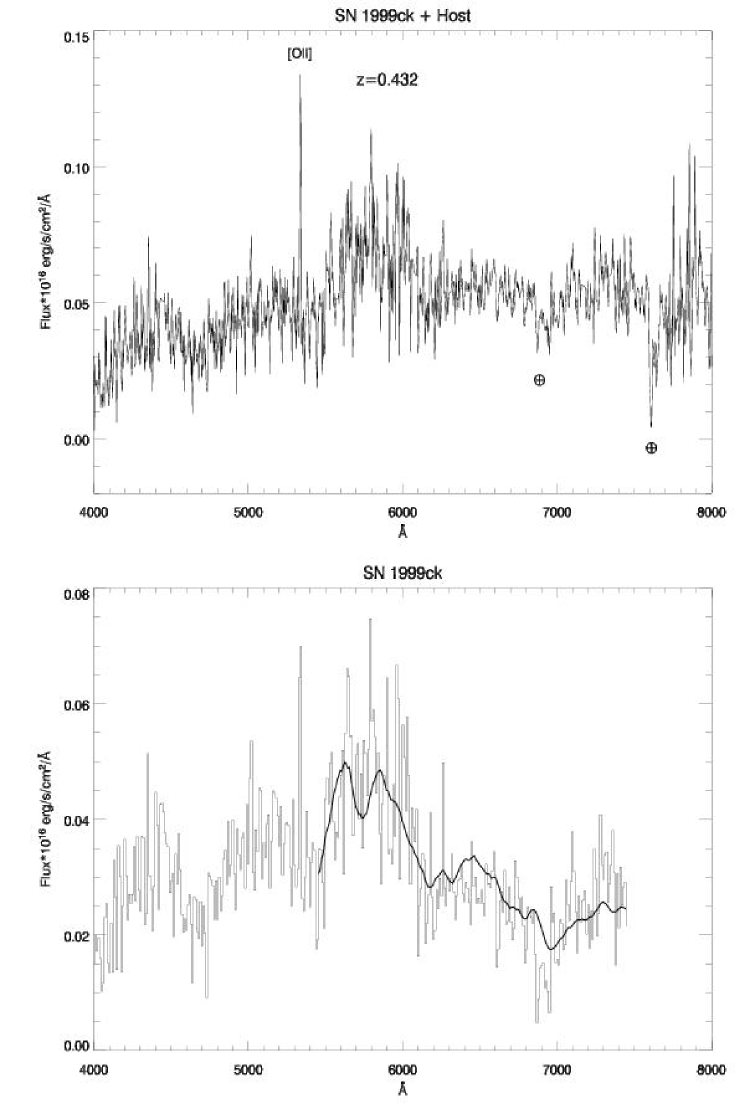
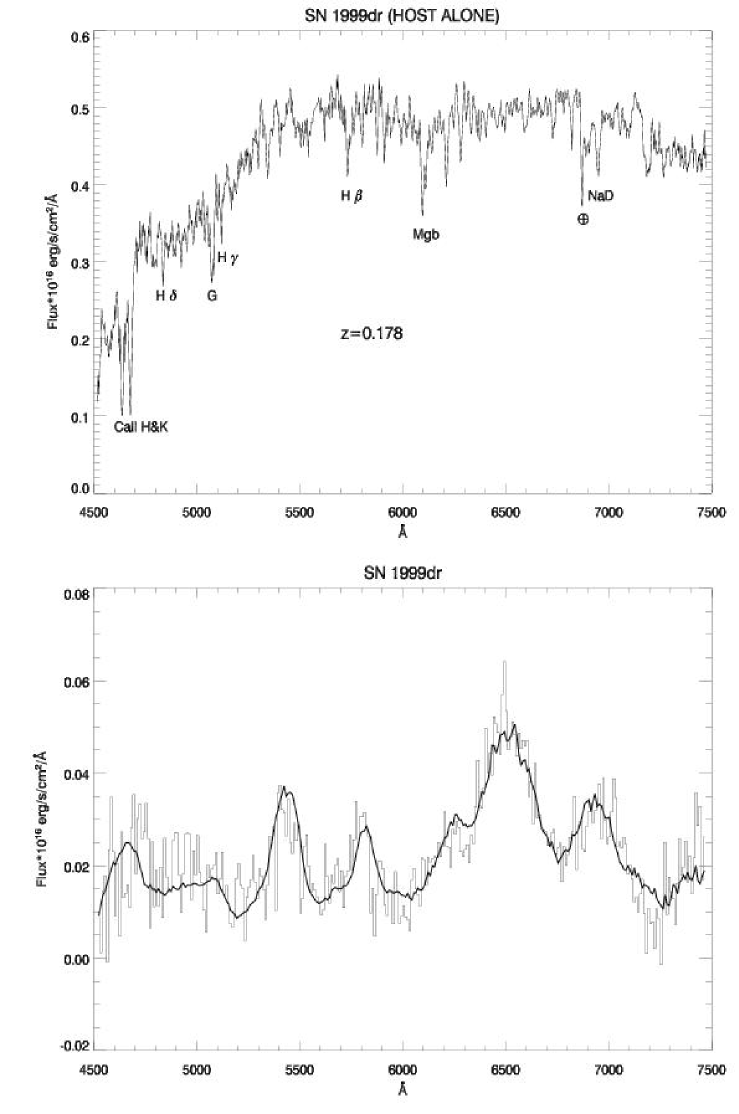
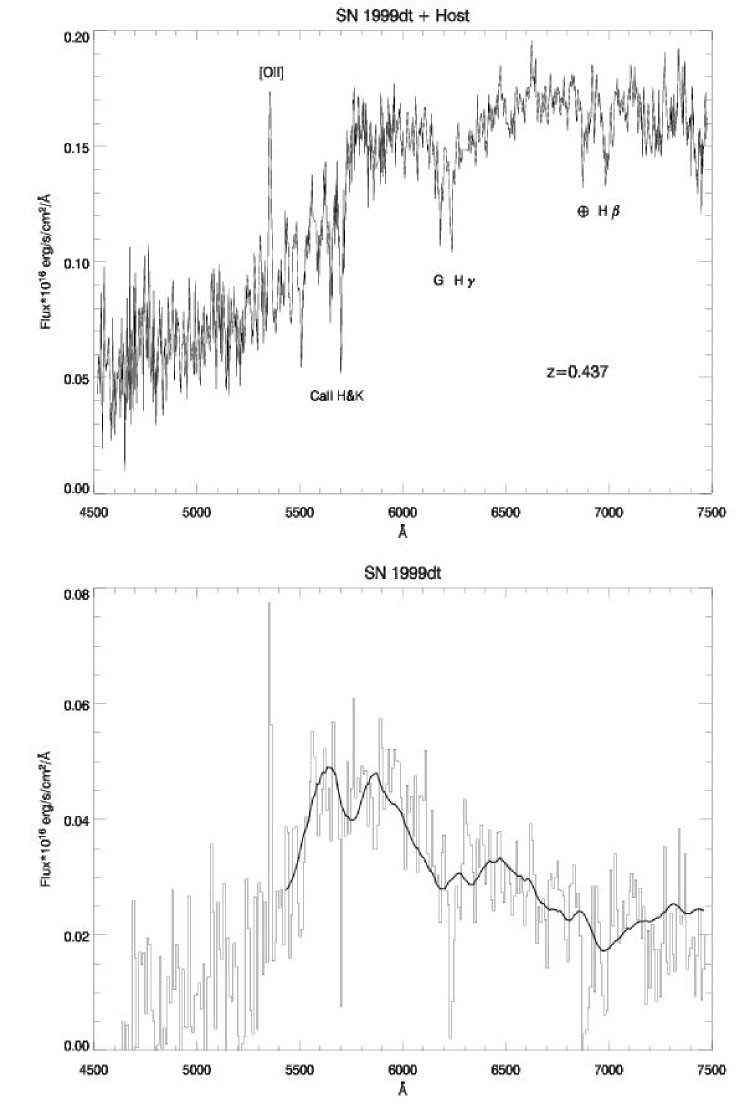
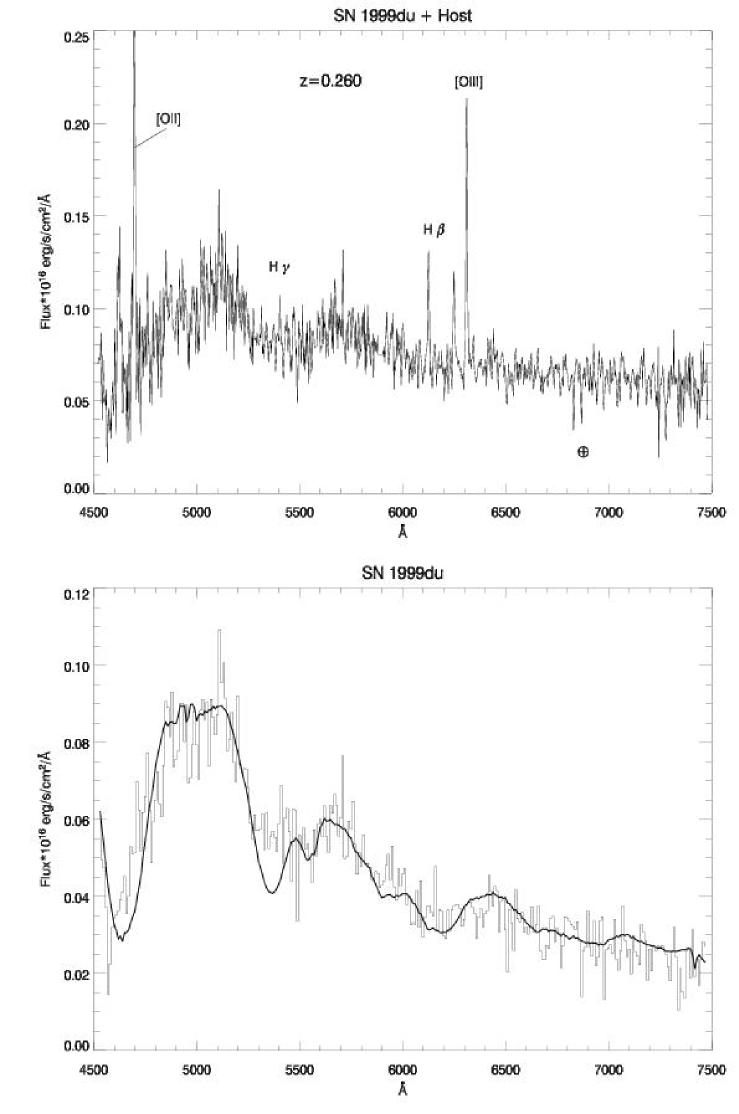
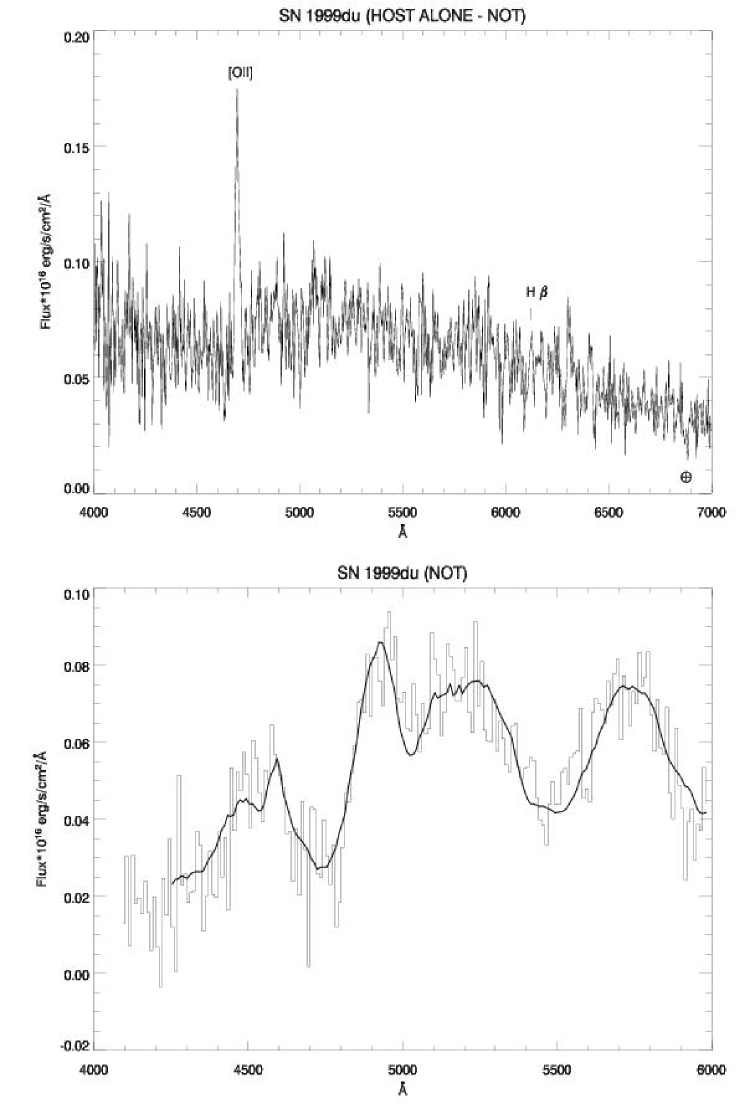
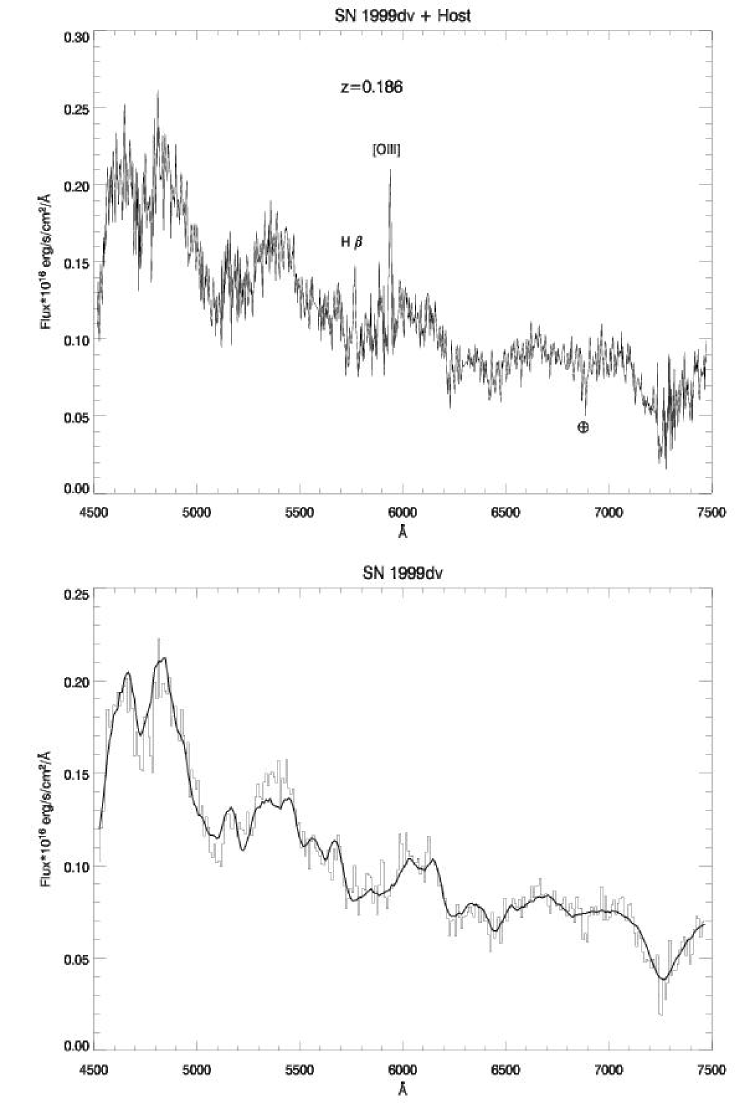
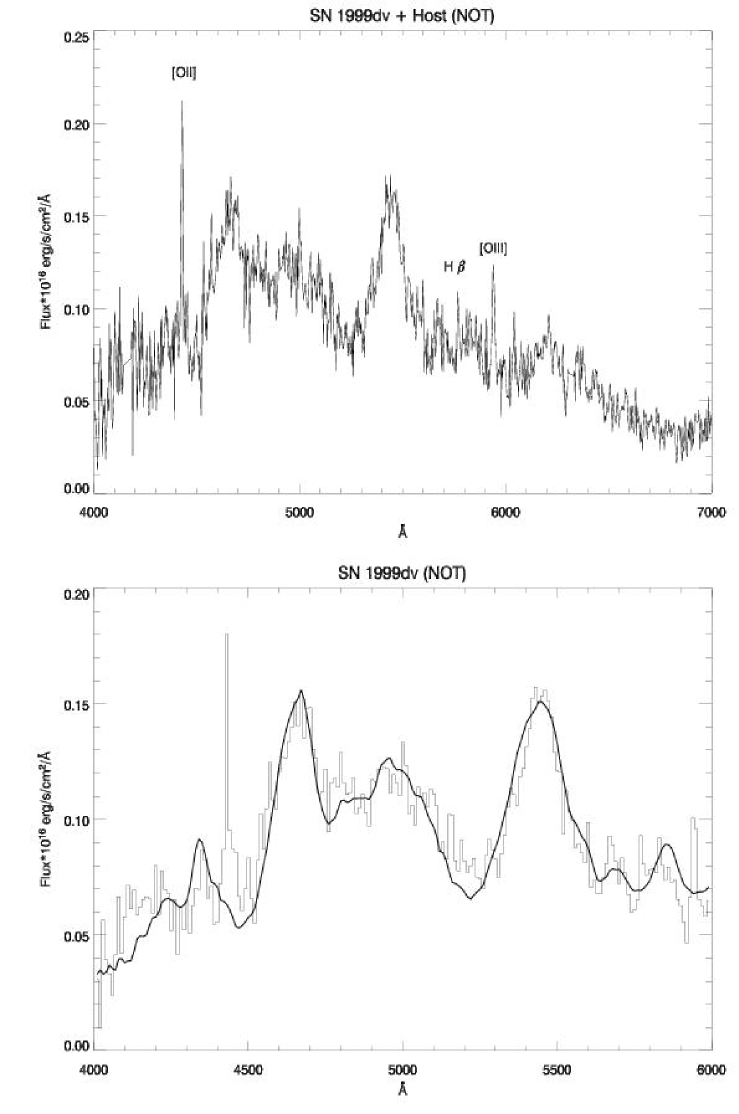
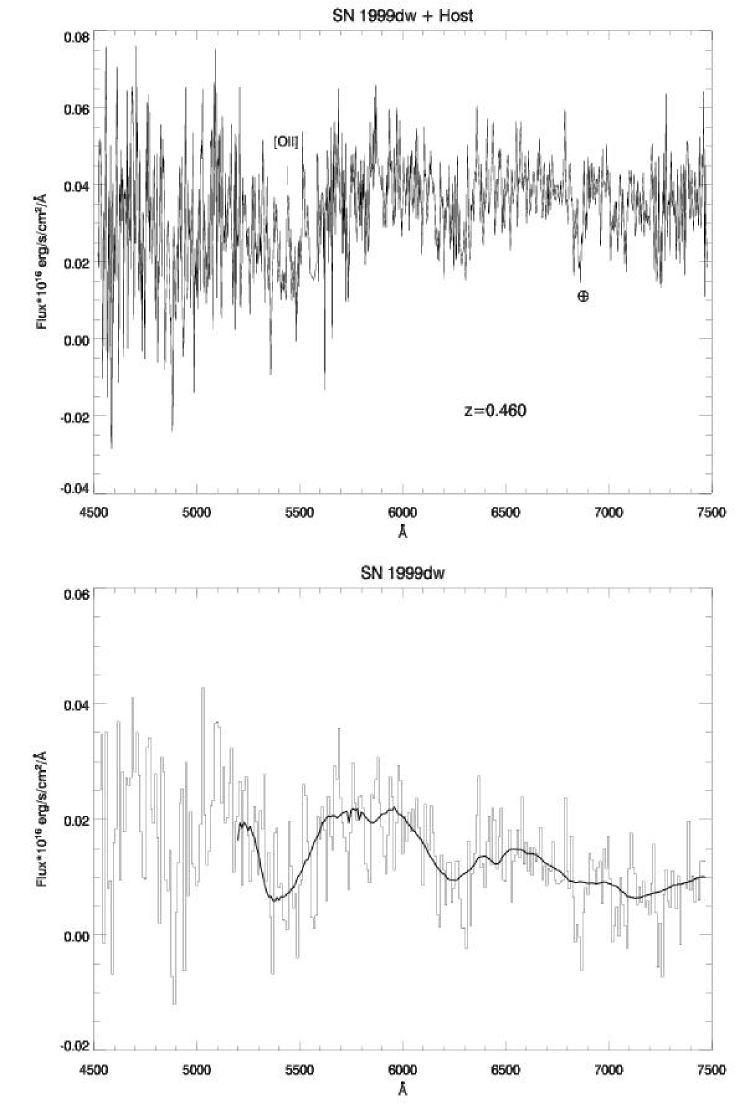
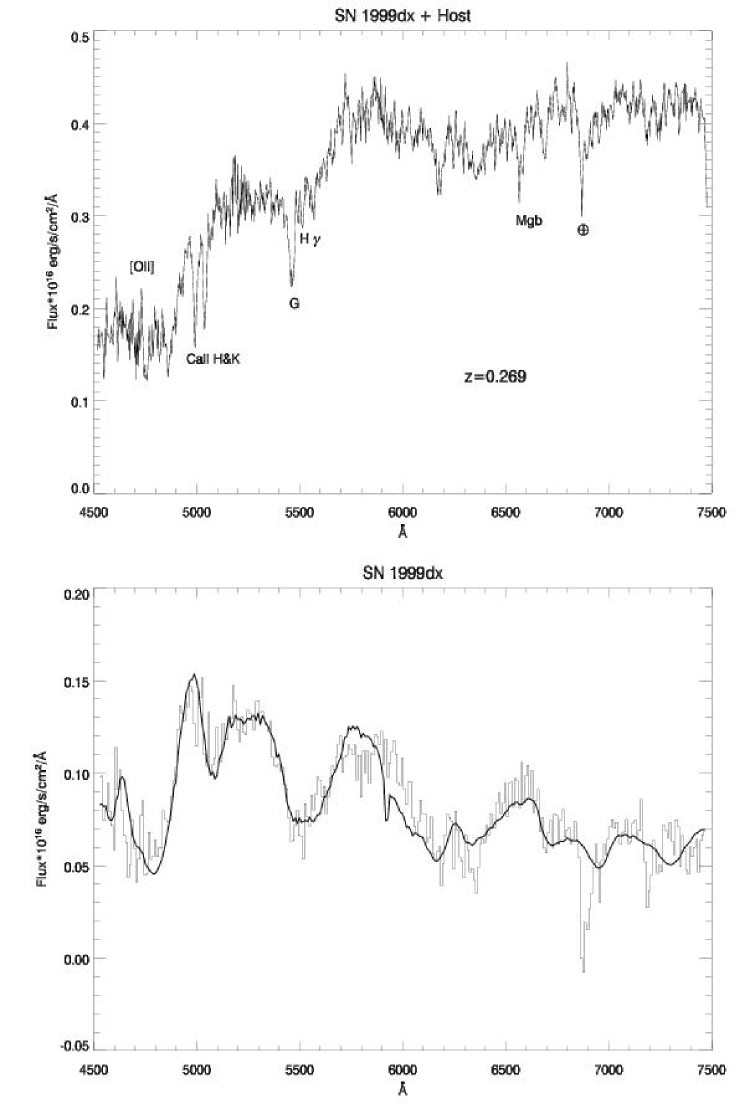
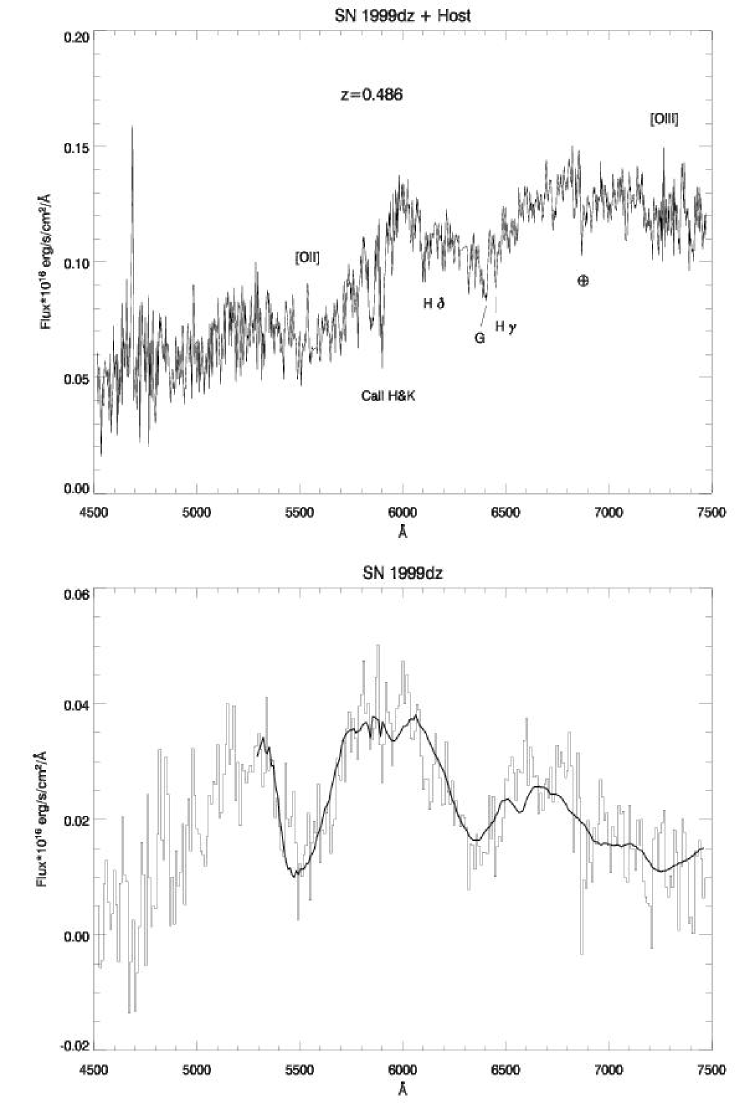
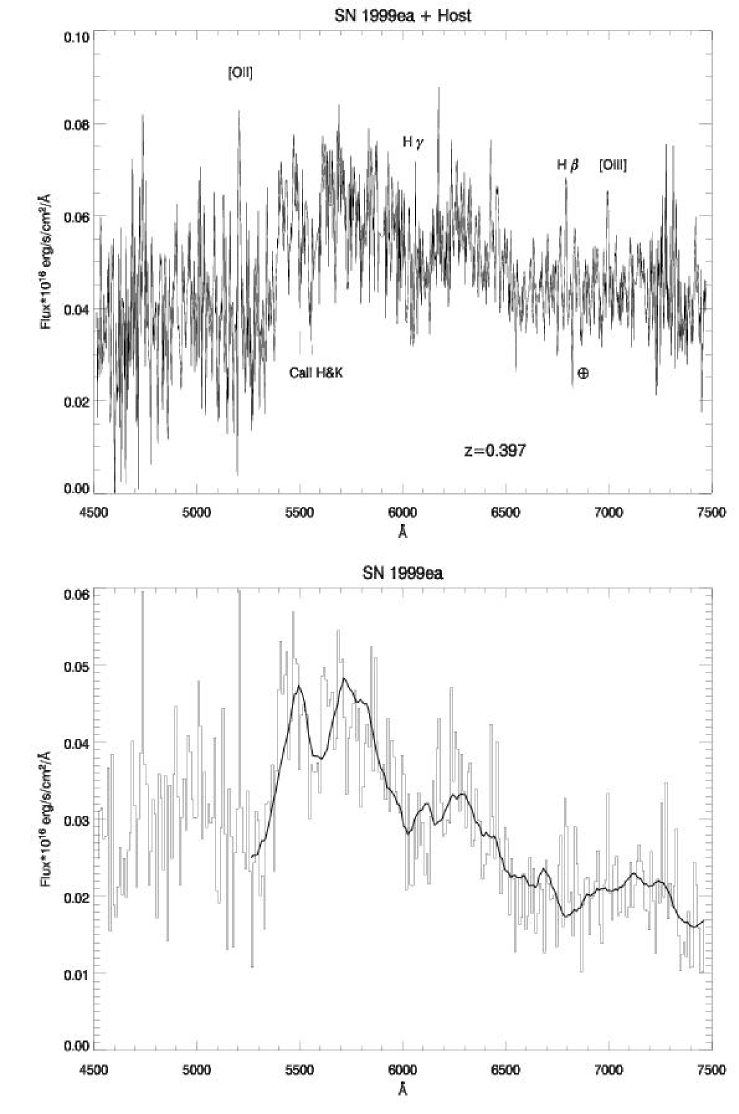
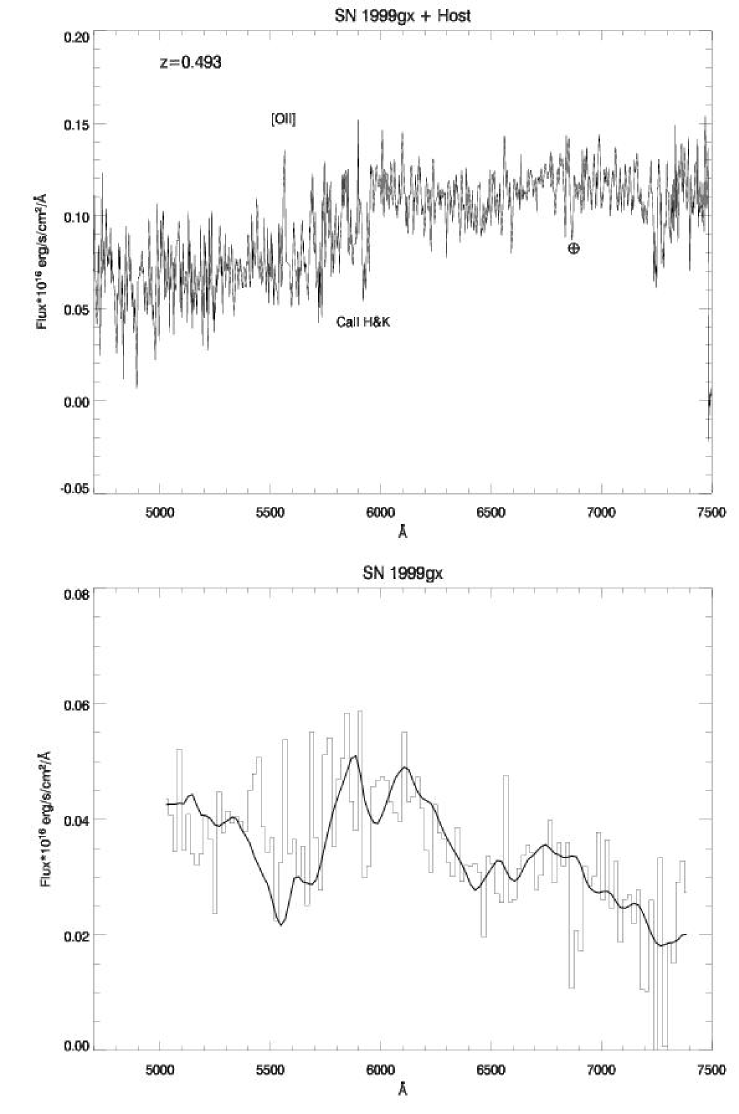
We present in the lower panels of Fig. 2 to Fig. 15 the output spectrum for the 10+2 confirmed supernovae along with the best-fit template overlapped on top of each spectrum. Spectra have been rebinned on 10Å bins for visual convenience. Top panels show the corresponding host + SN spectra, except for SN 1999dr and the NOT spectrum of SN 1999du for which separate extraction of the host galaxy was possible (the galaxy alone is then shown). All spectra are presented in the observer frame. Residual sky lines have been removed ’by hand’, but atmospheric absorptions and galaxy emission/absorption lines are left. Lines used for redshift determination are labeled. The symbols indicate atmospheric absorptions.
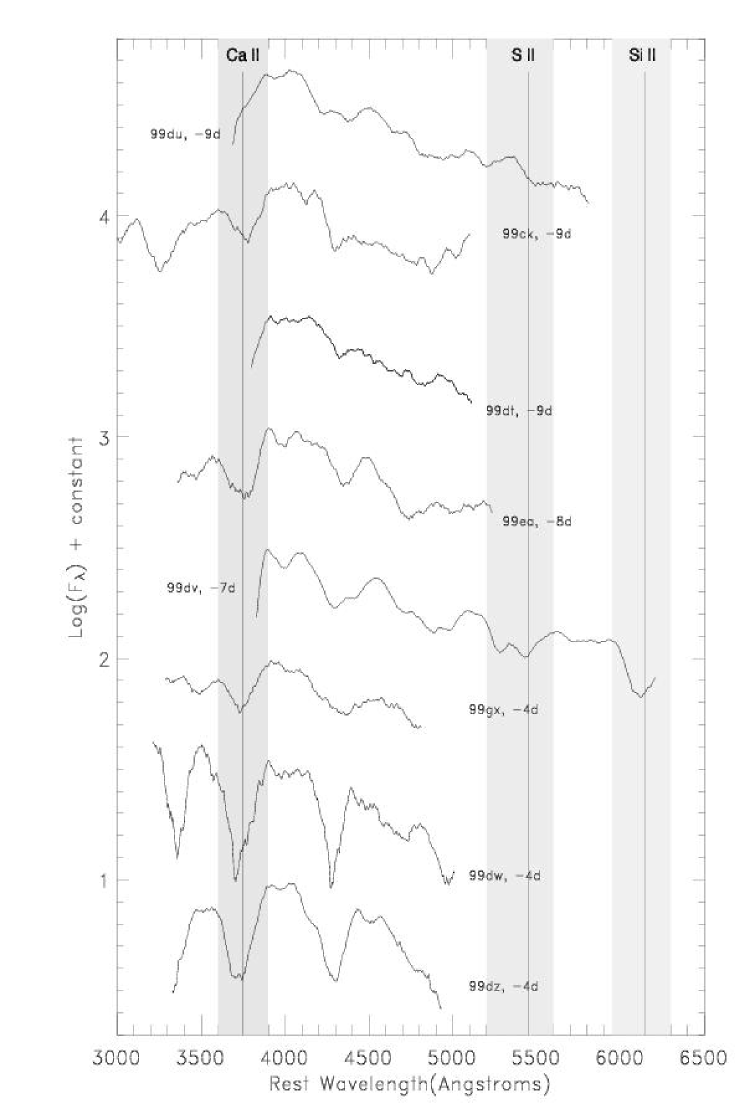
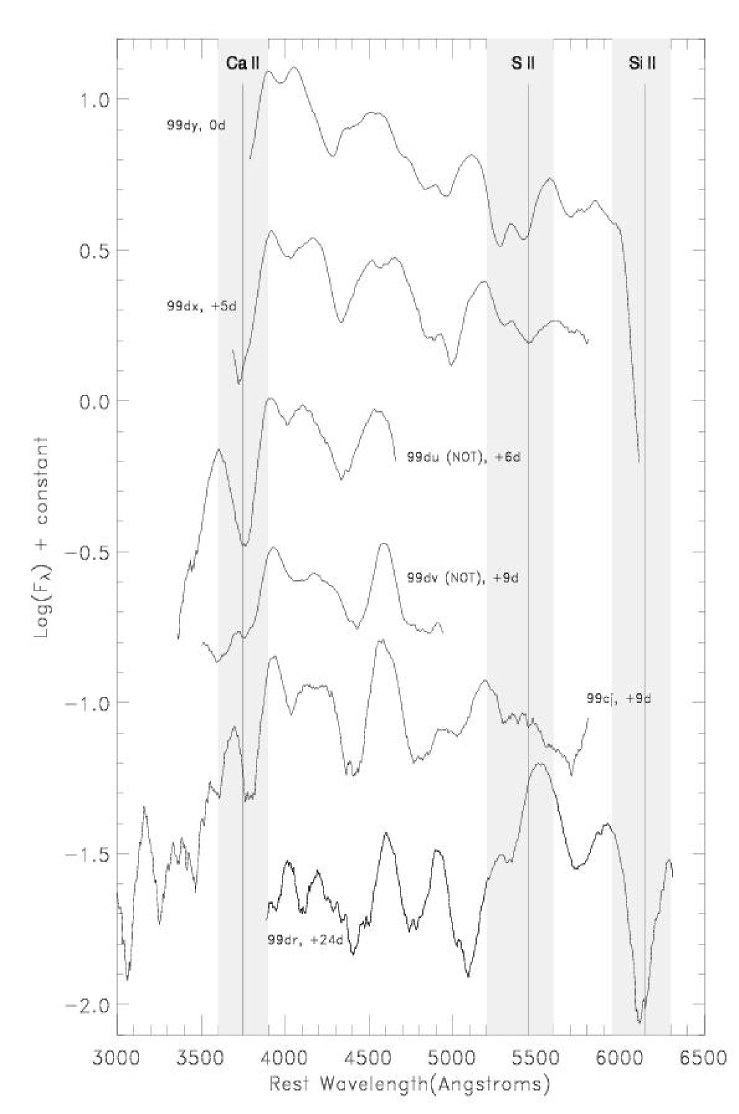
In Fig. 16 and 17, we present the 12 SN classified in order of increasing spectroscopic phase. Figure 16 is for pre-maximum spectra, whereas Fig. 17 shows past-maximum spectra. All spectra are in the restframe. Residual lines resulting from imperfect galaxy subtraction, as well as atmospheric absorption lines have been removed. A polynomial least-squares fit using a Savitsky-Golay smoothing filter of degree 2 with a window width of 60 data points (Press et al., 1992) has been applied to the data. This filter is designed to preserve higher moments within the data and is well suited for supernova spectra. For visual convenience, the spectra are shifted in flux from one another by an arbitrary amount. The three gray vertical bands show the CaII, SII and SiII spectral features expected to be found in ’normal’ SN Ia . In addition, three vertical solid lines indicate the positions of CaII at 3945 Å, SII at 5640 Å and SiII at 6355 Å , blueshifted by 15000 km/s (CaII) and 10000 km/s (SII, SiII). These values are typical of ’normal’ SN Ia at maximum (Benetti et al., 2004) and are shown as a guide to the eye.
Early spectra of ’normal’ SN Ia are usually characterized by the presence of intermediate mass elements such as Si, S and Ca. As the spectrum evolves, they are progressively replaced by features due to iron-peak ions. A strong absorption feature of SiII visible at Å in spectra around maximum light is probably the most discriminant feature against other SN types (Wheeler & Harkness, 1990; Filippenko, 1997; Leibundgut, 2000). However, this feature is only present in two of our spectra (SN 1999dr and SN 1999dv) whereas for all other SN it is redshifted beyond the upper limit of Å even at moderate redshift. Other characteristic features we base our identification on include:
Presence of a W-shape visible around 5500 Å (restframe) due to SII Å
Presence of an absorption feature due to SiII Å. This feature can be weak in over-luminous supernovae of SN 1991T type prior to maximum (Filippenko et al., 1992; Ruiz-Lapuente et al., 1992). It is on the contrary abnormally deep and distorted in under-luminous supernovae like SN 1991bg due to the presence of TiII absorption in the same wavelength region (Li et al., 2001c; Garnavich et al., 2004). Note that for Type Ib/c supernovae, this feature presents a plateau-shape longward of Å up to about Å (Filippenko, 1997; Branch et al., 2002) similarly to its appearance in SN 1991bg-like SNe (Leibundgut et al., 1993; Turatto et al., 1996; Mazzali et al., 1997; Li et al., 2001c).
Presence of a strong absorption due to CaII Å. This feature is not characteristic of SN Ia as it exists as well in other SN types and under-luminous SN Ia . However, it is weak in SN 1991T-like objects prior to maximum light (Li et al., 2001c).
In the following, we briefly describe the extracted spectrum for each supernova.
SN 1999cj: Due to the use of the blue arm, part of the restframe UV is accessible for the two April SN Ia . SN 1999cj (Fig. 2) is at and exhibits features characteristics of a SN Ia well after maximum. The best-fit is obtained with SN 1992A, 9 days past maximum (Kirshner et al., 1993). In particular, suppression of the peak redward of the SiII absorption around Å (restframe) is clearly seen.
SN 1999ck: An early SN Ia at with a UV part from Å restframe (Fig. 3). Bumps and troughs are clearly seen in this part of the spectrum. Best fit obtained with SN 1994D -9 days (Patat et al., 1996).
SN 1999dr: This is a SN Ia at . The host spectrum has been extracted separately from the SN and used as the galaxy component of the fitting model. The supernova spectrum is consistent with a SN Ia (best fit with SN 1994D) at 24 days after maximum light. As spectra have been obtained on September 12th, that places the date of maximum around August 19, 1999 so that the supernova was starting rising when the reference image was taken on August 9. The discovery image was obtained 23 days after the reference. At that date, the flux difference between the reference and the discovery image still permits it to be detected as a light increasing supernova. Even though our detection strategy has been designed to select rising SNe, decreasing SNe can also be found. The aspect of the spectrum (Fig. 4) is typical of a supernova in the photospheric phase a few weeks after maximum, as Fe lines develop and create large troughs in the spectrum. This is clearly seen around Å ( Å restframe) where the large dip is due to a blend of FeII absorption lines. The bump at Å replaces the W-shape due to SII seen in spectra around maximum or earlier.
SN 1999dt: This is the fourth most distant SN of our sample (). The spectrum is strongly dominated by the host galaxy and the host-subtracted spectrum presented has thus a rather poor S/N (see Fig. 5). The best-fit is for an early SN template (SN 1994D -9 days). The three best-fit solutions (in terms of ) all give a ’normal’ SN Ia but the third one differs in phase by 7-8 days with respect to the two others: the best-fit solution is for -9 days while the third one yields a -1 day spectrum template. This ’phase instability’ is not surprising as the spectrum is strongly dominated by the host. Unfortunately, as most of the candidates are detected within 1.5 arcsec of the host center comparable to the seeing, it is not possible to extract separately both components.
SN 1999du: SN 1999du has been observed at WHT on September 12 and at NOT on October 2. Fig. 6 and 7 show the corresponding spectra. For the NOT spectrum (Fig. 7), the wavelength upper limit adopted for the fit is 6000 Å. Indeed, the signal redward of this value is polluted by the presence of the second order spectrum and is practically useless for our fitting purposes. The same remark applies for SN 1999dv. The October 2 spectrum is best fitted by a SN Ia (SN 1992A) 6 days after maximum whereas a SN Ia (SN 1999ee (Hamuy et al., 2002)) at -9 days matches the September 12 spectrum. Taking the September 12 determination at face value, this places the date of maximum light on September 21, while the NOT determination leads to September 26 for maximum. This is marginally consistent given the adopted days of uncertainty in the spectrum phase determination. Correcting for the time dilation effect expected in an expanding universe (Goldhaber et al., 2001; Riess et al., 1997; Foley et al., 2005) gives the date of maximum light on September 23 and September 24 for the WHT and NOT spectra, respectively, a fully consistent result. The host redshift determination agrees for the two spectra, leading to . Note that for the NOT spectrum, the host galaxy has been extracted separately and used to construct the best-fit model, as for SN 1999dr. With this procedure, the fit is performed against the redshift of the supernova alone, not against the redshift of the supernova+galaxy template model, as for the other WHT spectra. This leads to a difference in and of 0.01 (see Table Spectroscopy of twelve Type Ia supernovae at intermediate redshift), the largest difference observed for our sample (along with SN 1999dy). This value can be considered as an upper limit on the precision on the best-fit redshift . If we do not use the observed galaxy and rather use a template galaxy for the fitting model, this redshift discrepancy disappears (we then find ). The best-fit for the WHT spectrum is obtained for a reddened starburst galaxy with E(B-V)=0.4, labeled as ’Stb4’ in our database (Kinney et al., 1996). The same solution is obtained for the NOT spectrum when a galaxy template is used for the fit rather than the observed spectrum. This solution indicates a dusty star-forming galaxy. Indeed, strong emission lines are seen in the full spectrum. Note that excluding these lines from the fit leads to a solution with the same SN template (SN 1992A +6 days) with a slightly lower .
SN 1999dv: As for SN 1999du, both WHT and NOT spectra have been obtained for SN 1999dv and are shown on Fig. 8 and 9. The WHT spectrum is well fitted by a SN Ia - SN 2003du (Anupama et al., 2005) at -7 days, and is only weakly contaminated by its host. The host redshift is , fully consistent with the determination from the NOT host spectrum. This latter spectrum is best fitted by a late SN Ia (SN 1993A) template at +9 days. Using the WHT phase, the maximum date falls on September 20, whereas the NOT phase determination leads to a maximum on September 23. These dates of maximum are consistent within the day uncertainty in the phase determination. Note that the phase difference found between the two observations (16 days) is similar within one day with the difference obtained for SN 1999du (15 days) but is short, by 3 to 4 days, of the real number of days elapsed between the WHT and NOT observations. Correcting for time dilation leads to days difference in the observer frame. As for SN 1999du, this is fully consistent with the actual observing dates.
SN 1999dw: The third most distant SN Ia of our sample at . The spectrum is shown in Fig. 10. It is well fitted by an early template (SN 1999ee days) and exhibits features of a SN Ia at this date. The CaII absorption feature corresponding to Å restframe is clearly visible. Not however that the spectrum seems slightly bluer than other SN Ia at a comparable phase.
SN 1999dx: This is a heavily buried SN Ia at with a host contribution of more 75 % (Fig. 11). The best-fit is obtained for a +5 days SN Ia template (SN 1992A). The fit is poor in the range 5800 - 6200 Å as the template falls below the observed spectrum. Interestingly, this high signal-to-noise supernova yields the poorest best-fit reduced of our sample (). Indeed, the higher the quality of the spectrum (the lower the noise), the more the value reflects discrepancies with the underlying model. This illustrates how our fitting procedure depends on the quality of the underlying model. As explained in §4.2, this is directly connected to the phase sampling and the number of the spectral SN templates in our database.
SN 1999dy: A typical SN Ia at maximum with a high signal-to-noise ratio. The redshift is (from galaxy lines, being significantly lower at around ) . The best fit is obtained with SN 1996X (Salvo et al., 2001) and is very good except around Å where an emission feature is present. Around Å, the spectrum falls below the fit, maybe due to an uncorrected atmospheric absorption feature around this wavelength (Fig. 12).
SN 1999dz: This second most distant SN Ia () is presented in Fig. 13. The fitting procedure yields a large fraction of host galaxy and an early SN Ia (SN 1999ee days). The phase is rather stable when one considers solutions of immediately higher . Due to its fairly high redshift, features blueward to Å (restframe) are visible. Note that the two peaks in the fit spectrum around Å appear blueshifted with respect to the peaks in the observed spectrum. It is difficult to determine whether this discrepancy is due to an intrinsic feature of the supernova. As the galaxy contribution to the fit model is almost 80%, it might be due to galaxy subtraction residuals.
SN 1999ea: This is a SN Ia very similar to SN 1999dz at a lower redshift (). The best fit is obtained for a SN Ia (SN 1994D) at -8 days, again a rather stable phase (Fig. 14).
SN 1999gx: The most distant SN Ia () of our sample (Fig. 15). The SN signal is rather weak and was not identified during the first assessment at the telescope. Re-reduction of the data allowed to extract this distant SN (Balland & Mouchet, 2005) whose spectrum is best fitted by a normal SN Ia template (SN 1994D +6 days).
5.2 Properties of the SN Ia
As far as values are concerned, all the spectra presented in this paper are best fitted with templates of normal SN Ia as opposed to peculiar SN Ia . This is true even for SN 1999gx, even though values are very close (see Table Spectroscopy of twelve Type Ia supernovae at intermediate redshift). Given their signal-to-noise and redshifts, it is possible to compute a few spectral quantities of interest to further characterize these supernovae. This is an important study to perform as little is known about the spectral properties of SN Ia at intermediate redshift and the possible differences with their low-z counterparts. For instance, finding spectral peculiarities in samples at intermediate or high redshift would shed light on the evolution of the ’peculiarity rate’ with redshift (Li et al., 2001c). This might also give some hint of how samples used for the determination of cosmological parameters might be contaminated by peculiar supernovae.
5.2.1 Velocity measurements
Even SN Ia classified as ’Branch normal’ do not form an homogeneous spectral class of objects. For instance, differences in evolution of CaII, SII and SiII absorption lines velocities are found among them (Branch et al., 1988; Hatano et al., 2000; Benetti et al., 2004). SN Ia such as 2002bo or 1984A for instance exhibit rather high velocities or compared to other supernovae considered as ’Branch normal’ (Benetti et al., 2004). This might indicate some degree of peculiarity. However, as more spectra of nearby supernovae are collected and studied, there is evidence that the standard classification in ’normal’, under- or over-luminous objects is far too simple to accurately reflect diversity among supernovae. Benetti et al. (2005) suggest a classification in ’faint’ SNe with high-SiII velocity gradients, ’normal’ SNe, also with high-velocity gradients but with brighter absolute magnitude, and SNe with low velocity gradients. These three classes are related to the progenitor explosion mechanism. In this classification, ’Branch-normal’ SN Ia are found in both the ’faint’ and ’normal’ classes.
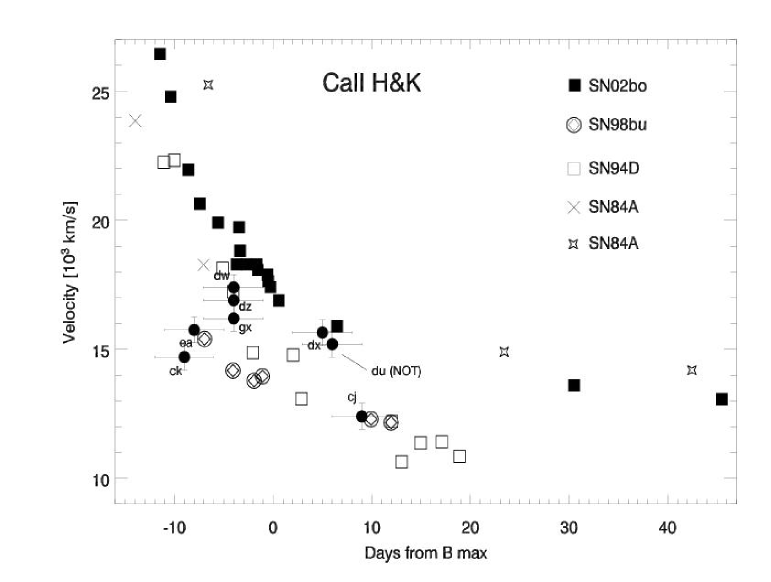
Velocity gradient measurements are unfortunately out of reach for our sample, even for the two SN Ia for which we have spectra on two different dates. CaII, SII and SiII absorption line velocities can be however measured in some cases. Results are shown in Table Spectroscopy of twelve Type Ia supernovae at intermediate redshift. Velocities have been obtained by fitting the corresponding line feature by a gaussian profile. Typically, the error is 500 km/s for Ca and 200 km/s for both SII and SiII velocities. We compare our velocity results to the ones of local supernovae Ia by producing ’velocity vs day from B maximum’ plots following, e.g. Benetti et al. (2004). Figure 18 shows such a plot for the CaII H& K feature. Data points are taken from figure 11 of Benetti et al. (2004) (see references therein). The date from B-maximum is estimated from the best-fit phase of Table Spectroscopy of twelve Type Ia supernovae at intermediate redshift except for 5 SN Ia for which g’ and r’ photometry are available (see discussion below).
Our different measurements are consistent with values for ’Branch normal’ SN Ia . The SiII velocity of SN 1999dr is slightly high, in between the one for SN 1994D and SN 1984A. SN 1999dw, SN 1999dz and SN 1999gx CaII H& K velocities are close to the ones of SN 1994D, while SN 1999dx and SN 1999du are closer to the one of SN 2002bo. SN 1999ea and SN 1999ck CaII velocities are low, however consistent with SN 1998bu velocity. Despite this diversity, there is no hint from velocity measurements that any of our supernovae are peculiar.
5.2.2 Searching for peculiar SN Ia
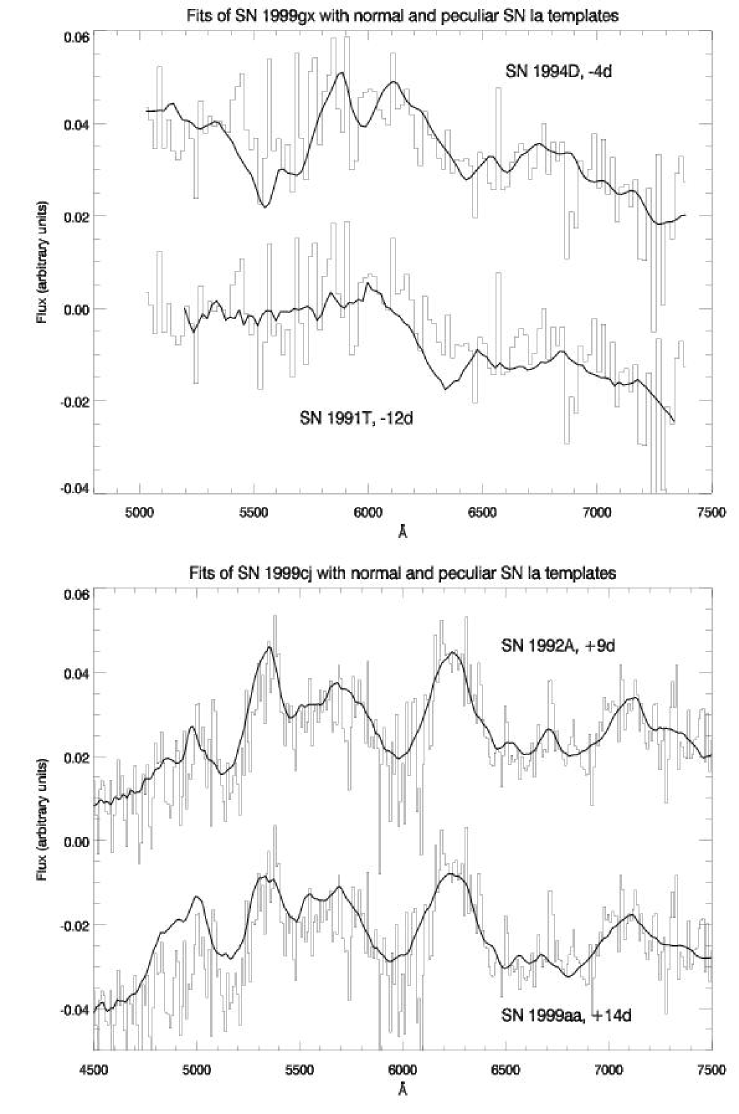
We have used spectral information to search for peculiarities in the SNe of our sample (search for peculiar features in the spectra, measurements of absorption line velocities) and found that all our SN Ia are consistent with being ’normal’ SN Ia . In order to assess the validity of this conclusion, we also fit our spectra with -fit using only the peculiar SN Ia spectral templates available in our database. We dispose of templates for eight peculiar SNe, both under and over-luminous with a similar phase sampling as for ’normal’ SNe Ia. We list the results in Table Spectroscopy of twelve Type Ia supernovae at intermediate redshift. In columns 3 and 4 the best-fit template and phase obtained when fitting with peculiar SN Ia templates are given. The corresponding reduced and number of degrees of freedom (d.o.f.) are presented in columns 5 and 6. For comparison, we also report the same parameters for ’normal’ SN Ia templates from Table Spectroscopy of twelve Type Ia supernovae at intermediate redshift (columns 7 to 9). When fitting with peculiar templates alone, best-fits are systematically obtained for over-luminous SN Ia , as seen in column 3 (templates for SN 1991T are from Mazzali et al. (1995); SN 1999aa from Garavini et al. (2004); SN 2000cx from Li et al. (2001a)). From the comparison of the values in columns 5 and 8, it appears that ’normal’ templates are favored over peculiar templates in all cases. We have performed a F-test to quantify the significance of the corresponding difference. Column 10 gives the probability that the two fits are equivalent. For one SN Ia (SN 1999gx), the ’null hypothesis’ that a solution with a peculiar SN Ia is equivalent to a solution with a ’normal’ one is verified at the level. A clear identification is thus difficult for this object. As seen in Fig. 16, SN 1999gx exhibits shallower absorptions than other SN at comparable phases. This might hint toward a somewhat peculiar supernova, although note that its CaII velocity is normal.
Top panel of Fig. 19 shows the best-fits obtained for SN 1999gx for a ’normal’ and a peculiar solution. For clarity, the ’peculiar’ solution (lower curve) has been shifted in flux by an arbitrary amount. The same graph for SN 1999cj, the supernovae yielding the second highest F-test probability (57%) after SN 1999gx, is shown on the bottom panel. In both cases, visual inspection of Fig. 19 slightly favors the ’normal’ fit over the peculiar, although differences tend to be small.
For other SN Ia , the ’null hypothesis’ is significantly rejected. For SN 1999dv and SN 1999dy, two supernovae for which host contamination is weak, the increases dramatically, which translates in very low F-test probabilities. This strongly supports the hypothesis that they are ’normal’ SN Ia .
5.2.3 SN Ia Phases
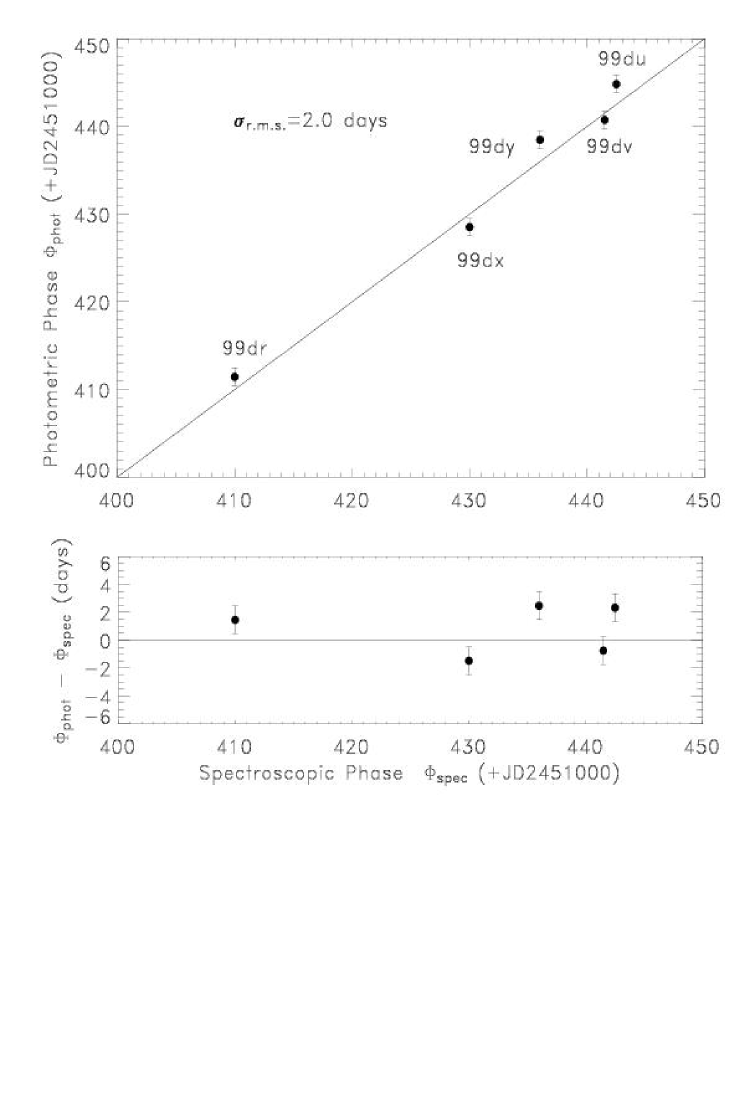
We have argued that the fitting procedure used in this paper allows us to constrain the phase within typically days. We can correlate this ’spectroscopic’ phase with the photometric phase obtained from B-band photometry for five out of the twelve SNe of our sample which have been photometrically followed-up (SN 1999dr, SN 1999du, SN 1999dv, SN 1999dx and SN 1999dy). The photometric phases are derived by constructing and fitting the light-curves for these SNe, as described in our forthcoming paper. Preliminary results are given in Table Spectroscopy of twelve Type Ia supernovae at intermediate redshift. A 1 day error bar on the photometric phase is assigned to each supernova. This value is likely to overestimate the true error as light-curve fitting constrains the date of maximum within a fraction of a day. It however accounts for possible systematics in the photometric analysis. We find good agreement between the photometric and spectroscopic dates of maximum for the subset. When a correction for time dilation is applied, the agreement is even better, except for SN 1999dr. As already mentioned, the spectral phase determination of this SN Ia well after maximum light is likely to be less precise than for other supernovae. Figure 20 shows the photometric phase (column 2 of Table Spectroscopy of twelve Type Ia supernovae at intermediate redshift) as a function of the spectroscopic one (column 3). The rms dispersion is 2.0 days. This is consistent with the days range we adopted for the spectroscopic phase. This value reduces to day if times dilation corrected values are considered (column 5, excluding the uncertain SN 1999dr).
We also compare the phases obtained by fitting peculiar templates (Table Spectroscopy of twelve Type Ia supernovae at intermediate redshift) with the photometric phase for the 5 followed-up September supernovae. The dispersion increases from 2.0 days (’normal’) to 6.5 days (peculiar). Again, this tends to show that these supernovae are ’normal’.
5.3 Host results
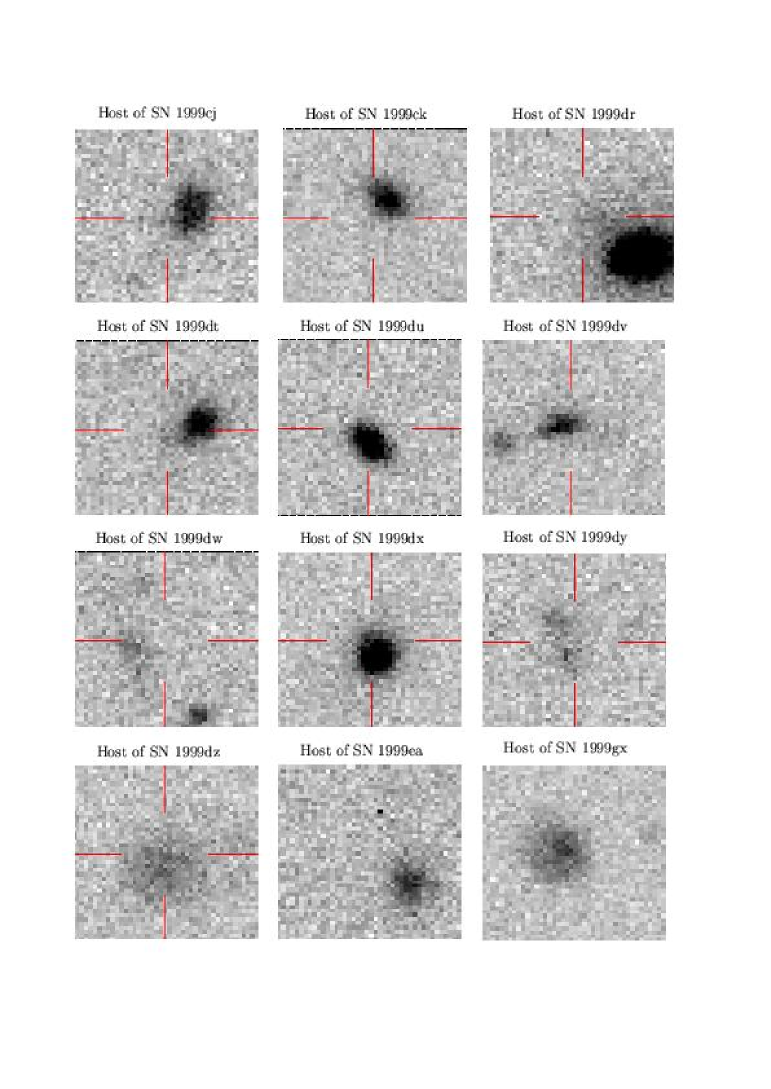
Figure 21 shows WFS reference images of host galaxies of the twelve supernovae presented in this paper. Each vignette is a 0.250.25 square-arcmin g’ image, except for SN 1999cj (B-band image) and SN 1999ck (r’ image). Pixel size is 0.33 arsec. The cross indicates the position where the SN has exploded.
Table Spectroscopy of twelve Type Ia supernovae at intermediate redshift summarizes the host identification for each candidate (cf. Sect. 4.3). The features used for the identification are presented in columns 2 and 3. Specific comments for each galaxy are given in column 4 while in column 5, our best determination for the host type is given. In column 6 we indicate the confidence we have in the identification in the form of an index whose values can be 0 (type unsure), 0.5 (average confidence), or 1 (high confidence). Low confidence in the identification results from a poor signal-to-noise ratio, a fact that usually correlates with a ’high’ redshift and a poor sky subtraction, or with a too low contamination of the supernova by the host. Finally, column 7 gives the ’best-fit type’ given by -fit (see §4.3). It is clear that in most cases, this ’best-fit type’ agrees with the direct identification.
For the sake of completeness, we have also computed u’-g’, B-V and g’-r’ colors for the twelve host galaxies. u’, g’ and r’ magnitudes have been taken from the Sloan Digital Sky Survey (SDSS) on-line catalog. B-V colors have been computed using color equations given by Fukugita et al. (1996). E(B-V) has been computed for each galaxy from the r’ Galactic extinction given in the SDSS catalog and an extinction correction has been applied to all colors. Results are shown in Table Spectroscopy of twelve Type Ia supernovae at intermediate redshift.
These derived color values can then be compared to the galaxy colors computed by Frei & Gunn (1994) for their four Hubble galaxy types (E, Sbc, Scd and Im). To connect this classification to the one we have adopted, we associate their type E to our type 0, Sbc to our type 1 and Scd and Im to our type 2. We assume that a Sa galaxy (type 1 in our classification) has colors falling in between their E and Sbc types. Frei & Gunn (1994) computed galaxy colors using the galaxy energy distributions compiled for each Hubble type by Coleman et al. (1980). Color values are given at four different redshifts ( and 0.6). For the purpose of comparison, we have extrapolated Frei and Gunn’s colors at the redshifts of our hosts, for each Hubble type.
Based on this color comparison, we confirm the identification made from spectra for eight hosts (SN 1999cj, SN 1999ck, SN 1999dr, SN 1999du, SN 1999dv, SN 1999dx, SN 1999dy and SN 1999dz) out of twelve. Two hosts (SN 1999ea and SN 1999gx) have colors marginally consistent with the type derived from their spectra (at least one color does not agree with the spectral type). The colors of SN 1999dt and SN 1999dw hosts are consistent with type 0 (two colors out of three hint toward a 0-type host) while they have been identified as type 1 from their spectra.
6 Discussion
Based on the classification results given in Table Spectroscopy of twelve Type Ia supernovae at intermediate redshift, two out of twelve hosts are identified as type 0, seven as type 1 and three as type 2, corresponding to a fraction of 17%, 58% and 25% of the sample respectively. Although we are limited by the small statistics of our sample, we can compare our results with the host statistics of Sullivan et al. (2003) on two samples of low and high redshift. The low- sample is based on the Calan-Tololo sample (Hamuy et al., 1996) and on the Riess et al. (1999b) local sample. All supernovae in this sample have . The high-redshift sample is based on the 42 SNe of the SCP (Perlmutter et al., 1999) with redshift ranging from to . Our fractions are roughly consistent with the statistics of hosts in the low- sample of Sullivan et al. , who find 12%(0), 56%(1) and 32%(2). In their high- sample, the fraction of E/S0s levels up with early-type spirals whereas the late-type spiral fraction increases: 28%(0), 26%(1) and 46%(2). This trend is not seen in our sample. To check if consistency can be found on a subset of the high- sample with similar average redshift as ours, we have selected the nine hosts with redshift ranging from and with an average redshift of . However, the same trend as for the total high- sample is clearly seen, with even more type 0. As the number of SN Ia of our sample is small, possible misidentification of one host galaxy could significantly change our numbers. If, say, we have classified as type 1 an actually type 0 galaxy (SN 1999dr for example, which has a red u’-g’ color value consistent with the one for type 0), we would get 25%(0), 50%(1) and 25%(2). However, this does not influence the fraction of late-type spirals and we would need to have misclassified one type 2 as, for instance, a type 1 to alleviate the discrepancy. This is rather unlikely as strong emission lines seen in type 2 spectra should be a clear signature. In our sample, these strong emissions only appear for SN 1999du, SN 1999dv and SN 1999dy. Clearly, complementary information as galaxy colors and a larger set of intermediate redshift SN Ia would help to conclude.
Taking into account various biases intrinsic to supernova searches that may affect the peculiarity rate of SN Ia, Li et al. (2001c) find that 369% of nearby SN Ia are peculiar. Contrasting with this result, no peculiar SN Ia have been found in the high- samples of Riess et al. (1998) and Perlmutter et al. (1999). This might indicate evolution with redshift in the SN Ia populations, even though identification of peculiar objects at high redshift is rendered difficult due to insufficient signal-to-noise and potentially severe age-bias: spectral differences between ’normal’ and over-luminous SN Ia tend to vanish after maximum light, which introduces an ’age-bias’ in the detection of such over-luminous SN Ia (Li et al., 2001b, c). Assuming the fraction expected in nearby surveys holds at intermediate redshift, we would expect between 3 and 5 peculiar supernovae in our sample. Our analysis yields peculiar SN Ia similarly to the high- sample. However, magnitude-limited surveys such as ours underestimate the rate of under-luminous SN Ia (SN 1991bg-like objects) as opposed to local surveys which are rather distance-limited. Over-luminous (SN 1991T-like) objects are usually seen in dusty star-forming regions (Li et al., 2001b). Although 0.4 mag brighter than ’normal’ SN Ia , they suffer from heavy extinction and might be under-represented in our sample. Moreover, their detection might be affected by the age-bias. If we assume one of our SN Ia has been incorrectly classified as a ’normal’ (for example, SN 1999cj, SN 1999dr whose spectra have been taken well after maximum, or possibly SN 1999gx), the peculiarity rate in our sample would be %, a value consistent with the 12 % expected for a magnitude-limited survey with a 20 day baseline, with an extra R-band extinction for SN 1991T-like objects of 0.8 mag and an age-bias cutoff of 7 days (Li et al., 2001c).
Following the first results on cosmological parameters based on the observation of distant supernovae, systematic searches for SN Ia have been undertaken on various telescopes and several samples exist today. Although aiming at observing higher redshift SN Ia than ours, they often contain a few SN Ia in the intermediate redshift range and fairly good signal-to-noise spectra have been obtained. Riess et al. (1998) early sample includes five SN Ia in the range , while Perlmutter et al. (1999) have two SN Ia around 0.17. More recently Barris et al. (2004) present spectroscopy for 23 supernovae discovered during the IfA Deep Survey, among which none are in the range . Lidman et al. (2005) find two SN Ia in this redshift range. The large scale program ESSENCE (Matheson et al., 2005) presents nine spectra of SN Ia between 0.15 and 0.3 after two years of systematic searches. Even more recently, discovery of supernovae in the SDSS survey has been reported, among which seven have been identified as SN Ia in the same redshift range (Sako et al., 2005). Including our spectra, the number of SN Ia spectroscopically observed between 0.15 and 0.3 amounts to thirty, all with similar signal-to-noise.
Identification is always based on visual detection of characteristic spectral features such as SiII 6355Å and/or comparison to well observed local SN Ia . This comparison is direct (Riess et al., 1998) or involves a template fitting procedure similar as ours (Barris et al., 2004; Matheson et al., 2005). In Riess et al. (1998), differences between templates and real spectrum are small and are comparable to what we obtain with our set. The fitting result is of poorer quality in Barris et al. (2004) and Matheson et al. (2005), however good enough for the sole purpose of identification of SN Ia features. No galaxy subtraction has been attempted for the ESSENCE spectra, which degrades the visual aspect of the result when the full spectrum is fitted by local SN Ia templates. Note that one out of the nine spectra of the intermediate-redshift subsample of Matheson et al. (2005) shows strong similarities with SN 1991T, whereas all the five SN Ia of the Riess et al. (1998) sample are best compared to ’normal’ SN Ia templates. These results are consistent with our finding of none, or possibly one, peculiar SN Ia in our intermediate redshift sample.
7 Conclusion
We have presented twelve spectra of SN Ia supernovae taken at the William Herschel Telescope and the Nordic Optical Telescope in April, September and October 1999 during a search for SN Ia at intermediate redshifts. Five of these SN have redshifts between . This set provides high signal-to-noise spectra in a still largely unexplored redshift range.
The identification was based on a -minimization using a database of galaxy and SN Ia templates, which allow us to model the observed spectra in a consistent way. Determination of the spectroscopic phase is reliable. Comparison with the photometric phase derived from the light-curves of five SN Ia that have been photometrically followed-up gives an estimated day uncertainty when measuring the phase from the matching to the spectroscopic database.
Spectral analysis shows that most of the objects found during this campaign are clearly spectroscopically ’normal’. The observed spectra are best fitted with templates of local ’normal’ SN Ia, even if the possibility remains that SN 1999gx is a peculiar over-luminous supernova. In that case, it would be the most distant peculiar supernova observed so far. Velocity measurements of characteristic absorption lines such as CaII, SII and SiII are consistent with the same measurements on ’normal’ SN Ia , with SN 1999dr having a slightly higher value than average.
The peculiarity rate in our sample is inconsistent with the rates predicted in local surveys but similar to what is observed in the high- sample of Riess et al. (1998) and Perlmutter et al. (1999). But, although unlikely, possible misidentification of a SN 1991T-like object as a ’normal’ SN Ia in our sample would reconcile observations with the predicted local rate, provided that those objects suffer extra extinction.
We conclude that the physical properties of the intermediate redshift SN Ia presented in this paper are very similar, as far as the spectroscopic analysis is concerned, to the properties of their low and high redshift counterparts.
Acknowledgements.
The observations described in this paper were primarily obtained as visiting/guest astronomers at the INT and WHT, operated by the Royal Greenwich Observatory at the Spanish Observatorio del Roque de los Muchachos of the Instituto de Astrofísica de Canarias, and the Nordic Optical 2.5 m telescope. We thank the dedicated staffs of these observatories for their assistance in pursuit of this project. We also acknowledge G. Altavilla for useful comments on the manuscript and G. Garavini for his help in producing Fig. 18. We thank S. Nobili for providing us with her set of spectral templates. Some of the spectral templates used in -fit database have been kindly provided to us by T. Matheson and A. Filippenko.References
- Aldering et al. (2000) Aldering, G., Knop, R., & Nugent, P. 2000, AJ, 119, 2110
- Anupama et al. (2005) Anupama, G. C., Sahu, D. K., & Jose, J. 2005, A&A, 429, 667
- Astier & Goobar (1999) Astier, P. & Goobar, A. 1999, IAU Circ., 7258, 1
- Balland & Mouchet (2005) Balland, C. & Mouchet, M. 2005, IAU Circ., 8516, 1
- Barris et al. (2004) Barris, B. J., Tonry, J. L., Blondin, S., et al. 2004, ApJ, 602, 571
- Benetti et al. (2005) Benetti, S., Cappellaro, E., Mazzali, P. A., et al. 2005, astro-ph, 0411059
- Benetti et al. (2004) Benetti, S., Meikle, P., Stehle, M., et al. 2004, MNRAS, 348, 261
- Branch (1987) Branch, D. 1987, ApJ, 316, L81
- Branch et al. (2002) Branch, D., Benetti, S., Kasen, D., et al. 2002, ApJ, 566, 1005
- Branch et al. (1988) Branch, D., Drucker, W., & Jeffery, D. J. 1988, ApJ, 330, L117
- Branch et al. (1983) Branch, D., Lacy, C. H., McCall, M. L., et al. 1983, ApJ, 270, 123
- Calzetti et al. (1994) Calzetti, D., Kinney, A. L., & Storchi-Bergmann, T. 1994, ApJ, 429, 582
- Coleman et al. (1980) Coleman, G. D., Wu, C.-C., & Weedman, D. W. 1980, ApJS, 43, 393
- Filippenko (1997) Filippenko, A. V. 1997, ARA&A, 35, 309
- Filippenko et al. (1995) Filippenko, A. V., Barth, A. J., Matheson, T., et al. 1995, ApJ, 450, L11
- Filippenko et al. (1990) Filippenko, A. V., Porter, A. C., & Sargent, W. L. W. 1990, AJ, 100, 1575
- Filippenko et al. (1992) Filippenko, A. V., Richmond, M. W., Matheson, T., et al. 1992, ApJ, 384, L15
- Foley et al. (2005) Foley, R. J., Filippenko, A. V., E., Leonard, D., et al. 2005, astro-ph, 0504481
- Frei & Gunn (1994) Frei, Z. & Gunn, J. E. 1994, AJ, 108, 1476
- Fukugita et al. (1996) Fukugita, M., Ichikawa, T., Gunn, J. E., et al. 1996, AJ, 111, 1748
- Garavini et al. (2004) Garavini, G., Folatelli, G., Goobar, A., et al. 2004, AJ, 128, 387
- Garnavich et al. (2004) Garnavich, P. M., Bonanos, A. Z., Krisciunas, K., et al. 2004, ApJ, 613, 1120
- Goldhaber et al. (2001) Goldhaber, G., Groom, D. E., Kim, A., et al. 2001, ApJ, 558, 359
- Hamuy et al. (2002) Hamuy, M., Maza, J., Pinto, P. A., et al. 2002, AJ, 124, 417
- Hamuy et al. (1996) Hamuy, M., Phillips, M. M., Suntzeff, N. B., et al. 1996, AJ, 112, 2408
- Hamuy et al. (2001) Hamuy, M., Pinto, P. A., Maza, J., et al. 2001, ApJ, 558, 615
- Hardin (1999) Hardin, D. 1999, IAU Circ., 7207, 3
- Hardin et al. (1999) Hardin, D., Walton, N. A., Ellis, R. S., et al. 1999, IAU Circ., 7182, 1
- Harkness et al. (1987) Harkness, R. P., Wheeler, J. C., Margon, B., et al. 1987, ApJ, 317, 355
- Hatano et al. (2000) Hatano, K., Branch, D., Lentz, E. J., et al. 2000, ApJ, 543, L49
- Horne (1986) Horne, K. 1986, PASP, 98, 609
- Howarth (1983) Howarth, I. D. 1983, MNRAS, 203, 301
- Howell et al. (2002) Howell, D. A., Wang, L., Supernova Cosmology Project Collaboration, & Supernova Factory Collaboration. 2002, Bulletin of the American Astronomical Society, 34, 1256
- Jha et al. (1999) Jha, S., Garnavich, P. M., Kirshner, R. P., et al. 1999, ApJS, 125, 73
- King (1985) King, D. 1985, ING Tech Note No 31
- Kinney et al. (1996) Kinney, A. L., Calzetti, D., Bohlin, R. C., et al. 1996, ApJ, 467, 38
- Kirshner et al. (1993) Kirshner, R. P., Jeffery, D. J., Leibundgut, B., et al. 1993, ApJ, 415, 589
- Leibundgut (2000) Leibundgut, B. 2000, A&A Rev., 10, 179
- Leibundgut et al. (1991) Leibundgut, B., Kirshner, R. P., Filippenko, A. V., et al. 1991, ApJ, 371, L23
- Leibundgut et al. (1993) Leibundgut, B., Kirshner, R. P., Phillips, M. M., et al. 1993, AJ, 105, 301
- Li et al. (2001a) Li, W., Filippenko, A. V., Gates, E., et al. 2001a, PASP, 113, 1178
- Li et al. (2001b) Li, W., Filippenko, A. V., & Riess, A. G. 2001b, ApJ, 546, 719
- Li et al. (2001c) Li, W., Filippenko, A. V., Treffers, R. R., et al. 2001c, ApJ, 546, 734
- Li et al. (1999) Li, W. D., Qiu, Y. L., Qiao, Q. Y., et al. 1999, AJ, 117, 2709
- Lidman et al. (2005) Lidman, C., Howell, D. A., Folatelli, G., et al. 2005, A&A, 430, 843
- Matheson et al. (2005) Matheson, T., Blondin, S., Foley, R. J., et al. 2005, AJ, 129, 2352
- Matheson et al. (2000) Matheson, T., Filippenko, A. V., Ho, L. C., Barth, A. J., & Leonard, D. C. 2000, AJ, 120, 1499
- Matheson et al. (2001) Matheson, T., Filippenko, A. V., Li, W., Leonard, D. C., & Shields, J. C. 2001, AJ, 121, 1648
- Mazzali et al. (1997) Mazzali, P. A., Chugai, N., Turatto, M., et al. 1997, MNRAS, 284, 151
- Mazzali et al. (1995) Mazzali, P. A., Danziger, I. J., & Turatto, M. 1995, A&A, 297, 509
- Mazzali et al. (1993) Mazzali, P. A., Lucy, L. B., Danziger, I. J., et al. 1993, A&A, 269, 423
- McMahon et al. (2001) McMahon, R. G., Walton, N. A., Irwin, M. J., et al. 2001, New Astronomy Review, 45, 97
- Meikle et al. (1996) Meikle, W. P. S., Cumming, R. J., Geballe, T. R., et al. 1996, MNRAS, 281, 263
- Nobili et al. (2003) Nobili, S., Goobar, A., Knop, R., & Nugent, P. 2003, A&A, 404, 901
- Nugent et al. (2002) Nugent, P., Kim, A., & Perlmutter, S. 2002, PASP, 114, 803
- Patat et al. (1996) Patat, F., Benetti, S., Cappellaro, E., et al. 1996, MNRAS, 278, 111
- Patat et al. (2001) Patat, F., Cappellaro, E., Danziger, J., et al. 2001, ApJ, 555, 900
- Perlmutter et al. (1999) Perlmutter, S., Aldering, G., Goldhaber, G., et al. 1999, ApJ, 517, 565
- Perlmutter et al. (1997) Perlmutter, S., Gabi, S., Goldhaber, G., et al. 1997, ApJ, 483, 565
- Phillips et al. (1987) Phillips, M. M., Phillips, A. C., Heathcote, S. R., et al. 1987, PASP, 99, 592
- Phillips et al. (1992) Phillips, M. M., Wells, L. A., Suntzeff, N. B., et al. 1992, AJ, 103, 1632
- Press et al. (1992) Press, W. H., Flannery, B. P., Teulkolsky, S. A., & Vetterling, W. T. 1992, Cambridge U. Press, New York, N.Y.
- Pun et al. (1995) Pun, C. S. J., Kirshner, R. P., Sonneborn, G., et al. 1995, ApJS, 99, 223
- Richardson et al. (2002) Richardson, D., Thomas, R., Casebeer, D., Branch, D., & Baron, E. 2002, Bulletin of the American Astronomical Society, 34, 1205
- Riess et al. (1998) Riess, A. G., Filippenko, A. V., Challis, P., et al. 1998, AJ, 116, 1009
- Riess et al. (1997) Riess, A. G., Filippenko, A. V., Leonard, D. C., et al. 1997, AJ, 114, 722
- Riess et al. (1999a) Riess, A. G., Filippenko, A. V., Li, W., & Schmidt, B. P. 1999a, AJ, 118, 2668
- Riess et al. (1999b) Riess, A. G., Kirshner, R. P., Schmidt, B. P., et al. 1999b, AJ, 117, 707
- Riess et al. (2004) Riess, A. G., Strolger, L., Tonry, J., et al. 2004, ApJ, 607, 665
- Ruiz-Lapuente et al. (1992) Ruiz-Lapuente, P., Cappellaro, E., Turatto, M., et al. 1992, ApJ, 387, L33
- Sainton (2004a) Sainton, G. 2004a, PhD thesis, Université Claude Bernard, Lyon 1
- Sainton (2004b) Sainton, G. 2004b, in Exploring the Universe Contents and Structures of the Universe, Proc. of Moriond Conf.
- Sako et al. (2005) Sako, M., Romani, R., Frieman, J., et al. 2005, astro-ph, 0504455
- Salvo et al. (2001) Salvo, M. E., Cappellaro, E., Mazzali, P. A., et al. 2001, MNRAS, 321, 254
- Sullivan et al. (2003) Sullivan, M., Ellis, R. S., Aldering, G., et al. 2003, MNRAS, 340, 1057
- Turatto et al. (1996) Turatto, M., Benetti, S., Cappellaro, E., et al. 1996, MNRAS, 283, 1
- Turatto et al. (1998) Turatto, M., Piemonte, A., Benetti, S., et al. 1998, AJ, 116, 2431
- Walton et al. (1999) Walton, N. A., Irwin, M., McMahon, R., & Lewis, J. R. 1999, The Newsletter of the Isaac Newton Group of Telescopes (ING Newsl.), issue no. 1, p. 3-5, 1, 3
- Wheeler & Harkness (1990) Wheeler, J. C. & Harkness, R. P. 1990, Reports of Progress in Physics, 53, 1467

[l]cccccccccc
Log of the Spectroscopic Observations
SN RA Dec. UT Date [R] or g’ UT Date of Telescope/ Grating/ Dispersion Slit (arcsec)/
(2000) (2000) of Discovery mag Spectroscopy Instrument Grism (Å/pix) Par. angle
\endfirsthead1999cj 10 14 02.46 - 0 14 34.0∗ Apr 17 [19.2] Apr 19 WHT/ISIS R158B,R158R 1.6/2.9 1.0/no
1999ck 14 08 56.59 - 0 05 50.7 Apr 16 [21.9] Apr 19 WHT/ISIS R158B,R158R 1.6/2.9 1.0/yes
1999dr 23 00 17.56 - 0 05 12.5 Sep 1 22.1 Sep 12 WHT/ISIS R158R 2.9 1.5/no
1999dt 00 45 42.29 + 0 03 22.2 Sep 4 23.5 Sep 12 WHT/ISIS R158R 2.9 1.5/no
1999du 01 07 05.94 - 0 07 53.8 Sep 8 22.8 Sep 12 WHT/ISIS R158R 2.9 1.5/yes
1999du “ “ “ “ Oct 2 NOT/ALFOSC #4 3.0 2.5/yes
1999dv 01 08 58.96 + 0 00 24.8 Sep 9 21.8 Sep 13 WHT/ISIS R158R 2.9 1.5/yes
1999dv “ “ “ “ Oct 2 NOT/ALFOSC #4 3.0 1.0/yes
1999dw 01 22 52.80 - 0 16 20.8 Sep 7 24.1 Sep 12 WHT/ISIS R158R 2.9 1.5/no
1999dx 01 33 59.45 + 0 04 15.3 Sep 8 22.2 Sep 14 WHT/ISIS R158R 2.9 1.5/no
1999dy 01 35 49.53 + 0 08 38.3 Sep 8 21.7 Sep 14 WHT/ISIS R158R 2.9 1.5/no
1999dz 01 37 03.24 + 0 01 57.9 Sep 8 23.4 Sep 13 & 14 WHT/ISIS R158R 2.9 1.5/yes
1999ea 01 47 26.09 - 0 02 07.2 Sep 9 23.3 Sep 13 WHT/ISIS R158R 2.9 1.5/no
1999gx 00 34 15.47 + 00 04 26.2 Sep 6 23.3 Sep 13 WHT/ISIS R158R 2.9 1.5/yes
Notes:
† Approximate magnitude at discovery
‡ Parallactic Angle
∗ Note that, due to a typographic
mistake, the dec. for SN 1999cj differs by 31.5” from the value given in Hardin et al. (1999)
[c]ccccccccc
Results from -fit
SN Telescope Best fit SN % (host)† Spectroscopic Reduced d.o.f.∗
name template (reference) phase‡
1999cj WHT 92A (Kirshner et al. 1993) 31(Bulge) 0.355 0.362 +9 1.00 859
1999ck WHT 94D (Patat et al. 1996) 48(Sa) 0.434 0.432 -9 1.17 502
1999dr1 WHT 94D (Patat et al. 1996) 48(own galaxy) 0.174 0.178 +24 0.95 935
1999dt WHT 94D (Patat et al. 1996) 80(Sb) 0.438 0.437 -9 1.24 623
1999du2 WHT 99ee (Hamuy et al. 2002) 65(Stb4) 0.258 0.260 -9 0.87 853
1999dv WHT 03du (Anupama et al. 2005) 11(Stb1) 0.177 0.186 -7 0.99 936
1999dw WHT 99ee (Hamuy et al. 2002) 63(Sa) 0.464 0.460 -4 0.75 705
1999dx WHT 92A (Kirshner et al. 1993) 77(S0) 0.270 0.269 +5 1.66 935
1999dy WHT 96X (Salvo et al. 2001) 23(Sb) 0.202 0.215 0 1.14 934
1999dz WHT 99ee (Hamuy et al. 2002) 79(Sb) 0.480 0.486 -4 1.17 671
1999ea WHT 94D (Patat et al. 1996) 42(Sa) 0.398 0.397 -8 1.12 697
1999gx WHT 94D (Patat et al. 1996) 64(Sa) 0.487 0.493 -4 0.93 871
1999du1 NOT 92A (Kirshner et al. 1993) 28(own galaxy) 0.250 0.260 +6 0.81 572
1999dv NOT 92A (Kirshner et al. 1993) 6(Sc) 0.181 0.186 +9 1.15 637
Notes:
† %(host) = (see text)
‡ Typical error is days
∗ Number of degrees of freedom
1 The observed galaxy has been used
for the fit
2 Best solution when emission lines are
ignored: 99ee -9 days, 39% (Sb), =0.261, reduced , d.o.f.=936
[c]ccccc
SN line velocities
SN Telescope
1999cj WHT -12400
1999ck WHT -14700
1999dr WHT -10350
1999dt WHT
1999du WHT
1999dv WHT -11200 -11300
1999dw WHT -17400
1999dx WHT -15650 -9850
1999dy WHT -11500
1999dz WHT -16900
1999ea WHT -15750
1999gx WHT -16200
1999du NOT -15200
Notes:
a Ca H& K in km/s;
typical error is 500 km/s
b SII in km/s; typical error is 200 km/s
c SiII in km/s; typical error is 200 km/s
[c]cccccccccc
Results from-fit using peculiar SN Ia templates
SN Telescope Peculiar
Normal
F-test
—————————————— —————————– probability (%)
Best-fit Phase d.o.f. Phase d.o.f.
1999cj WHT 99aa1 +14 1.025 859 +9 1.005 859 57
1999ck WHT 99aa -7 1.309 533 -9 1.171 502 1.9
1999dr WHT 00cx2 +30 1.100 900 +24 0.949 935
1999dt WHT 99aa -7 1.523 667 -9 1.245 623
1999du WHT 99aa -7 0.945 894 -9 0.867 853 1.7
1999dv WHT 99aa -7 1.443 833 -7 0.994 436
1999dw WHT 99aa -7 0.764 643 -4 0.746 705 52
1999dx WHT 99aa -3 1.825 935 +5 1.654 935 0.4
1999dy WHT 99aa -3 2.508 932 0 1.136 934
1999dz WHT 00cx -3 1.263 563 -4 1.169 971 0.8
1999ea WHT 99aa -11 1.321 804 -8 1.117 697
1999gx WHT 91T3 -12 0.939 674 -4 0.938 794 97
1999du NOT 00cx +14 0.883 336 +6 0.812 572 2.7
1999dv NOT 99aa +14 1.429 542 +9 1.153 637 4
Notes:
1 Spectral template from Garavini et al. (2004)
2 Spectral template from Li et al (2001c)
3 Spectral template from Mazzali et. al. (1995)
[c]cccccc
Spectral and light-curve dates of maximum for the five photometrically followed-up SN Ia
SN HJD(civil date) Uncorrected maximum date Corrected maximum date
————————————— —————————————
WHT NOT WHT NOT
1999dr 2451411.45 (20/8) 19/8 … 14/8 …
1999du 2451444.83 (23/9) 21/9 26/9 23/9 24/9
1999dv 2451440.75 (19/9) 20/9 23/9 21/9 21/10
1999dx 2451428.52 (07/9) 09/9 … 08/9 …
1999dy 2451438.47 (16/9) 14/9 … 14/9 …
Notes:
Date of B-band light-curve maximum
Date estimated from the date of
spectral observation corrected for the best-fit spectral phase
Date estimated from the date of
spectral observation corrected for the best-fit spectral phase. Correction for time
dilation effects has been applied
[c]ccccccc
SN host spectral classification.
SN T3850† Other Comments Host Spectral Confidence
-fit
indicators∗ type‡ index
1999cj - [OII], s. Mgb red, likely E/S0 0 0.5 Bulge
1999ck - s. [OII], w. H, w. [OIII] poor gal. signal 1 0.5 Sa
1999dr n. s. H, K; B4000; s. Mgb no emission 1 0.5 Own gal.
1999dt n. s. [OII]; s. H, K; B4000; s. H Sa/Sb 1 1 Sb
1999du - s. [OII], H, [OIII] clear ident. Sc 2 1 Stb
1999dv - s. H, [OIII] poor gal. signal 2 0.5 Stb
1999dw - w. [OII] poor S/N 1 0 Sa
1999dx y. s. H, K; B4000; w. [OII]; w H clear ident. E/S0 0 1 S0
1999dy - [OII]; [OIII] faint 2 0.5 Sb
1999dz n. w. [OII]; H, K likely Sa/Sb 1 0.5 Sb
1999ea n. s. [OII]; [OIII]; H; H, K Sa/Sb 1 1 Sa
1999gx - [OII]; H, K Sa/Sb 1 0.5 Sa
Notes:
† T3850=3850Å CN trough present: y.=yes, n.= no; - = not identified
‡ Type 0: spheroidal (E/S0); Type 1: early-type spiral (Sa/Sb); Type 2: late-type spiral (Sc/Starburst)
∗ B4000=4000Å break, s.=strong, w.=weak
⋆ High confidence: =1; Average confidence: =0.5; Low confidence: =0
[c]ccccc
Extinction Corrected Host Galaxy SDSS Colors
SN E(B-V) B-V g’-r’ u’-g’
1999cj 0.035 1.53 1.38 2.12
1999ck 0.04 1.33 1.16 0.74
1999dr 0.06 1.31 1.15 2.12
1999dt 0.015 1.53 1.38 3.05
1999du 0.03 0.72 0.53 0.45
1999dv 0.035 0.67 0.47 1.02
1999dw 0.04 1.67 1.53 3.05
1999dx 0.04 1.59 1.44 2.69
1999dy 0.03 0.88 0.70 0.25
1999dz 0.04 1.62 1.47 1.39
1999ea 0.035 1.03 0.85 1.22
1999gx 0.02 1.18 1.01 0.86
Appendix A -fit spectral database
A total of 242 spectral templates have been collected from various sources into the -fit database used for the analysis of the spectra presented in this paper. These include 167 type Ia spectra (both ’normal’ and peculiar222Peculiar Ia include 91bg-like and 91T-like SN Ia ), 64 type Ib/c and II spectra and 11 galaxy spectra. Most of the type Ia and type II templates originate from the Asiago Catalog333http://web.pd.astro.it/supern/ and have been retrieved from the SUSPECT444http://bruford.nhn.ou.edu/suspect/ database (Richardson et al. 2002) with the exception of SN 1981B, SN 1992A, as well as some spectra of SN 1990N and SN 1991T. Most type Ib/c templates are from Matheson (private communication and Matheson et al. (2001)). Galaxy templates are taken from Kinney et al. (1996) and cover a large spectral range (from 1200 to 10000 Å). Morphological types include bulge, E, S0, Sa, Sb, Sc, and starbursts (Stb) with various amount of reddening (Calzetti et al. 1994; Kinney et al. 1996).
The selected supernova spectra have: i) a large wavelength coverage in the visible - typically 4000 to 8000 Å restframe, ii) a good signal to noise, iii) a continuous energy distribution in the wavelength range considered (templates with gaps in their energy distribution have been discarded). All spectra have been de-redshifted and de-reddened when necessary. The spectra phases cover the range -15,45 days - with respect to maximum light - as uniformly as possible. A few later phase spectra (phase greater than 45 days) have been included to the database for peculiar SN Ia (4 spectra) and Ib/Ic/II (8 spectra). Table A and A show the supernova templates available in -fit database along with the corresponding number of spectra, for type Ia and Ib/Ic/II respectively.
The phase coverage of SN Ia and SN Ib/Ic/II templates available in the database is shown as histograms in Fig. 22 and 23. The phase ranges from -15 to +45 days. Note however that the total number of spectra indicated in the figures takes into account the spectral templates with phases greater than 45 days, which are not shown here.
In Fig. 22, both the phase distribution for ’normal’ SN Ia (top panel) and peculiar SN Ia (91bg-like SN Ia : middle panel; 91T-like SN Ia : bottom panel) are shown. Phases for normal SN Ia templates are uniformly spread between -15 and 40 days, except for a gap of three days after day 20. This gap will be filled in the future as more spectra of low-redshift supernovae become available. Note also the absence of spectra at day -12.
91bg-like SN Ia templates are found mostly around maximum. The sampling is smooth between -5 and +8 days, with the exception of day -2 for which templates are missing. No template is available between day 9 and day 15. The distribution of 91T-like SN Ia templates peaks a few days before maximum. Note the absence of spectra at days 2, 3 and 4. After day +11, the sampling is scarcer with a phase resolution of 2 days up to about day 30.
For completeness, we also show in Fig. 23 the phase distribution for type Ib/Ic and II. It can be seen that spectral phases for these types are best represented in the database between -5 and + 15 days.
Note that -fit database is in constant evolution. New spectra are regularly included as they become available to the community.
[c]cccc
SN Ia template spectra in -Fit Database
SN Type Number of Reference
Name spectra
SN 1981B Ia 6 Branch et al. (1983)
SN 1986G 91bg-like 5 Phillips et al. (1987)
SN 1990N Ia 7 Leibundgut et al. (1991); Phillips et al. (1992); Mazzali et al. (1993)
SN 1991T 91T-like 9 Filippenko et al. (1992)
SN 1991bg 91bg-like 6 Phillips et al. (1992); Mazzali et al. (1995)
SN 1992A Ia 12 Kirshner et al. (1993)
SN 1994D Ia 18 Meikle et al. (1996); Patat et al. (1996)
SN 1996X Ia 6 Salvo et al. (2001)
SN 1997br 91T-like 10 Li et al. (1999)
SN 1997cn 91bg-like 1 Turatto et al. (1998)
SN 1998bu Ia 12 Jha et al. (1999)
SN 1999aa 91T-like 10 Garavini et al. (2004)
SN 1999by 91bg-like 14 Garnavich et al. (2004)
SN 1999ee Ia 11 Hamuy et al. (2002)
SN 2000cx 91T-like 24 Li et al. (2001a)
SN 2002bo Ia 12 Benetti et al. (2004)
SN 2003du Ia 4 Anupama et al. (2005)
Total peculiar Ia = 79 Total ’normal Ia’ = 88 Total = 167
[c]cccc
SN Ib, Ic and II template spectra in -Fit Database
SN Type Number of Reference
Name spectra
SN 1983N Ib 2 Harkness et al. (1987)
SN 1984L Ib 5 Harkness et al. (1987)
SN 1987A II_pec 4 Pun et al. (1995)
SN 1987M Ic 1 Filippenko et al. (1990)
SN 1990B Ic 4 Matheson et al. (2001)
SN 1990U Ic 3 Matheson et al. (2001)
SN 1993J IIb 6 Matheson et al. (2000)
SN 1994I Ic 7 Filippenko et al. (1995)
SN 1997ef Ibc_pec 3 Matheson et al. (2001)
SN 1998bw Ic 7 Patat et al. (2001)
SN 1998dt Ib 2 Matheson et al. (2001)
SN 1999di Ib 2 Matheson et al. (2001)
SN 1999dn Ib 3 Matheson et al. (2001)
SN 1999em IIp 11 Hamuy et al. (2001)
SN 1999ex Ibc 3 Hamuy et al. (2002)
SN 2000h Ib 1 Branch et al. (2002)
Total Ib/Ic = 43 Total II =21 Total Ib/Ic/II = 64