Infrared Luminous Lyman Break Galaxies: A Population that Bridges LBGs and SCUBA Galaxies
Abstract
A deep mid- and far-infrared survey in the Extended Groth Strip (EGS) area gives 3.6 to 8µm flux densities or upper limits for 253 Lyman Break Galaxies (LBGs). The LBGs are a diverse population but with properties correlated with luminosity. The LBGs show a factor of 30 range in indicated stellar mass and a factor of 10 in apparent dust content relative to stellar mass. About 5% of LBGs are luminous at all wavelengths with powerful emission at rest 6µm. In the rest 0.9 to 2µm spectral range these galaxies have stellar spectral slopes with no sign of an AGN power law component, suggesting that their emission is mainly powered by intensive star formation. Galaxies in this luminous population share the infrared properties of cold SCUBA sources: both are massive and dusty starburst galaxies at ; their stellar mass is larger than . We suggest that these galaxies are the progenitors of present-day giant elliptical galaxies, with a substantial fraction of their stars already formed at .
1 Introduction
The two most efficient ways of identifying galaxies at high redshifts are first, the Lyman break broadband-droput technique, and second, observations at submillimeter wavelengths. For example, surveys with the Submillimeter Common-User Bolometer Array (SCUBA) on the James Clerk Maxwell Telescope reveal high-redshift objects via emission from the cold dust they contain (Ivison et al., 2002; Smail et al., 2002; Chapman et al., 2003). Conventional wisdom is that the submillimeter observations preferentially select starburst galaxies at because the far-infrared luminosity peak shifts into the submillimeter band (Ivison et al., 2002; Smail et al., 2002; Chapman et al., 2003). Most SCUBA sources are too faint in the optical and near-infrared bands for spectroscopic identification, but Chapman et al. (2003) and Simpson et al. (2003) have confirmed that most SCUBA sources in their sample are at . Despite all the effort that has gone into SCUBA searches, Lyman Break Galaxies (LBGs) still constitute by far the largest well-studied rest-frame-UV selected galaxy samples at high redshift (Steidel et al., 2003).
The relation between LBGs and SCUBA galaxies remains unclear, but recently Chapman et al. (2005) have confirmed that some SCUBA galaxies have the typical rest-frame UV colors as LBGs at (Steidel et al., 2004). Understanding both populations requires a direct comparison of properties, such as stellar mass and dust emission. The four bands viewed by the Infrared Array Camera (IRAC) aboard Spitzer, from 3.6m to 8.0m, cover spectral energy distributions (SEDs) for galaxies at in the rest-frame near-infrared, where the luminosities are good indicators of stellar mass (Cole et al., 2001; Drory et al., 2004; Glazebrook et al., 2004; Bundy et al., 2005). The Multiband Imaging Photometer for SIRTF (MIPS) 24m band is an ideal probe of the PAH and hot dust emission from LBGs and SCUBA galaxies. Preliminary studies show that Spitzer can easily detect both LBGs and SCUBA galaxies (Barmby et al., 2004; Egami et al., 2004; Huang et al., 2004).
This Letter presents the first study of a large LBG sample in the Extended Groth Strip (EGS) region based on Spitzer observations carried out with deep IRAC and MIPS photometry. We report discovering a new type of LBG, the Infrared-Luminous LBG (ILLBG) with strong infrared emission at rest-frame 6m, whose properties are very similar to those of SCUBA galaxies. ILLBGs are massive, dusty, and powered mainly by extremely rapid star formation.
2 Spitzer Observations
IRAC (Fazio et al., 2004a, b) observations of the EGS were carried out in two epochs: 2004 January and June, covering a strip. The MIPS observations were done in 2004 June in scanning mode. Limiting flux densities (5) are roughly 0.5Jy at 3.6 and 4.5µm, 2.7Jy at 5.8 and 8.0µm, and 60Jy at 24m. We use the same data reduction procedure for both IRAC and MIPS data as Huang et al. (2004) and Egami et al. (2004).
The LBG sample in the EGS area was taken from Steidel et al. (2003). Among a total of 334 objects in the Steidel et al. (2003) catalog, 188 are spectroscopically identified as galaxies at z3, 3 are QSOs, 3 are AGN, and 7 are stars. The remaining 133 objects are not identified. In the photometric catalog 253 objects are in the area covered by both IRAC and MIPS imaging. Of these, 211 are detected at 3.6m, 199 at 4.5m, 53 at 5.8m, and 44 at 8.0m. We detect 11 LBG counterparts in the MIPS 24m image including all 3 QSOs and 1 AGN identified by Steidel et al. (2003).111 Two additional LBGs may be detected at 24µm, but there are non-LBG galaxies within 3′′ of them on the sky. Given the angular resolution of MIPS, we cannot be sure which objects are responsible for the 24µm flux, and to be conservative we do not count these two as 24µm LBG detections. The 24m-detected counterparts are also detected at all shorter wavelengths and are among the brightest sources in the sample. We define the LBGs with 24 m detections () as Infrared-Luminous Lyman Break Galaxies (ILLBGs). The 24m limiting flux is equivalent to for galaxies at , or if we use the M82 SED to convert the luminosity at 6.2m to the total infrared luminosity.
We compare the LBG sample with a set of Lockman Hole area SCUBA sources having secure identifications (Huang et al., 2004; Egami et al., 2004).222 Finding counterparts to SCUBA sources is difficult because there are many faint optical and infrared sources within the SCUBA error circle. For reliable identifications, radio observations are needed to give accurate positions. Four SCUBA sources in the EGS IRACMIPS area have good radio observations (webb03), but none of the counterparts thereby identified has a known redshift. In fact, SEDs suggest that at least two of the four are at . Thus the EGS SCUBA sources do not provide a useful comparison sample, and we compare the EGS LBGs with the Lockman Hole SCUBA sources instead. Egami et al. (2004) classified these SCUBA sources into two types (cold and warm) based on the dust temperature inferred from their SEDs. The cold sources exhibit the 1.6m H- opacity minimum bump in the IRAC bands, a stellar feature typically seen in galaxy SEDs. The cold SCUBA sources are well approximated by the SED of Arp 220, a cold dusty starburst. The warm sources are AGN-dominated with a power-law continuum SED, similar to that of Mrk 231. There are four cold and two warm sources in the Lockman Hole SCUBA sample (Egami et al., 2004; Huang et al., 2004).
3 Infrared Colors of LBGs
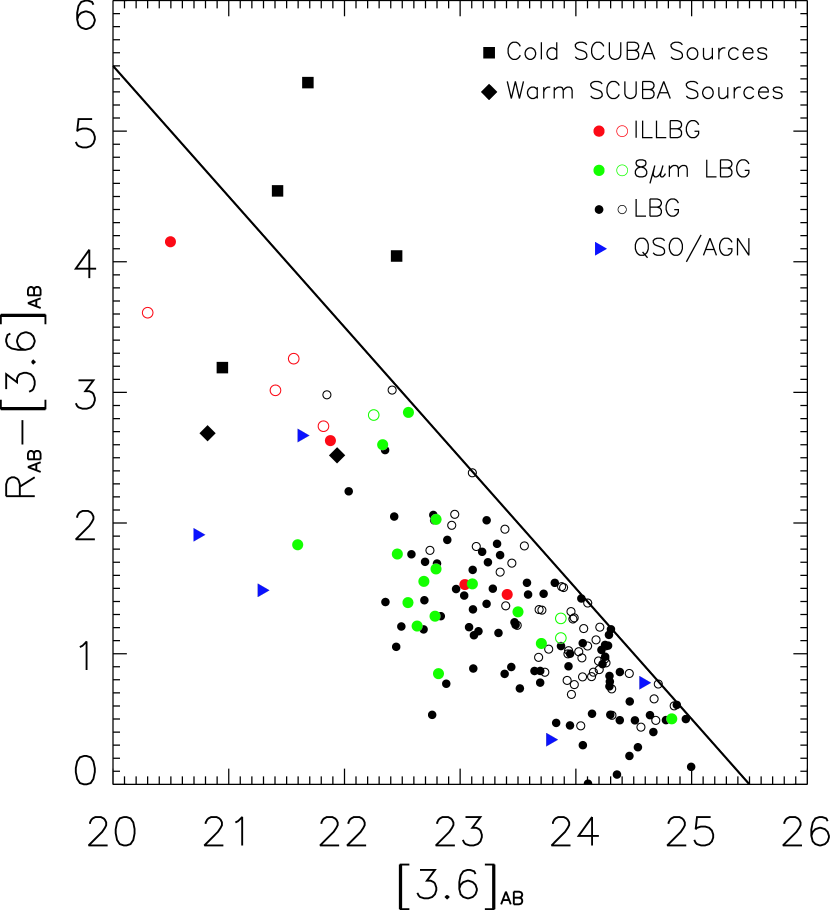
The LBGs exhibit a much wider range of flux densities in the IRAC bands than in the K band. Figure 1 shows that the range of 3.6m flux densities for the LBGs spans 4 magnitudes compared to only 1.5 magnitudes for the range of K-band flux density seen by Shapley et al. (2001). Figure 1 also shows a correlation between [3.6] and for LBGs. This relation is partially due to a selection effect (all LBGs are brighter than (Steidel et al., 2003)), but there is an obvious absence of LBGs with blue colors at higher 3.6m flux densities. All ILLBGs (as defined above) are redder than , and most have . Three ILLBGs are so red that they are close to qualifying as extremely red objects (ERO) (, Wilson et al. 2004). LBGs detected at 8m are redder than other galaxies ( versus 0.94 for LBGs detected at 3.6m but not 8m) but not so red as the ILLBGs. All six Lockman Hole SCUBA sources have red colors (Wilson et al., 2004), comparable to those of the ILLBGs.
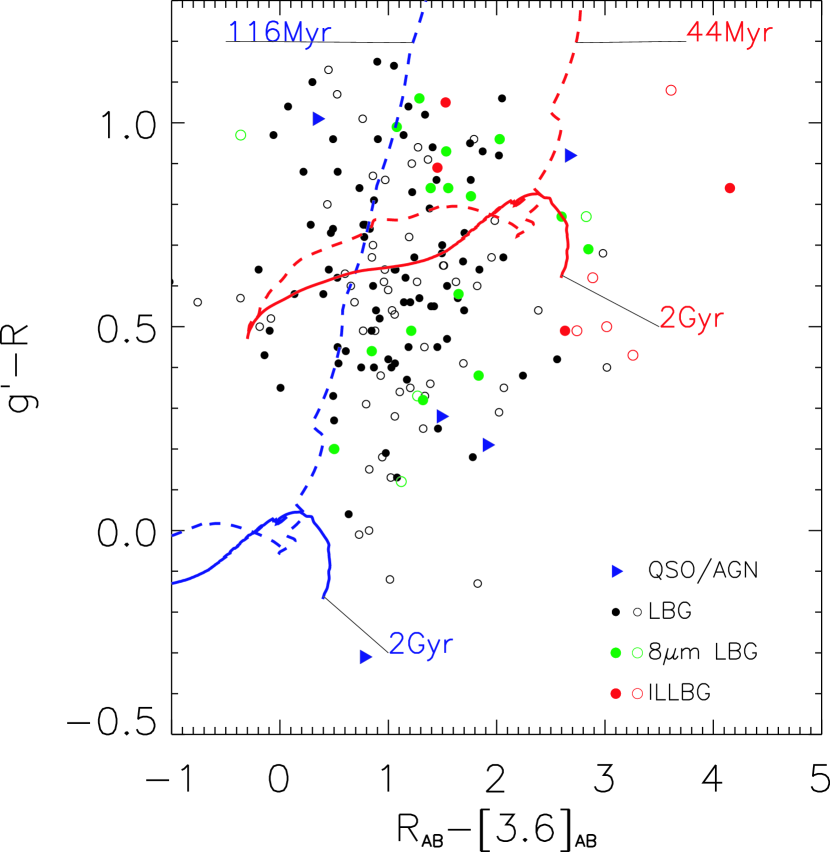
Figure 2 compares the observed LBG colors with those predicted by two simple stellar population synthesis models (single burst and constant star formation). These two models correspond to two extreme cases of a model having a exponentially decay star formation rate, , where is the single burst model and is the constant star formation model. For any given , the constant star formation model predicts the reddest color for galaxies at . A combination of the two models with varying amounts of dust attenuation can reproduce almost all the LBG colors. Shapley et al. (2001), Papovich et al. (2001), and Labbe et al. (2005) argue that a model with constant star formation rate fits the SEDs of near-infrared bright LBGs better. This model should also be very close to the real star formation history for the 8m bright LBGs and ILLBGs. As shown in Figure 2, is more sensitive to dust extinction, and is sensitive to both age and dust extinction for galaxies with constant star formation history. A rough estimate of the extinction range as is consistent with what Shapley et al. (2001) and Papovich et al. (2001) measured in their LBG samples. The LBGs with 8m detections tend to be older but little dustier than those not detected at 8µm. The ILLBGs are more extreme, most very red in and , some beyond the model prediction. Shapley et al. (2001) also found that the SEDs of LBGs with the reddest defied any simple model fitting and argued that those are starburst galaxies with multi-component morphologies, each with different colors. Such a red color could also be due to a significant contribution from an obscured AGN, but we argue below that significant AGN emission is inconsistent with the colors.
4 Origin of 24m emission from ILLBGs
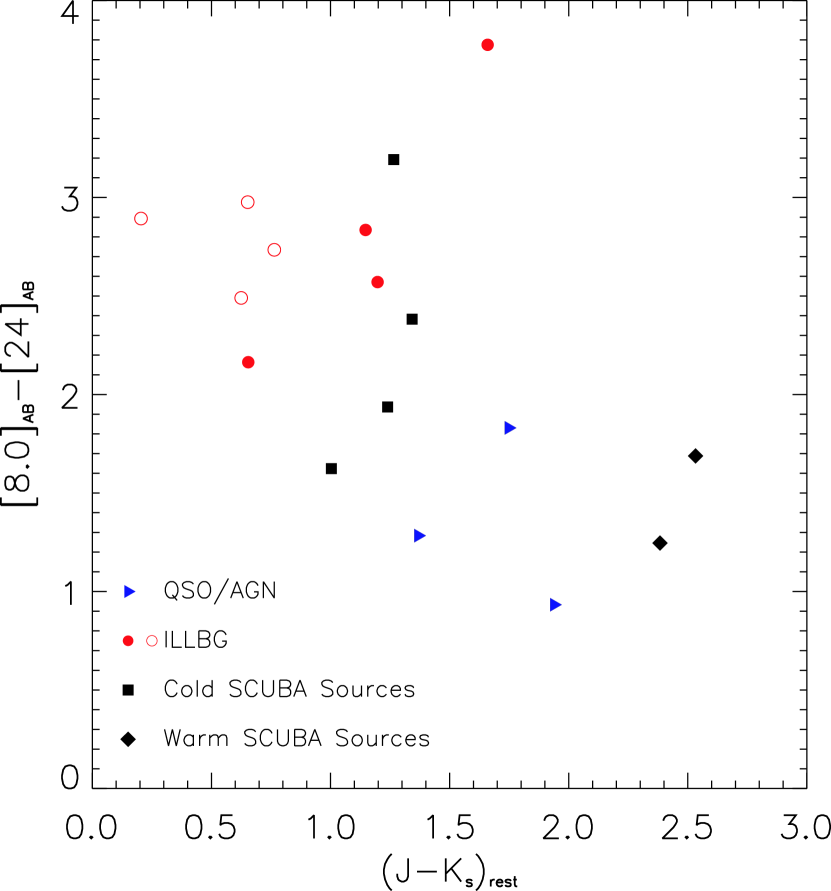
The observed 24m emission (6m rest wavelength) from the ILLBGs can come from either the power law component of an AGN (e.g., Elvis et al. 1994; Egami et al. 2004; Stern et al. 2005) or from warm dust heated by a starburst (e.g., Sanders & Mirabel 1996; Rigopoulou et al. 1999). For strong starbursts, the 6.2m PAH feature can enhance the observed flux by perhaps a factor of 1.5 (Tran et al., 2001; Peeters et al., 2004). As Ivison et al. (2004) point out, a key diagnostic for distinguishing between starbursts and AGN is the existence of a change of slope around rest 3–4µm: strong AGN have nearly a constant slope from 2 to 10m, whereas starbursts show a distinct minimum in the 3–4µm range. Translated to an observational criterion, rest implies an AGN (Cutri et al. 2001; cf. Ivison et al. 2004 Fig. 3).
Figure 3 shows the vs color-color diagram for starburst-AGN separation suggested by Ivison et al. (2004). QSOs and warm SCUBA sources exhibit rest-frame color as red as local AGNs (Cutri et al., 2001), while all ILLBGs except one have . Therefore we suggest that the 24m flux densities of ILLBGs are mainly due to strong dust emission caused by intensive star formation. ILLBGs have much redder colors than QSOs and AGNs, steeper than typical power-law SEDs but consistent with strong starbursts. The SCUBA sources occupy the same overall portion of color-color space in this plot as do ILLBGs, AGNs, and QSOs at . In other words, the cold SCUBA sources appear to be Arp-220-like starburst galaxies at the upper-left corners, and the warm SCUBA sources are AGNs. We conclude that ILLBGs, like cold SCUBA sources, are starburst galaxies.
5 Characterizing the Galaxy Population at
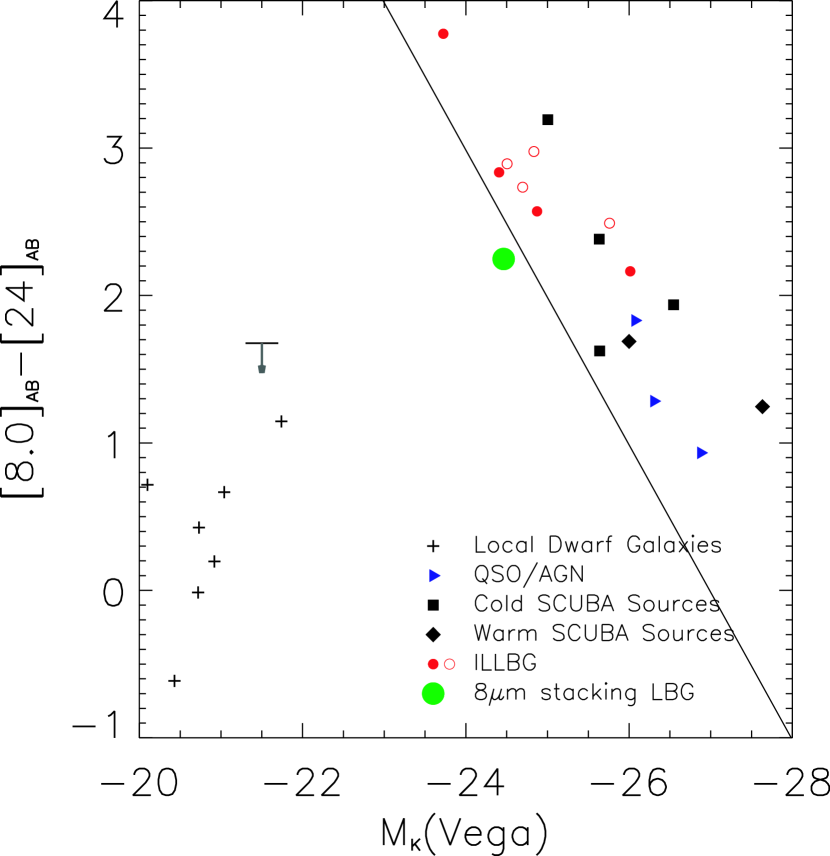
The faint blue LBGs that lack 24m detections could have dust emission with flux densities below our detection threshold. For example, even blue dwarf galaxies are found to have dust emission at rest-frame 6m, presumably with PAH features (Rosenberg et al., 2005). We used a stacking technique to assess the average dust emission for the blue LBG population at z=3. The LBGs without 24m detection were divided into two groups for stacking: those with 8m detections and those without. There are a total of 198 LBGs lacking 24m detections including both spectroscopically identified and unidentified ones. In this subset, 31 LBGs have 8m detections. The 8m and 24m images for both groups were stacked separately.
The stacking results show a significant difference between LBGs with and without 8µm detections. The LBGs without 8m detections have , right in the range exhibited by local dwarf galaxies as shown in Figure 4. The upper limit in the colors is also consistent with colors of local blue dwarf galaxies. This strongly suggests that most faint blue LBGs in the sample have similar stellar masses, dust obscuration, and star-formation histories as dwarf galaxies in the local universe. The LBGs with 8m detections, including the ILLBGs, have , brighter than the local (Cole et al., 2001; Huang et al., 2003). The and for the 8m-detected LBGs are only slightly fainter and bluer than those of ILLBGs, suggesting that they may be similar kinds of galaxies but a little fainter and bluer, just below the 24m limiting flux density.
All the results show that the LBG population is far from uniform. Figures 1 and 4 demonstrate that the LBGs with the largest stellar luminosities, as indicated by 8m flux densities, are older and dustier than the LBGs with lower stellar luminosities. A larger LBG sample with infrared photometry and deeper 8µm observations are needed to tell whether there are two distinct populations or a continuous range of galaxy properties.
Rigopoulou et al. (2005) conducted a detailed analysis of the stellar populations and estimated stellar masses for the 8m-selected LBGs. All were found to be massive galaxies() with the ILLBGs tending to have higher masses (). These masses are consistent with the mean dynamic mass of for starburst-type SCUBA galaxies (Swinbank et al., 2004; Tecza et al., 2004). Massive galaxies with have also been found at (Cimatti et al., 2002; Daddi et al., 2004; Saracco et al., 2004; Glazebrook et al., 2004; Tecza et al., 2004; Labbe et al., 2005). These observations challenge current theoretical predictions of galaxy formation (Kauffmann et al., 1999; Shu et al., 2001; Baugh et al., 2003; Somerville et al., 2004). This study provides further confirmation that at least some massive galaxies were formed by , favoring galaxy formation and evolution models assuming more rapid stellar mass accumulation scenarios (Nagamine et al, 2005).
6 CONCLUSIONS
This infrared study of LBGs reveals that they are a diverse group in terms of both their masses and dust contents. The observed 8m (rest 2µm) flux densities, which are roughly proportional to stellar mass, extend over at least 1.5 orders of magnitude, and the ratio of 24 to 8m flux densities, which measure the fraction of ISM emission, extends over more than an order of magnitude.
Among 253 LBGs in the EGS area covered by Spitzer, 5% were detected with . We refer to these as ILLBG. ILLBGs have much redder observed colors than the other LBGs in the sample. The rest-frame colors for most ILLBGs are stellar with no sign of an AGN power-law component. Therefore we suggest that the 24m emission is dominated by dust heated in a massive starburst, probably including some contribution from the PAH feature at rest-frame 6.2m. ILLBGs and cold SCUBA sources share the same infrared properties, suggesting that they are closely related and may belong to the same population. If so, it ought to be possible to detect submillimeter emission from ILLBGs. Both ILLBGs and cold SCUBA sources tend to be massive with a typical stellar mass of . Such masses make them candidates for the progenitors of present-day giant ellipticals.
In contrast to ILLBGs, most LBGs in the sample are only detected at 3.6 and 4.5m and have faint mid-infrared luminosities and blue colors. Their lower average 8m flux density measured with the stacked image implies that the faint LBGs have much less stellar mass than ILLBGs, in a range similar to local dwarf galaxies. An upper limit of color for average faint LBGs is also consistent with dust emission of local dwarf galaxies.
References
- Armus et al. (2004) Armus, L., et al. 2004, ApJS, 154, 178
- Barmby et al. (2004) Barmby, P., at al. 2004, ApJS, 154 97
- Baugh et al. (2003) Baugh, C. M., Benson, A. J., Cole, S., Frenk, C. S., & Lacey, C. 2003, in The Masses of Galaxies at Low and High Redshift, ed. R. Bender & A. Renzini (Berlin: Springer), 91
- Bundy et al. (2005) Bundy, K. et al. 2005, ApJ, in press (astro-ph/0502204)
- Cimatti et al. (2002) Cimatti, A., et al. 2002, A&A, 391, L1
- Calzetti et al. (2000) Calzetti, D., et al. 2000, ApJ, 533, 682
- Chapman et al. (2003) Chapman, S. C., Blain, A. W., Ivison, R. J., & Smail, Ian R. 2003, Nature, 422, 369
- Chapman et al. (2005) Chapman, S. C., et al. 2005, ApJ, 622, 722
- Cole et al. (2001) Cole, S., et al. 2001, MNRAS, 326, 255
- Cutri et al. (2001) Cutri, R., et al. 2001, in ASP Conf. Ser. 232, New Era of Wide Field Astronomy, ed. R. Clowes, A. Adamson, & G. Bromage (San Francisco: ASP), 78
- Daddi et al. (2004) Daddi, E., et al. 2004, ApJ, 600, L127
- Drory et al. (2004) Drory, N., et al. 2004, ApJ, 608, 742
- Egami et al. (2004) Egami, E. et al. 2004, ApJS, 154, 130
- Elvis et al. (1994) Elvis, M. et al. 1994, ApJS, 95, 1
- Fazio et al. (2004a) Fazio, G. G. et al. 2004, ApJS, 154, 10
- Fazio et al. (2004b) Fazio, G. G. et al. 2004, ApJS, 154, 39
- Genzel et al. (1998) Genzel, R., Lutz, D., Sturm, E., et al. 1998, ApJ, 498, 579
- Glazebrook et al. (2004) Glazebrook, K., et al. 2004, Nature, 430, 181
- Hogg et al. (2002) Hogg, D., et al. 2002, astro-ph/0210394
- Huang et al. (1997) Huang, J.-S., Cowie, L. L., Gardner, J. P., Hu, E. M., Songaila, A.,& Wainscoat, R. J. 1997, ApJ, 476, 12
- Huang et al. (2003) Huang, J.-S., Glazebrook, K., Cowie, L. L., & Tinney, C. 2003, ApJ,584, 203
- Huang et al. (2004) Huang, J.-S., Barmby, P., et al. 2004, ApJS, 154, 44
- Ivison et al. (2002) Ivison, R. J., Greve, T. R., Smail, Ian, et al. 2002, MNRAS, 337, 1
- Ivison et al. (2004) Ivison, R. J., et al. 2004, ApJS, 154, 124
- Kauffmann et al. (1999) Kauffmann, G., et al. 1999, MNRAS, 303, 188
- Labbe et al. (2005) Labbe, I., et al. 2005, ApJ, in press.
- Nagamine et al (2005) Nagamine, K., et al. 2005, astro-ph/0502001
- Papovich et al. (2001) Papovich, C., Dickinson, M., & Ferguson, H. C. 2001, ApJ, 559, 620
- Peeters et al. (2004) Peeters, E., et al. 2004, ApJ, 613, 986
- Rigopoulou et al. (1999) Rigopoulou, D., et al. 1999, AJ, 118, 2625
- Rigopoulou et al. (2005) Rigopoulou, D., et al. 2005, in preparation
- Rosenberg et al. (2005) Rosenberg, J., et al. 2005, in preparation
- Sanders & Mirabel (1996) Sanders, D. & Mirabel, I. F. 1996, ARA&A, 24, 749
- Saracco et al. (2004) Saracco, P., et al. 2004, A&A, 420, 125
- Shapley et al. (2001) Shapley, A. E., Steidel, C. C., Adelberger, K. L., Dickinson, M., Giavalisco, M., & Pettini, M. 2001, ApJ, 562, 95
- Shu et al. (2001) Shu, C. G., et al. 2001, MNRAS, 327,895
- Simpson et al. (2003) Simpson, C., Dunlop, J. S., Eales, S. A., Ivison, R. J., Scott, S. E., Lilly,S.J., & Webb, T. M. A. 2004, MNRAS, 353, 179
- Smail et al. (2002) Smail, I., Ivison, R. J., Blain, A. W., & Kneib, J.-P. 2002, MNRAS, 331, 495
- Somerville et al. (2004) Somerviller, R., et al. 2004, ApJ, 600, L135
- Steidel et al. (2003) Steidel, C. C., Adelberger, K L., Shapley, A E., Pettini, M, Dickinson, M, & Giavalisco, M. 2003, ApJ, 2003, 592, 728
- Steidel et al. (2004) Steidel, C. C., et al. 2004, ApJ, 604, 534
- Stern et al. (2005) Stern, D., et al. 2005, ApJ, in press
- Swinbank et al. (2004) Swinbank, A. M., Smail, I., Chapman, S. C., Blain, A. W., Ivison, R. J., & Keel, W. C. 2004, ApJ, 617, 64
- Tecza et al. (2004) Tecza, M., et al. 2004, ApJ, 605, L109
- Tran et al. (2001) Tran, Q. D., et al. 2001, ApJ, 552, 527
- Werner et al. (2004) Werner, M. W., et al. 2004, ApJS, 154, 1
- Wilson et al. (2004) Wilson, G., Huang, J.-S., et al. 2004, ApJ, 154, 107