The build-up of the Coma cluster by infalling substructures
We present a new multiwavelength analysis of the Coma cluster subclustering based on recent X-ray data and on a compilation of nearly 900 redshifts. We characterize subclustering using the Serna & Gerbal (1996) hierarchical method which makes use of galaxy positions, redshifts, and magnitudes, and identify 17 groups. One of these groups corresponds to the main cluster, one is the well known group associated with the infalling galaxy NGC 4839 and one is associated with NGC 4911/NGC 4926. About one third of the 17 groups have velocity distributions centered on the velocities of the very bright cluster galaxies they contain (magnitudes ).
In order to search for additional substructures, we make use of the isophotes of X-ray brightness residuals left after the subtraction of the best-fit -model from the overall X-ray gas distribution (Neumann et al. 2003). We select galaxies within each of these isophotes and compare their velocity distributions with that of the whole cluster. We confirm in this way the two groups associated, respectively, with NGC 4839, and with the southern part of the extended western substructure visible in X-rays.
We discuss the group properties in the context of a scenario in which Coma is built by the accretion of groups infalling from the surrounding large scale structure. We estimate the recent mass accretion rate of Coma and compare it with hierarchical models of cluster evolution.
Key Words.:
galaxies: clusters: individual: Coma cluster: Abell 16561 Introduction
Being located relatively nearby, Coma is one of the best studied clusters of galaxies at almost all wavelengths. For decades, it has been considered as the prototype of rich relaxed clusters (e.g. Kent & Gunn 1982). However, following seminal remarks or partial studies (e.g. Shane & Wirtanen 1954, Quintana 1979, Valtonen & Byrd 1979, Baier 1984, Perea et al. 1986 and references in the review by Biviano 1998) the idea that Coma exhibits a complex structure became commonly accepted with the results of Fitchett & Webster (1987) and Mellier et al. (1988, M88 hereafter) in the late 80’s.
Although the very first X-ray observations of the Coma Intra Cluster Medium (ICM) already gave a hint of a possible complex central structure (e.g. Tanaka et al. 1982), the X-ray community recognized this fact only in 1993 (Davis & Mushostzky 1993). Since then, new structures and properties are regularly (re)discovered and better quantified.
Both optical and X-ray data lead to the present view where, in particular, major substructures are present around NGC 4839, a group which appears to be falling onto the Coma cluster core (e.g. Neumann et al. 2001), and around the two main galaxies NGC 4874 and NGC 4889 (e.g. Gurzadyan & Mazure 2001), the former possibly being the detached core of a larger tidally stripped galaxy structure moving northward (see e.g. Adami et al. 2005a). Other substructures may be present around NGC 4911 (see e.g. M88, Neumann et al. 2003, N03 hereafter). In the core, bright galaxies appear to be associated with the two cluster dominant objects NGC 4874 and NGC 4889, while faint galaxies have a smoother distribution (Biviano et al. 1996), but the significance of this different distribution is not fully established (Edwards et al. 2002). Łokas & Mamon (2003) found that the early-type galaxy distribution in Coma is consistent with these galaxies being on nearly isotropic orbits. Their result was consistent with Adami et al.’s (1998) result, based on kinematical modelling, that early-type Coma galaxies have moderately tangential orbits. Additionally, Adami et al. also found moderately radial orbits for the late-type galaxy population.
Due to the difficulty of collecting homogeneous velocity catalogues on broad regions, structural and dynamical analyses of Coma on large scales are generally based on photometric data (e.g. on the Godwin et al. 1983 catalogue, hereafter GMP). Hence, up to now, the relatively small number of redshifts available strongly penalized any kinematical analysis. For example, in order to locate and compute velocity dispersions for typical group-size substructures (100 h-1kpc) in the dense cluster regions (1h-1Mpc), one needs about 10 redshifts per 100100 h-2kpc2 “pixel” (e.g. Lax 1985), which therefore leads to a total number of redshifts of about 1000. Such a number starts to be reachable by combining all literature redshift catalogues for the Coma cluster. It is interesting to note that, even in the era of modern multi-object spectrographs, Coma is one of the few clusters (if not the only one) with such a redshift sample available.
Several problems remain however. We must take into account the fact that relaxation, survival and virialisation times depend on the galaxy mass, morphological type, orbit, etc. In practice, we never have access to all these parameters at the same time for all galaxies of a given sample. It is therefore crucial to use another estimator of the cluster dynamics: the hot gas X-ray emission. With the large XMM-Newton field of view and collecting power, we now have access to deep X-ray data over a large field for the Coma cluster (e.g. Neumann et al. 2001).
The goal of this paper is to deepen our knowledge of the structure of the Coma cluster and draw a scenario for its build-up through the accretion of galaxy groups. For this we make use of statistical descriptions of the galaxy velocity distributions and apply the hierarchical method developed by Serna & Gerbal (1996, hereafter SG) combined with X-ray information, based on a large catalogue of redshifts and recent XMM-Newton results (Neumann et al. 2001). The paper is organized as follows: our data-set is described in Section 2; the methods and results of the substructure analysis are presented in Section 3; our results are discussed in Section 4 and summarized in Section 5. We assume a Hubble constant H0=70 km s-1 Mpc-1 throughout this paper. As for the center of the Coma cluster we take =12h57.3mn, =+28∘14.4’ (equinox 1950.0; see GMP).
2 Samples
The velocities of galaxies in the region defined by GMP are taken from the compilation of several literature sources used in Biviano et al. (1996, hereafter B96), recently updated with the data of Rines et al. (2001), Beijersbergen et al. (2002), Mobasher et al. (2003), and Boselli (private communication). In total, we have 873 galaxies which are considered cluster members (with velocities between 4000 and 10000 km/s in the GMP region). The sample is therefore significantly larger than the one used by Colless & Dunn (1996, hereafter CD96) and B96. Galaxy magnitudes in each of these samples were scaled to the R-band CFH12K system (see Adami et al. 2005b).
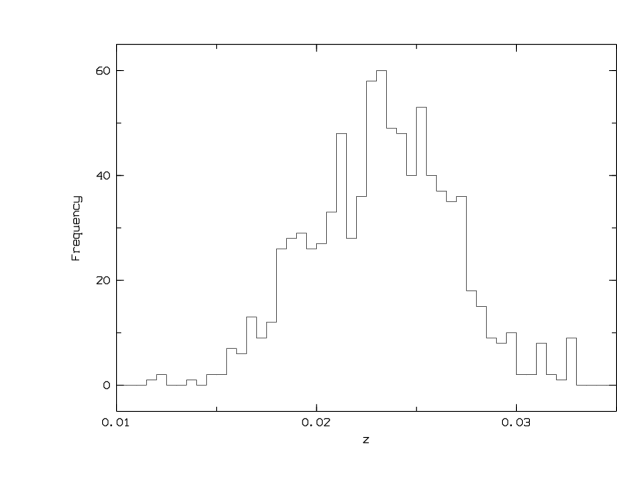
Fig. 1 shows the redshift histogram of our catalogue together with its completeness as a function of magnitude in the R band. We defined two areas. The central area (solid line in Fig. 1) is 42’55’ centered on the Coma cluster center and is close to the area surveyed with deep CFHT imaging data (Adami et al. 2005b). The total area is the GMP area, with a limiting magnitude of R=19.5 to avoid catalogue incompleteness. Our redshift catalogue is more than 50% complete for R18 and becomes less than 20% complete for R18.5.
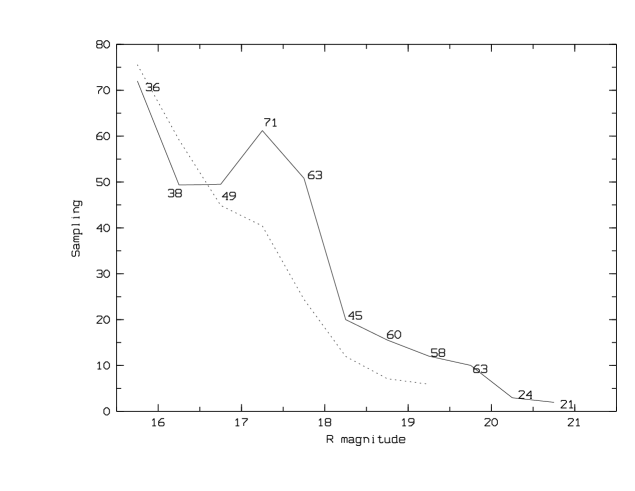
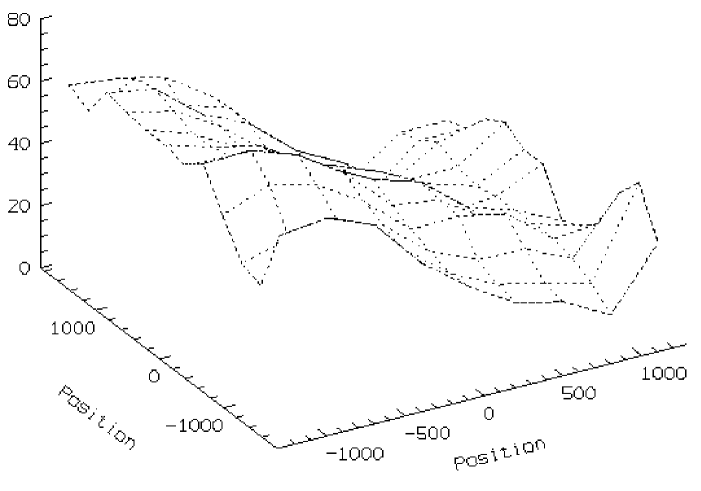
We also investigated the spatial completeness at R18 (Fig. 2). We clearly see that the redshift completeness is quite inhomogeneous over the CFHT field of view. The East areas are sampled at about 60 while the West areas have a lower sampling close to 30. This means that we should detect more easily the East substructures than the West ones.
| Id | coordinates | |
|---|---|---|
| NGC 4789 | 8293 | |
| NGC 4816 | 6921 | |
| NGC 4839 | 7389 | |
| NGC 4841 | 6819 | |
| NGC 4852 | 5972 | |
| NGC 4874 | 7189 | |
| NGC 4889 | 6472 | |
| NGC 4911 | 8026 | |
| NGC 4921 | 5508 | |
| NGC 4926 | 7851 | |
| NGC 4944 | 6942 |
The spatial distribution of all the cluster members (with measured velocities) is shown in Fig. 3. The directions to three clusters with redshift and within a projected distance smaller than 80 Mpc (at z=0.023) are also indicated (see also West 1998, Fig. 2). We also reproduce in the same figure the isophotes corresponding to the residuals identified by N03 after subtracting the best-fit -model from the X-ray emission of the whole Coma cluster (see Fig. 2 in N03). In Table 1 we provide names, coordinates, and velocities of galaxies with , shown as filled squares in Fig. 3.

3 Substructure analysis
3.1 Application of the Serna & Gerbal method
In order to search for substructures in the Coma cluster, we first applied the SG method to our redshift catalogue. This hierarchical method allows to extract galaxy subgroups from a catalogue containing positions, magnitudes and redshifts, based on the calculation of their relative (negative) binding energies. The method gives in output a list of galaxies belonging to the selected group, as well as the information on the binding energy of the group itself.
We use a M/L ratio in the R band of 200. This was derived from the Coma cluster M/L ratio in the B band given by Łokas & Mamon (2003), using a colour , typical of elliptical galaxies. We also checked that using a M/L ratio of 400 does not change significantly the results. All groups are still detected and no additional group is generated. This range of M/L values ([200,400]) is also in good agreement with the values given by Carlberg et al. (1996).
After each individual group was identified by the Serna & Gerbal method, we computed its mean velocity through the biweight estimator, using the Rostat package (Beers et al. 1990). Given the small number statistics, and the contamination by cluster galaxies, the higher velocity moments (such as the velocity dispersion) of these groups have very large errors and are not reported here.
| Id. | coordinates | N | Bright gals. | ||
|---|---|---|---|---|---|
| G1 | 19 | 22.9 | 4874, 4889 | ||
| G2 | 10 | 24.2 | 4816, 4839 | ||
| G3 | 5 | 9.8 | 4841 | ||
| G4 | 11 | 14.4 | 4911, 4926 | ||
| G5 | 6 | 9.0 | 4944 | ||
| G6 | 4 | 8.9 | 4789 | ||
| G7 | 8 | 19.7 | 4921 | ||
| G8 | 3 | 2.9 | |||
| G9 | 3 | 2.6 | |||
| G10 | 3 | 0.2 | |||
| G11 | 4 | 6.4 | |||
| G12 | 4 | 3.5 | |||
| G13 | 4 | 2.2 | |||
| G14 | 3 | 2.0 | |||
| G15 | 7 | 10.0 | |||
| G16 | 3 | 4.0 | |||
| G17 | 3 | 1.5 |
The SG method reveals the existence of 17 groups, whose characteristics are given in Table 2. A map of Coma with the positions of galaxies associated to the SG groups is displayed in Fig. 4. The velocity histograms of the 17 groups are shown in Figs. 5, 6, and 7. In those figures we also plot, as a reference, a gaussian with mean and dispersion equal to the whole cluster mean velocity and velocity dispersion, normalized to the total number of galaxies in each group. In addition, the velocities of galaxies with , if present in the groups, are also indicated. Here we briefly describe the detected groups.


Group G1 is detected in the central region of Coma, and includes the two central giant galaxies NGC 4889 and NGC 4874. It can be considered the main cluster structure.
Group G2 is detected in the SW of Coma, and is centered around the bright galaxy NGC 4839, both in coordinates and velocity space. The absolute value of its binding energy is even higher than the binding energy of G1, which in fact, as we will see in Section 3.2, may itself contain additional substructures. G2 is a very well known group, and its properties have already been discussed by CD96. The average velocity of the group (and of its brightest member) suggests either an infall motion from the foreground, or that the group has already crossed Coma and is now escaping. The analysis of X-ray isophotes clearly supports the former hypothesis (see Neumann et al. 2001). The inclusion of NGC 4816 in this group is somewhat at odds with the findings of M88, who found that NGC 4839 and NGC 4816 are located in separate overdensity regions.
Group G3 is detected around the bright galaxy NGC 4841 in the NW Coma region. Its mean velocity is close to the velocity of NGC 4841, supporting a physical association between the group and its brightest member. The binding energy of the group is smaller than that of G2 (in absolute value) and of the order of that of G1. This binding energy is also larger than that of all the other groups. The mean velocity of G3 is not far from that of the whole cluster, indicating slow motion or a motion in the plane of the sky. This group was already apparent in projection in the map of M88.
All the other groups have significantly lower binding energy (in absolute values) than the first three.
Group G4 includes the very bright galaxies NGC 4911 and NGC 4926 (with magnitudes ). Both galaxies are centered around the mean group velocity. This is in good agreement with the M88 analysis of the projected galaxy number density distribution, suggesting the presence of a distinct group of galaxies around NGC 4911. The high velocity of the group relative to the cluster mean implies an infalling motion from the foreground or, alternatively, an outgoing motion, in which case the group should have already passed through the cluster central regions. We discuss this point further in § 4.1. Note that this group was partially detected in X-rays by N03.
Three of the remaining groups are associated with very bright galaxies, and hence have relatively high binding energies (in absolute values): G5 contains NGC 4944, G6 contains NGC 4789, and G7 contains NGC 4921. In all three cases, the group mean velocity is close to the velocity of the bright galaxy it contains. However, while the bright galaxies of G5 and G6 are quite close to the group centre, this is not the case for NGC 4921. This suggests that NGC 4921 does not sit at the bottom of the group potential well. At variance with G6 and G7, G5 has a mean velocity similar to that of the whole cluster, and hence is either moving slowly, or has its velocity vector aligned with the plane of the sky. This group was already visible as an enhancement of the galaxy density in the map of Mellier et al. (1988). It is interesting to note that both G5 and G7 lie along the direction connecting the cluster centre to the neighbouring cluster Abell 2199, and G6 lies along the direction connecting the cluster centre to Abell 1367.
Of the remaining groups, three (G8, G9 and G10) are located very close to the cluster centre, while groups G11, G12, G13 and G14 are close to the NGC 4839 group but with quite different velocities, and hence probably physically unrelated to the NGC 4839 group. G12 and G14 are close to one of the X-ray peaks detected by N03, the southern part of the so-called extended western substructure.
Groups G15 and G16 are located north of the Coma cluster. Interestingly, both groups are found approximately along the direction connecting the centre of Coma to G2, and share a similar velocity to that of G2. Hence we could speculate that they have infallen into Coma along the same direction, perhaps from the same large-scale structure filament that connects Coma to Abell 1367 (see Fig. 2 in West 1998). Similarly, it is interesting to remark that G17, a loosely bound group of three galaxies, is located in the direction of another neighbouring cluster, Abell 779.
3.2 Groups corresponding to X-ray surface brightness enhancements
Additional information on the subclustering properties of the Coma cluster comes from the X-ray band observations of N03. These authors have identified residuals in the X-ray surface brightness of Coma, after subtraction of the best-fit -model. Significant residuals were found around the bright galaxies NGC 4889, NGC 4874, NGC 4911, NGC 4921, NGC 4839, plus an additional, elongated residual to the west (see Fig. 2 in N03 and Fig. 8). With the SG method we have detected a single group associated to the two distinct X-ray groups around NGC 4889 and NGC 4874, three groups related to NGC 4911, NGC 4921, and NGC 4839, and another two groups associated with the southern part of the extended western X-ray residual (groups G12 and G14). An exact correspondence between X-ray and optically detected groups is not, however, to be expected. Significant displacements between the gas and galaxy components of an infalling group are likely to occur as a consequence of the Intra-cluster medium acting to slow down the group diffuse gas, while galaxies are freely streaming. This displacement is actually visible in the group around NGC 4839, with the brightest galaxy of this group clearly ahead of the group gas which is trailing behind in the group infall motion towards the cluster center (see Neumann et al. 2001).

In any case, we deemed it interesting to look for signatures of the X-ray subgroups in the galaxy component, besides the Serna & Gerbal detections. For this, we selected galaxies within the isocontours of the X-ray surface brightness residuals, as shown in Fig. 8, and we analyzed their velocity distributions (these are plotted as histograms in Fig. 9). Given that the elongated X-ray western residual has two main peaks, we have considered them separately. The results of our analysis are given in Table 3, where we give in particular the probability that the velocity distribution of the selected galaxies in the group is drawn from the velocity distribution of the cluster as a whole, according to a Kolmogorov-Smirnov test. The fact that the velocity distribution of a subsample is not a random draw from the whole cluster velocity distribution, makes this subsample a likely physical group.
| Id. | coordinates | N | KS prob. | |
|---|---|---|---|---|
| NGC 4874 | 16 | 0.74 | ||
| NGC 4889 | 22 | 0.12 | ||
| NGC 4911 | 28 | 0.32 | ||
| NGC 4839 | 59 | |||
| N03-SW | 16 | 0.02 | ||
| N03-NW | 21 | 0.69 |
Only two subsamples have velocity distributions that are significantly different from that of the whole Coma cluster: the one corresponding to the substructure around NGC 4839, and another one corresponding to the southern part of the extended western structure of N03 (N03-SW). The velocity range of the last one is in good agreement with G12 and G14. We therefore re-discover the NGC 4839 group as well as the groups G12 and G14. Note that N03 have not been able to find any galaxy overdensity associated with the western elongated X-ray residual, while this is now possible thanks to the added kinematical information.
Note that the group we detected including NGC 4911 is not recovered by this method when limiting ourselves to the X-ray emission area only (around NGC 4911), perhaps because of its central position which makes it subject to substantial contamination by members of the Coma cluster itself.

4 Discussion
4.1 Detected groups
Using the SG method applied to the projected phase-space distribution of galaxies in the Coma cluster, we have identified 17 dynamically bound groups. Four of them are also identified in X-rays by N03, but many others have not been previously identified, and enable us to deepen our understanding of the complex structure of the Coma cluster.
N03 have detected two independent groups in the central region of Coma, one associated with NGC 4889, and another with NGC 4874. Our analysis suggests instead that these two galaxies are part of the same group, which could actually be identified as the core of the Coma cluster itself. A hint that the two galaxies actually do lie in distinct substructures comes from the visual inspection of the velocity histograms of the X-ray selected galaxy subsamples (see Fig. 9), where NGC 4874 and NGC 4889 seem to lie at the peaks of the velocity distributions of their surrounding galaxies. The significance of these peaks is however marginal. Many other bright galaxies do however happen to be located at (or close to) the barycenters of the groups which they reside in. Hence our findings confirm the original claim of M88.
The NGC 4911 group was shown by N03 to be a low mass group of galaxies, with a mass of the order of . N03 suggested that this group is currently experiencing ram pressure stripping. The fact that the group still has a sufficently high Intra-group gas density to be detectable in X-rays, argues against the group having already crossed the cluster core. Indeed, small groups are easily disrupted, and their X-ray gas is broken up with respect to the galaxy component, after they cross the cluster core (e.g. Tormen et al. 2004). Its average velocity then implies the group is currently infalling into the cluster. The shapes of the group X-ray isophote, and the lack of a shock-heated gas region near the group location, argue however against a radial infall. More likely, the group–cluster collision has a non-zero impact parameter, and the group is spiralling into the cluster.
Note however, that our analysis does not confirm the association of NGC 4921 with the NGC 4911 group. This is because the difference in velocities between the two galaxies is km s-1 (see Table 1; note that the value reported by N03 for the velocity of NGC 4921 is incorrect – G. Gavazzi, private communication), and because NGC 4921 is found to be associated with another independent group (G7).
The group around NGC 4839 (G2) is the most strongly bound of all detected groups, even more than the central structure (G1) which is in fact identified with the cluster itself. G1 is less bound than G2 perhaps because the original compactness of G1 has been reduced by a group-cluster collision (e.g. that with the presumed NGC 4889 group, see the following section). On the other hand, the very high binding energy (in absolute values) of the NGC 4839 group strenghtens the conclusions already reached by Neumann et al. (2001) that this group has not yet crossed the cluster core.
Finally, it is worth mentioning the groups G12 and G14, that are located close to the southern part of the western substructure identified by N03 in X-rays. While N03 did not actually distinguish between the northern and southern parts of the western X-ray extension, the extension is clearly two-peaked. The association of the southern peak with a galaxy group, and the lack of any galaxy group associated with the northern peak, suggest the two X-ray peaks are physically distinct features. We come back to this issue in the following section.
4.2 Central region: which is the colliding galaxy?
The two central galaxies have individual X-ray haloes, as found by N03, and maybe they have small groups dynamically associated with them (although we still fail to identify them unambiguously):
- The galaxy distribution around NGC 4874 is clearly not different from the whole Coma cluster galaxy velocity distribution (see Table 3).
- By comparison, the Kolmogorov-Smirnov probability of the galaxy velocity distribution around NGC 4889 to be similar to the whole Coma cluster distribution is not very high, marginally indicating a galaxy group with a more or less independent status surrounding this bright galaxy.
It is also remarkable that the velocities of the two main Coma cluster galaxies are offset with respect to the cluster mean, by (NGC 4889) and (NGC 4874) km s-1. Such velocity offsets are not common among the dominant galaxies of clusters (Gebhardt & Beers 1991) and probably indicate deviation from dynamical relaxation. Maybe one of the two galaxies was originally sitting at the bottom of the Coma cluster potential well, but was later displaced and gained kinetical energy through the collision with the group associated with the other galaxy, as originally suggested by CD96. The question now is which is the colliding galaxy?
4.2.1 NGC 4874 is the colliding galaxy?
On the one hand, NGC 4874 could be the colliding galaxy with an appropriate northward motion as suggested for example by Gurzadyan Mazure (2001) or Adami et al. (2005a). This is supported by the presence of a possible X-ray shock front north of this galaxy and by the later galaxy content and high binding energy of the group surrounding this galaxy detected by Gurzadyan Mazure (2001) (compared to the NGC 4889 group). In this scenario, we would expect, however, to also detect such a residual galaxy group around NGC 4874, and contrary to Gurzadyan Mazure (2001), this is clearly not the case with the Serna-Gerbal method or using the Kolmogorov-Smirnov test (see Table 3).
This group has perhaps already been diluted, but we still need to explain the group possibly present around NGC 4889 (see beginning of discussion). The colliding NGC 4874 scenario indeed implies that NGC 4889 has been in the Coma cluster longer and this makes difficult to explain why it would still show signs of a surrounding group contrary to NGC 4874. We could indeed expect the group surrounding NGC 4889 to be more diluted than the NGC 4874 one if it has been present in Coma for a longer time.
Moreover, Adami et al. (2005a) argued that diffuse light sources around NGC 4889 could already have been re-accreted by this galaxy, while still present around NGC 4874, showing that NGC 4889 is the original cD of the Coma cluster. However, recent numerical simulations by Napolitano et al. (2003) show that diffuse light sources remain unrelaxed even at z=0 with a highly non-Gaussian velocity distribution. Hence, should NGC 4889 have been originally sitting at the bottom of the cluster potential well, some diffuse light around it should still be visible.
4.2.2 NGC 4889 is the colliding galaxy?
On the other hand, N03 has suggested that NGC 4889 is the colliding galaxy, associated with the gas that has been stripped by ram pressure and is now visible as the western extension in N03’s residuals map. N03’s interpretation originates from the fact that no other galaxy overdensity seems to be associated with the western X-ray structure.
However, we do identify a galaxy group in the southern region of the western emission, as a kinematically distinct entity from the whole cluster (N03-SW; or perhaps two: G12 and G14). Remarkably, the mean velocity of this group is similar to that of NGC 4889, but it is hard to see how the gas, if stripped from NGC 4889, would now appear to be related with the galaxies in N03-SW. However, the northern part of the X-ray western structure of N03 does not correspond to any galaxy group, and could still be stripped gas from the infallen NGC 4889 group. If NGC 4889 is the colliding galaxy, we can then draw the following scenario. N03-SW is a real group, currently infalling (from the back, given its radial velocity) into Coma, and producing the X-ray temperature enhancement visible in Fig. 3 of N03. The northern part of the western extended X-ray structure is not related to N03-SW, and is in fact residual gas from a group associated with NGC 4889. In this case, this group would have been accreted onto Coma flowing along the direction connecting Coma to the neighbouring cluster Abell 779. The shift between the galaxy and the group gas must have occurred some 0.5–1 Gyr ago (given typical Coma galaxy velocities and the distance between the gas and the galaxy).
The impact between the NGC 4889 group and the main cluster could have displaced NGC 4874 from the bottom of the cluster potential well and, at the same time, disrupted the cluster cool core, if originally present – Coma is a well known counter-example of a cooling-core cluster, its X-ray emission being unusually flat near the centre (e.g. Fabian 1994). The induced motion of NGC 4874 would be approximately northward to be in agreement with Adami et al. (2005a).
This scenario does not explain, however, why the
NW X-ray residual would be related to NGC 4889 while we still see
another X-ray residual directly around this galaxy (N03). Perhaps, one
may think of a multiphase gas component in the NGC 4889 group, one
component associated to the group as a whole and another, colder
component, more strictly bound to the giant galaxy (as the one shown by
Vikhlinin et al. 2001 with a temperature of 1 to 2 keV).
In conclusion, the two above described scenarios are both probably too
simplistic and fail to fully account for the complex observational
phenomenology, although the NGC 4889 colliding galaxy hypothesis seems more
appealing.
4.3 Group infalling process

A remarkable feature of the detected groups is that most of them lie along the main directions of the large scale structure surrounding Coma, as traced by the direction to three relatively nearby clusters, Abell 779, Abell 1367, and Abell 2199 (see Fig. 3; see also West 1998). This is clearly seen in Fig. 10 where we show the distribution of the position angles of the 17 groups, as well as the directions to the three neighbouring clusters. Our finding then strengthens the idea that Coma is currently accreting groups from the surrounding large scale structure.
The accretion needs not to be radial, however. We already discussed the case of the NGC 4911 group, which does not seem to be infalling radially onto the center of Coma (see § 4.1). B96 argued for a non-radial infall of the NGC 4839 group as well, in order to explain the coincidence of the phase-space location of galaxies in this group and the E+A population discovered by Caldwell et al. (1993). Tangential orbits would not be surprising, as groups infalling along radial orbits are selectively destroyed (González-Casado et al. 1994; Taylor & Babul 2004) and we preferentially identify groups on tangential orbits, since they survive longer. Longer survival times help to explain why most of our detected groups lack X-ray emission, since groups orbiting the central regions of Coma, but not crossing its core, can have their X-ray gas stripped by ram pressure, and still survive disruption.
Biviano et al. (2002), analysing the ESO Nearby Abell Cluster Survey (ENACS, Katgert et al. 1996, 1998) data-set, have in fact shown that galaxies in substructures are characterized by a lower velocity dispersion than other cluster galaxies. This finding was later interpreted by Biviano & Katgert (2004) as evidence for tangential orbits. On the other hand, the high-velocity dispersion of late-type galaxies was found to be an indication of (mildly) radial orbits. Hence, in order to better understand which kind of orbits characterize the infalling groups, we look at their kinematics. For the 17 Coma cluster groups we find a mean velocity of km s-1, and a velocity dispersion of km s-1, both consistent with the corresponding values for the whole Coma cluster ( km s-1 and km s-1). Since galaxies in Coma move on nearly isotropic orbits (Łokas & Mamon 2003), it is tempting to conclude that the same is true of the Coma groups, but the uncertainties are currently too large to exclude either moderately tangential or moderately radial orbits.
Assuming a maximum survival time of 2–3 Gyr for our groups (González-Casado et al. 1994), we can try to estimate the mass accreted onto Coma since –0.3. This is likely to be a lower limit estimate, since disrupted groups would not be counted, and the survival time of some of the detected groups is likely to be shorter. We do not have a direct estimate of the mass of our groups, except for the group around NGC 4839, which has an estimated mass of (CD96), and for the group around NGC 4911 (which we detect only in association with NGC 4926 using the SG method), which has an estimated mass of (N03). Both groups are associated with X-ray emitting gas, at variance with most other groups. Hence, their masses are likely to be larger than the average group masses. If we adopt the geometrical mean of these two estimates, , as the typical mass of the detected groups in the Coma cluster, we obtain a total mass for the 17 detected groups of . Alternatively, we could adopt the average mass of groups seen in large-scale surveys, (Ramella et al. 1989), yielding a total mass of . Finally, we can convert the group luminosities into masses, using the mass-luminosity relation recently derived by Popesso et al. (2005). Through their relation we obtain a total mass of for the 17 groups. We can thus estimate that Coma has accreted between 1.5 and since –0.3. This corresponds to –30% of the total cluster mass out to the virial radius (we adopt here the estimate of Łokas & Mamon 2003, ), in fair agreement with the expectations from hierarchical models of cluster galaxy formation (e.g. Tormen et al. 1997). Put in another way, if the mass accretion rate has not changed significantly since a much higher redshift, the estimated accretion rate of (0.4–2.0) Gyr-1 implies that Coma could have formed by accretion of groups from the surrounding large scale structure in less than 14 Gyr, again in agreement with the hierarchical CDM models (e.g. Evrard et al. 2002)
5 Summary and conclusions
With the aim of searching for a possible scenario to explain the buildup of the Coma cluster, we have searched for new substructures by applying the SG hierarchical method to a catalogue of about 900 galaxy redshifts and magnitudes. We have also taken into account recent results based on XMM-Newton images, which show residual emission over a smooth -model (N03).
In total, 16 groups were identified in addition to the central main cluster core. Several of these groups had not been previously identified. Most of them are distributed along the directions towards the three neighbouring clusters Abell 779, Abell 1367 and Abell 2199, suggesting that they may have been accreted from the surrounding large scale structure. Accretion onto the cluster is however unlikely to occur on purely radial orbits, or these (not very massive) groups would be easily disrupted by the tidal field.
We estimate that Coma has accreted of its mass in the form of groups since –0.3. Such an accretion rate is consistent with the Coma cluster having been built hierarchically over a Hubble time in the currently favoured CDM model.
Even with 900 galaxy redshifts, our knowledge of the Coma cluster dynamics is still limited to rather bright galaxies. In order to explore previous suggestions of a different dynamical status of bright and faint galaxies (B96), a spectroscopic follow-up of Coma galaxies at fainter magnitudes, requiring an 8 m class telescope, is needed.
Acknowledgements.
We thank the referee, A. Serna, for useful and constructive comments. We also thank A. Boselli, M. Colless, and R.C. Nichol for providing us with additional redshift measurements, and G. Gavazzi for useful discussion. We are grateful to D. Neumann for providing us with an electronically readable version of the X-ray residuals map. C.A. and F.D. thank the PNG (CNRS) for financial support. A.B. acknowledges the hospitality and financial support of the Laboratoire d’Astrophysique de Marseille, of the Institut d’Astrophysique de Paris and of GDRE EARA (CNRS).References
- (1) Adami C., Biviano A., Mazure A., 1998, A&A 331, 439
- (2) Adami C., Slezak E., Durret F. et al., 2005a, A&A 429, 39
- (3) Adami C., Picat J.-P., Savine C. et al., 2005b, A&A to be submitted
- (4) Baier F.W., 1984, AN 305, 175
- (5) Beers T, Flyn K., Gebhardt K., 1990, AJ 100, 32
- (6) Beijersbergen M., Schaap W.E., van der Hulst J.M., 2002, A&A 390, 817
- (7) Biviano A., Durret F., Gerbal D. et al., 1996, A&A 311, 95
- (8) Biviano A., 1998, Untangling Coma Berenices: A New Vision of an Old Cluster, Proceedings of the meeting held in Marseilles (France), June 17-20, 1997, Eds.: Mazure, A., Casoli F., Durret F., Gerbal D., Word Scientific Publishing Co Pte Ltd, p 1. Also: http://nedwww.ipac.caltech.edu/level5/Biviano/ frames.html
- (9) Biviano A., Katgert P., Thomas T., Adami C., 2002, A&A 387, 8
- (10) Biviano A. & Katgert P., 2004, A&A 424, 779
- (11) Caldwell N., Rose J.A., Sharples R.M., Ellis R.S., Bower R.G., 1993, AJ 106, 473
- (12) Carlberg R.G., Yee H.K.C., Ellingson E., et al., 1996, ApJ 462, 32
- (13) Colless M. & Dunn A.M., 1996, ApJ 458, 435
- (14) Davis D.S. & Mushotzky R.F., 1993, AJ 105, 409
- (15) Edwards S.A., Colless M., Bridges T.J. et al., 2002, ApJ 567, 178
- (16) Evrard A.E., MacFarland T.J., Couchman H.M. et al., 2002, ApJ 573, 7
- (17) Fabian A.C. 1994, Clusters of Galaxies, Proceedings of the XXIX Rencontre de Moriond (France), March 12-19, 1994, Eds.: Durret F., Mazure A., Trân Thanh Vân J., Editions Frontières, p.191
- (18) Fitchett M. & Webster R., 1987, ApJ 317, 653
- (19) Gebhardt K. & Beers T.C., 1991, ApJ 383, 72
- (20) Godwin J.G., Metcalfe N., Peach J.V., 1983, MNRAS 202, 113 (GMP)
- (21) González-Casado G., Mamon G.A., Salvador-Solé E., 1994, ApJ 433, L61
- (22) Gurzadyan V.G. & Mazure A., 2001, New A 6, 43
- (23) Katgert P., Mazure A., Perea J. et al., 1996, AA 310, 8
- (24) Katgert P., Mazure A., den Hartog R. et al., 1998, AA 331, 493
- (25) Kent S.M. & Gunn J.E., 1982, AJ 87, 945
- (26) Lax D. 1985, J. Am. Stat. Assoc. 80, 736
- (27) Łokas E. & Mamon G.A., 2003, MNRAS 343, 401
- (28) Mellier Y., Mathez G., Mazure A., Chauvineau B., Proust D., 1988, AA 199, 67
- (29) Mobasher B., Colless M., Carter D. et al., 2003, ApJ 587, 605
- (30) Napolitano N.R., Pannella M., Arnaboldi M. et al., 2003, ApJ 594, 172
- (31) Neumann D.M., Arnaud M., Gastaud R. et al., 2001, A&A 365, L74
- (32) Neumann D.M., Lumb D.H., Pratt G.W., Briel U.G., 2003, A&A 400, 811 (N03)
- (33) Perea J., del Olmo A., Moles M., 1986, MNRAS 219, 511
- (34) Popesso, P., Biviano, A., Böhringer, H., Romaniello, M., & Voges, W. 2005, A&A, 433, 431
- (35) Quintana H., 1979, AJ 84, 15
- (36) Ramella M., Geller M.J., Huchra J.P. et al. 1989, ApJ 344, 57
- (37) Rines K., Geller M.J., Kurtz M.J. et al. 2001, ApJ 561, 41
- (38) Serna A. & Gerbal D., 1996, A&A 309, 65 (SG)
- (39) Shane C.D. & Wirtanen C.A., 1954, AJ 59, 285
- (40) Tanaka K.I., Fujishima Y., Fujimoto M., 1982, PASJ 34, 147
- (41) Taylor J.E., Babul A., 2004, MNRAS 348, 811
- (42) Tormen G., 1997, MNRAS 290, 411
- (43) Tormen G., Moscardini L., Yoshida N., 2004, MNRAS 350, 1397
- (44) Valtonen M.J., Byrd G.G., 1979, ApJ 230, 655
- (45) Vikhlinin A., Markevitch M., Forman W., Jones C., 2001, ApJ 555, L87
- (46) West M., 1998, Untangling Coma Berenices: A New Vision of an Old Cluster, Proceedings of the meeting held in Marseilles (France), June 17-20, 1997, Eds.: Mazure, A., Casoli F., Durret F. , Gerbal D., Word Scientific Publishing Co Pte Ltd, p. 36