Molecular Hydrogen in Orion as Observed by the
Abstract
Diffuse far-ultraviolet stellar emission scattered by dust grains has been observed in a region near the Orion Nebula. In addition to the scattered stellar continuum, emission and absorption features produced by molecular hydrogen have been identified. In this Letter, we present an analysis of this absorption and fluorescent emission from molecular hydrogen in Orion. We model the spectra obtained with the using optical depth templates and a fluorescent emission code. These results are surprising because previous studies have found little ultraviolet absorption from H2 in this region, and the emission is coming from a seemingly empty part of the nebula. We find that the emission fills in the observed absorption lines where the two overlap. These data support the claim that fluorescent excitation by ultraviolet photons is the primary mechanism producing the near-infrared emission spectrum observed in the outer regions of the Orion Nebula.
Subject headings:
ISM:molecules — ISM:individual (M 42) — reflection nebulae — ultraviolet:ISM1. Introduction
The Orion Nebula (M42) is among the most well-studied objects in the sky. Its proximity to the Sun combined with a bright Photo-Dissociation Region (PDR) and a giant molecular cloud make it an ideal region to study a range of astrophysical processes. Molecular hydrogen (H2) should account for the majority of the molecular mass in this region. Observations of emission and absorption features of this molecule provide useful diagnostics of the physical conditions in PDRs and molecular clouds (Burton et al., 1989; Luhman et al., 1994; Rachford et al., 2002; Kristensen et al., 2003; France et al., 2005). Previous observations of H2 emission in Orion have been limited to the weak quadrupole rovibrational transitions arising in the near and mid-infrared (IR; see references above as well as Habart et al. 2004). In this Letter, we present an analysis of the first far-ultraviolet fluorescent emission spectra of the electronic transitions of H2 in Orion, obtained by the (). These spectra have been presented by Murthy et al. (2005), in work focusing on the dust scattering properties of the region. The spectra show a dust scattered continuum, onto which absorption and emission features of H2 are identified.
Molecular hydrogen can be excited into upper rovibrational levels via fluorescent excitation by ultraviolet (UV) photons, non-thermal electrons, and collisionally (thermally), by shocks. In a gas-rich region that contains outflows from young stars and an intense ultraviolet radiation field produced by O and B stars, it seems likely that multiple processes are at work. Near-IR observations of H2 in Orion have been used to distinguish which of these excitation mechanisms are consistent with the observed emission (Luhman et al., 1994; Kristensen et al., 2003). These observations do not rule out the possibility of a contribution from shocks, however they provide solid evidence for UV fluorescence in Orion.
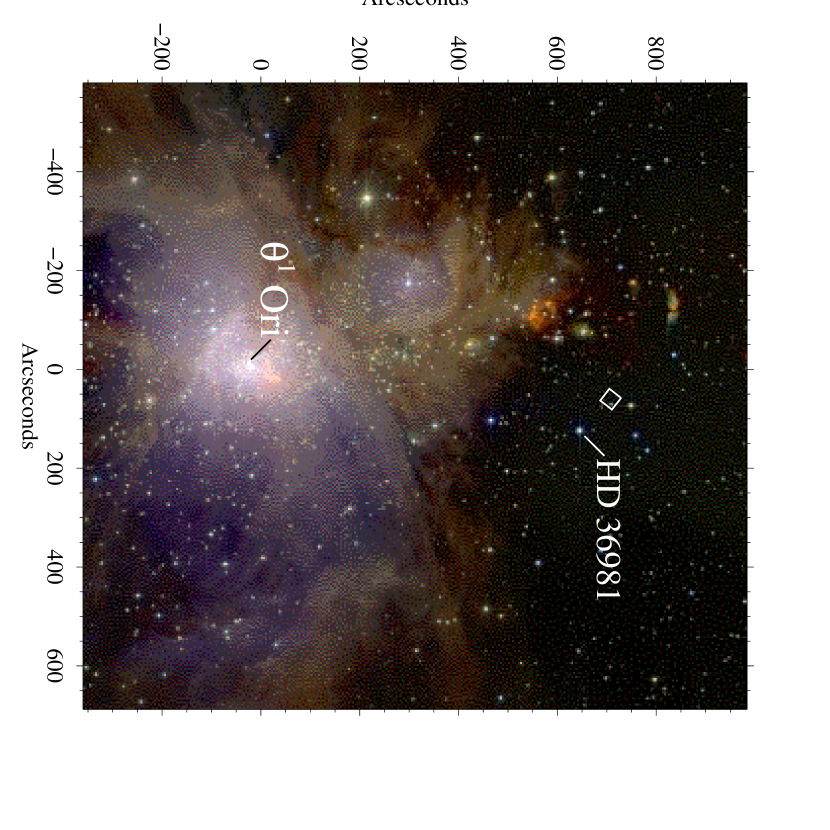
In §2, we present the data obtained during a serendipitous pointing equilibration observation (see Murthy et al. (2005) for a comprehensive description of the observations). Murthy et al. (2005) find that the dust scattered light is dominated by the intense radiation field of Ori C (HD 37022; O6V Maiz-Apellaniz et al. 2004), despite the small angular separation of the observed field from HD 36981 (B5V) . Given its intense far-UV output, Ori C is likely to be the dominant source of excitation for the H2 emission observed in Orion. A model of the H2 fluorescnce, using the unattenuated continuum of Ori C as the excitation source, is described in §3; that model is compared to the observations in §4. These observations provide evidence that UV excitation gives rise to the observed near-IR emission lines in the Orion Nebula region, in agreement with the findings of Luhman et al. (1994).
2. Observations and Analysis
The diffuse region of the Orion Nebula located at RA = 05h35m12.43s, = -05∘11′35.3″, J2000, was observed by for 16.7 ks in time-tagged (TTAG) mode on 2001 November 26 as part of the S405 channel realignment program described by Murthy & Sahnow (2004) and Murthy et al. (2005). Nebular spectra were acquired across the bandpass (905 – 1187 Å) in the (30″ 30″) LWRS aperture (Figure 1). Descriptions of the instrument and on-orbit performance characteristics can be found in Moos et al. (2000) and Sahnow et al. (2000). The spectra were obtained from the Multi-Mission Archive at STScI (MAST), and were analyzed with the original CalFUSE calibration (version 1.8.7). The calibrated data files for each orbit were then coadded using IDL software and the individual channels were combined using a cross-correlation algorithm. The exact pointing was determined by comparing Fine Error Sensor (FES) images with images generated by sky simulator software.
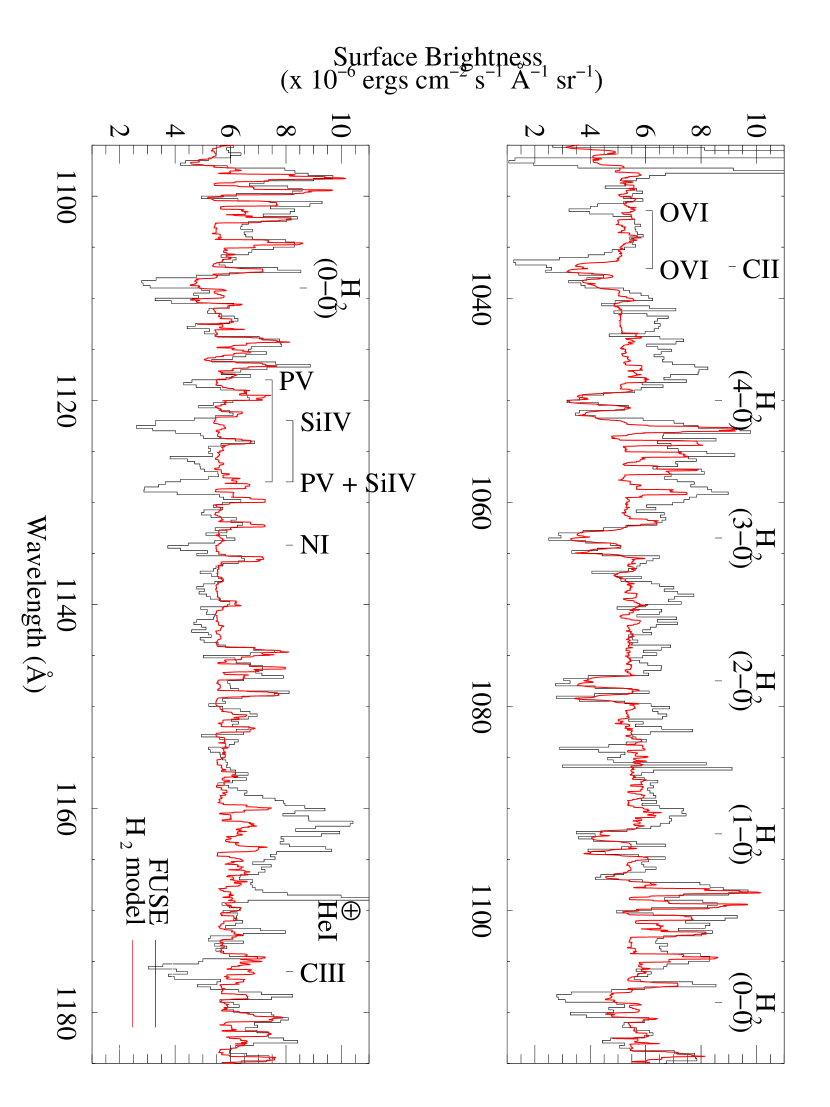
We present the S4054601 spectra at wavelengths longer than Ly- (Figure 2), where the bulk of the far-UV emission from H2 resides. In addition to the numerous absorption lines coming from molecular hydrogen discussed below, we see the scattered photospheric lines from C III 977/1176, P V 1118/1128, and Si IV 1122/1128, as well as interstellar absorption from C II 1036 and N I 1135. These features are identified in Figure 2. The fact that the P V 1118 line was seen in the spectrum is probably the most conclusive argument for Ori C (as opposed to HD 36981) illuminating this region of Orion. Atomic hydrogen lines are highly contaminated by the interstellar medium and Pellerin et al. (2002) find that P V is not present in stars of spectral type later than B2V. Finally, we find an unidentified absorption feature at 1031.4 Å that we tentatively assign to blue-shifted O VI. Blue-shifted O VI absorption is seen in many stars of of this spectral type (Pellerin et al., 2002), however we cannot conclusively identify it as the 1038 component of the doublet falls in a region dominated by H2 and C II absorption.
3. Modeling Molecular Hydrogen in Orion
The ultraviolet absorption and emission features of H2 observed in Orion are seen imposed on the dust scattered continuum of Ori C (Murthy et al., 2005). A model of the nebular dust-scattering continuum is beyond the scope of this work, but we set the baseline for the molecular hydrogen by fitting the continuum with a double power-law of the form
| (1) |
scaled to the data. This simple emperical expression with of 1187 Å, yields = 0.1, = 2.0, and = 5.0. An H2 absorption spectrum was calculated using the optical depth templates (McCandliss, 2003). As the Doppler -value is uncertain, we have adopted 2 km s-1 for this diffuse region, consistent with -values observed along the line of sight to other stars in this region of Orion (Spitzer et al., 1974; Jenkins & Peimbert, 1997). With that assumption, we used the templates to fit the (4 - 0) band ( 1050 Å) and find a total = 4.7 1018 cm-2. Absorption out of the ground electro-vibrational state for the first six rotational states was considered, but most of the absorption comes from = 0 and 1. Because the absoption lines are partially filled in by the fluorescent emission (see below), the true for this line of sight is most likely greater than 4.7 1018 cm-2. This level of H2 absorption is surprising, as studies of stars in this region find a very low molecular fraction in the intervening gas (Abel et al. 2004 and references therein).
We fit the emission spectrum of H2 seen in these data using the hydrogen fluorescence model described in France et al. (2005). Using parameters for the Orion region found in the literature for and temperature, this fluorescent emission model assumes a ground electronic state population, then uses photoexcitation cross sections and an incident radiation field to calculate the rovibrational levels of the upper electronic states (predominantly and ). The molecules then return to the ground electronic state following the appropriate selection rules and branching ratios, producing the observed ultraviolet emission lines and leaving the molecules in excited rovibrational levels. Kristensen et al. (2003) imaged regions of the Orion Nebula in the near-IR rovibrational lines of H2 to determine the excitation temperature. They find a clear delineation between hot and cold zones, requiring more than one temperature component to produce a reasonable fit to the observations. We therefore adopted the rotational temperature of 390 K from Habart et al. (2004) as the cool (thermal) component and a vibrational temperature of 2500 K as representative of the hot (shocked or non-thermal) component (France et al., 2005). An = 1 1021 cm-2 (Habart et al., 2004) was used with a -value of 2 km s-1. Each of these parameters affects the resultant model spectrum differently. The model spectra change very little with for values of a few km s-1. Varying the column density changes the total emitted power, higher column density giving more output photons, but self-absorption begins to surpress discrete lines at columns greater than 5 1021 cm-2. Temperature controls both the shape and scale of the model spectra, with more levels of the ground electronic state are populated at higher temperatures.
Radiation from Ori C dominates the ambient field in this part of Orion (Murthy et al., 2005). It is most likely responsible for pumping the observed fluorescence, and should thus be used as the input field for modeling the H2 emission. This is complicated by two factors: 1) a well flux-calibrated far-UV spectrum of Ori C does not exist and 2) the majority of the absorption seen on the HD 37022 line of sight is thought to be located in intervening clouds (Bautista et al., 1995; Murthy et al., 2005). A spectrum of Ori C as observed from Earth will not be representative of that seen by the molecules in Orion. In an attempt to overcome these concerns, we chose a lightly reddened SMC star of similar spectral type (AV 243, O6V, = 0.09) from the Magellenic Cloud Atlas of Danforth et al (2002; see also Walborn et al. 2002). A simple correction for the differences between Milky Way and SMC dust was made using the computed extinction curves of Weingartner & Draine (2001), assuming the reddening of Ori C at the pointing is similar to what is observed along the HD 36981 sightline ( = 0.04). We assumed that the reddening on the AV 243 line of sight was due to equal contributions from Milky Way ( = 5.5) and SMC dust. An spectrum of Ori C (swp01394, also obtained from MAST; Bohlin & Savage 1981) was used to cross-calibrate the surrogate spectrum in the overlap region between 1150 and 1187 Å. Primary uncertainties in this approach are a lack of knowledge about the attenuation between the star and the nebula, the actual contribution from SMC and Milky Way dust, and possible calibration problems with the spectrum (Massa & Fitzpatrick, 2000). Using this incident radiation field and the parameters described above, we constructed the fluorescence spectrum (convolved with a 0.5 Å box kernel) for comparison with the data.
4. Discussion
The nebular spectra and the model described above are shown in Figure 2. The model finds satisfactory qualitative agreement with the relative line strengths seen in the spectra between Ly- and the end of the bandpass. We find effects similar to those seen in far-UV spectra of the emission/reflection nebula IC 63, namely that the observed H2 emission lines are seen to be broader than what is expected from the instrumental profile for these filled aperture observations (France et al., 2005). A study of the possible mechanisms that would produce this broadening is underway. The two major discrepancies that we find between the data and the relative strengths predicted by the model are in the region between 1040 – 1050 Å, and the band of lines centered on 1161 Å. The 1040 –1050 region may be contaminated by broad wind emission from O VI, as Ori C also shows an “excess” in this range (Murthy et al., 2005), but the exact cause is uncertain. The 1161 band seems to be sitting on a “shelf” that is not predicted by the model. One hypothesis that we explored was the possibility of hot H2 (T 2500 K) being fluoresced by nebular Ly-, as is seen in the far-UV spectra of pre-main-sequence stars (Wilkinson et al., 2002) and accreting binary systems (Wood & Karovska, 2004). In order to test this theory, we added a linear continuum that extended the excitation spectrum to 1300 Å and a Gaussian emission line at Ly-. This additional excitation out of excited states of H2 does not resolve our problem with the 1161 band. We find that as the 1161 band begins to fill in that numerous other lines are predicted that we do not observe in the spectra. The most likely conclusion is that our model is lacking some physical mechanism that gives rise to these features.
The model does not agree with the observed absolute flux. We find that in order to correctly predict the observed absolute flux, our model output needs to be scaled up by a factor of two. We attribute this to three possible causes: 1) an uncertainty in the degree of H2 clumping in this region, 2) an uncertainty of the true strength of the exciting radiation field, and 3) the (unknown) mechanism that causes discrepancies at 1045 and 1161 Å. Dust and molecular hydrogen are known to be found in clumpy and/or filamentary structures in regions where hot stars interact with their surroundings (O’Dell, 2000; Kristensen et al., 2003; France et al., 2004), however we find this explanation unlikely. Creating similar models at higher column densities shows that while the overall emitted power increases with column, the majority of this extra emission is located outside of the bandpass ( 1200 Å). The second possibility is that our input excitation field does not accurately represent the local absolute radiation field. We feel confident that the spectral characteristics of the input spectrum are good based on the relative agreement with the H2 emission spectrum, but are less confident in the absolute scale. Changes in our reddening assumptions, absolute calibration of the spectrum we used (Massa & Fitzpatrick, 2000), and uncertainties in the nebular distance/geometry can easily explain the scaling required. Finally, further modeling efforts are underway to resolve the problems described above.
The molecular hydrogen absorption lines present in the spectra also show an interesting behavior. One would expect, based on the decreasing oscillator strengths (McCandliss, 2003), that the lines would be shallower during the progression to smaller vibrational transitions (4 – 0 to 0 – 0, shown in Figure 2). We find that the absorption profiles are of almost identical depth in each of the bands. We attribute this to a filling effect by the emission from H2 where the emitting and absorbing transitions overlap. There are a greater number of emitting transitions overlapping with the absorption lines at shorter wavelengths, so fitting the absorption lines at the (4 – 0) band leads to an under prediction of the strength of the lines in the longer wavelength bands of molecular hydrogen. This finding leads us to stress that meaningful column densities cannot be determined without correcting for the emission lines and properly addressing the dust scattering to set the continuum level.
There has been uncertainty in the degree to which shocks or ultraviolet photo-excitation leads to the observed near-IR lines of molecular hydrogen seen in Orion (Burton et al., 1989; Luhman et al., 1994; Kristensen et al., 2003). These data rule out models that consider only shocks as the mechanism producing the near-IR emission. Shocks cannot populate the excited electronic states of molecular hydrogen that give rise to the emission lines seen (Shull & Beckwith, 1982). Hydrogen molecules will be dissociated by collisions at temperatures greater than roughly 4000 K, thus they would be destroyed before reaching temperatures sufficient to begin populating the first excited electronic state, (E 11 eV). These data cannot exclude shocks from making a contribution to the near-IR H2 emission (Kristensen et al., 2003), but ultraviolet excitation clearly contributes to the rovibrationally excited population of hydrogen molecules in the Orion Nebula.
References
- Abel et al. (2004) Abel, N. P., Brogan, C. L., Ferland, G. J., O’Dell, C. R., Shaw, G., & Troland, T. H. 2004, ApJ, 609, 247
- Bautista et al. (1995) Bautista, M. A., Pogge, R. W., & Depoy, D. L. 1995, ApJ, 452, 685
- Bohlin & Savage (1981) Bohlin, R. C. & Savage, B. D. 1981, ApJ, 249, 109
- Burton et al. (1989) Burton, M. G., Brand, P. W. J. L., Geballe, T. R., & Webster, A. S. 1989, MNRAS, 236, 409
- Danforth et al. (2002) Danforth, C. W., Howk, J. C., Fullerton, A. W., Blair, W. P., & Sembach, K. R. 2002, ApJS, 139, 81
- France et al. (2005) France, K., Andersson, B.-G., McCandliss, S. R., & Feldman, P. D. 2005, ApJ
- France et al. (2004) France, K., McCandliss, S. R., Burgh, E. B., & Feldman, P. D. 2004, ApJ, 616, 257
- Habart et al. (2004) Habart, E., Boulanger, F., Verstraete, L., Walmsley, C. M., & Pineau des Forêts, G. 2004, A&A, 414, 531
- Jenkins & Peimbert (1997) Jenkins, E. B. & Peimbert, A. 1997, ApJ, 477, 265
- Kristensen et al. (2003) Kristensen, L. E., Gustafsson, M., Field, D., Callejo, G., Lemaire, J. L., Vannier, L., & Pineau des Forêts, G. 2003, A&A, 412, 727
- Luhman et al. (1994) Luhman, M. L., Jaffe, D. T., Keller, L. D., & Pak, S. 1994, ApJ, 436, L185
- Maíz-Apellániz et al. (2004) Maíz-Apellániz, J., Walborn, N. R., Galué, H. Á., & Wei, L. H. 2004, ApJS, 151, 103
- Massa & Fitzpatrick (2000) Massa, D. & Fitzpatrick, E. L. 2000, ApJS, 126, 517
- McCandliss (2003) McCandliss, S. R. 2003, PASP, 115, 651
- Moos (2000) Moos, H. W. et al. 2000, ApJ, 538, L1
- Murthy & Sahnow (2004) Murthy, J. & Sahnow, D. J. 2004, ApJ, 615, 315
- Murthy et al. (2005) Murthy, J., Sahnow, D. J., & Henry, R. C. 2005, ApJ, 618, 99
- O’Dell (2000) O’Dell, C. R. 2000, AJ, 119, 2311
- Pellerin et al. (2002) Pellerin, A., Fullerton, A. W., Robert, C., Howk, J. C., Hutchings, J. B., Walborn, N. R., Bianchi, L., Crowther, P. A., & Sonneborn, G. 2002, ApJS, 143, 159
- Rachford et al. (2002) Rachford, B. L., Snow, T. P., Tumlinson, J., Shull, J. M., Blair, W. P., Ferlet, R., Friedman, S. D., Gry, C., Jenkins, E. B., Morton, D. C., Savage, B. D., Sonnentrucker, P., Vidal-Madjar, A., Welty, D. E., & York, D. G. 2002, ApJ, 577, 221
- Sahnow (2000) Sahnow, D. J. et al. 2000, ApJ, 538, L7
- Shull & Beckwith (1982) Shull, M. & Beckwith, S. 1982, Annual Reviews of Astronomy and Astrophysics, 30, 163
- Spitzer et al. (1974) Spitzer, L., Cochran, W. D., & Hirshfeld, A. 1974, ApJS, 28, 373
- Walborn et al. (2002) Walborn, N. R., Fullerton, A. W., Crowther, P. A., Bianchi, L., Hutchings, J. B., Pellerin, A., Sonneborn, G., & Willis, A. J. 2002, ApJS, 141, 443
- Weingartner & Draine (2001) Weingartner, J. C. & Draine, B. T. 2001, ApJ, 548, 296
- Wilkinson et al. (2002) Wilkinson, E., Harper, G. M., Brown, A., & Herczeg, G. J. 2002, AJ, 124, 1077
- Wood & Karovska (2004) Wood, B. E. & Karovska, M. 2004, ApJ, 601, 502