HST Imaging of MEGA Microlensing Candidates in M31111 Based on observations made 1) with the NASA/ESA , obtained at STScI, which is operated by AURA, Inc., under NASA contract NAS 5-26555. These observations are associated with program #10273, 2) with the INT operated on La Palma by the ING in the Spanish ORM of the IAC, 3) at KPNO, NOAO, which is operated by AURA, Inc., under cooperative agreement with the NSF.
Abstract
We investigate /ACS and WFPC2 images at the positions of five candidate microlensing events from a large survey of variability in M31 (MEGA). Three closely match unresolved sources, and two produce only flux upper limits. All are confined to regions of the color-magnitude diagram where stellar variability is unlikely to be easily confused with microlensing. Red variable stars cannot explain these events (although background supernova are possible for two). If these lenses arise in M31’s halo, they are due to masses (95% certainty, for a -function mass distribution), brown dwarfs for disk lenses, and stellar masses for bulge lenses.
1 Introduction
Galaxian dark matter has been recognized for over 70 years (Zwicky 1933), and tied in part to the halo for over 30 (Rubin & Ford 1970). Halo dark matter’s nature is still a mystery. Gravitational microlensing can reveal individual dark matter objects of roughly stellar mass (Paczyński 1986). To test this, MACHO observed the Magellanic Clouds for 5.7 years, (Alcock et al. 2000) and EROS (Afonso et al. 2003) did so for 5. The former report microlensing events more common than the known, purely stellar expectation, with lensing fraction % of the dark matter halo mass (8-50%, with 95% confidence) of 0.4 masses. EROS found consistent with zero (but marginally consistent with %).
M31 microlensing could potentially settle this quandary definitively (Crotts 1992). Since we can explore microlensing across the face of M31, we can use this distribution to distinguish where in the galaxy the lenses arise. Several surveys of M31 microlensing (Riffeser et al. 2003, Joshi et al. 2004, Calchi-Novati et al. 2005, including MEGA: de Jong et al. 2004 and its predecessor VATT-Columbia: Uglesich et al. 2004), together report 20 probable microlensing events, and have a tendency to confirm the MACHO result.
With its crowded target stars, M31 microlensing relies on image subtraction to reveal event lightcurves, which removes the baseline flux. Using to recover the source flux (e.g. Ansari et al. 1999, Aurière et al. 2001), one can compute event amplification, hence Einstein parameters, constraining physical parameters e.g., lens mass. MEGA and VATT-Columbia also use source star color to distinguish microlensing from variable stars, since very red variables (miras and semiregulars) produce outbursts that, with their baselines subtracted, mimic point-source, point-lens (“Paczyński”) light curves (Uglesich et al. 2004). Residual flux from these events, however, is redder than almost all potential microlensing source stars. MEGA will soon publish its microlensing sample, and now is an excellent opportunity to check these event selection criteria.
2 Observations and analysis
To study candidate events we appeal to superior angular resolution: 160 ACS and WFPC2 images, taken in F555W and F814W filters in 16 orbits, cover 0.17 deg2, 30% of the MEGA field. Here we study the largest sample of candidate microlensing events, the INT/WFC subsample of MEGA (de Jong et al. 2005), in order to understand and improve ground-based selection criteria.
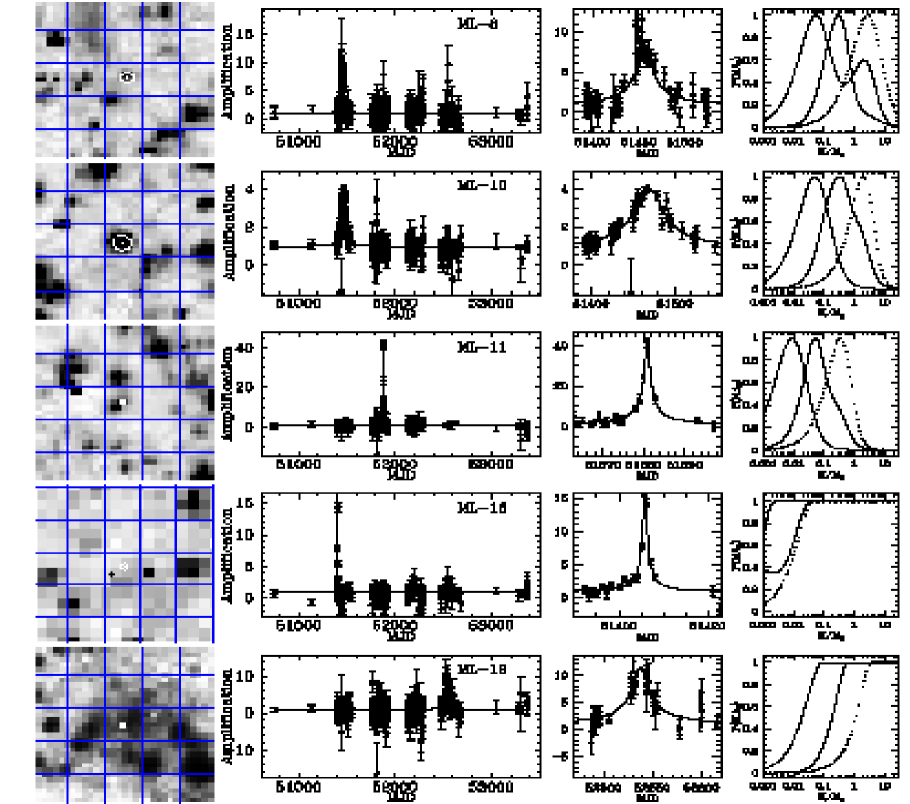
The analysis used is detailed by Cseresnjes et al. (in preparation). We carefully align the and ground-based images by matching catalogs of ground-based versus Gaussian-convolved sources for each filter combination (, F555W/F814W versus INT, and KPNO 4m, R/I), providing up to 8 different position estimates. For a given ground-based position, the two independent positions (via F555W and F814W) always agree to (typically ), so positional accuracy depends mainly on ground-based data. The adopted position is a weighted average of individual estimates (Fig. 1). The spread of different estimates for each event are to . Of five microlensing candidates analyzed, we identify three sources and find flux upper limits for two.
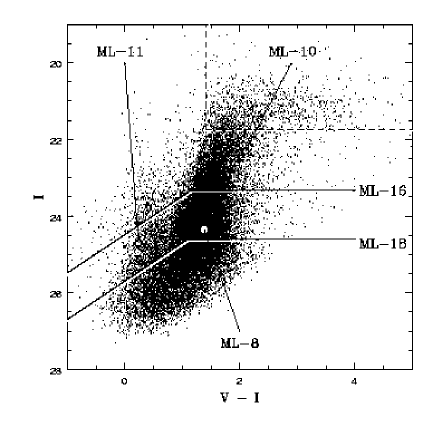
data were photometered with DAOPHOT (Stetson 1987), as prescribed in Sirianni et al. (2005). The locations of the candidate microlensing sources on a color-magnitude diagram are shown in Fig. 2. For each candidate event, we normalized the differential light curves to R-fluxes, using color-magnitude diagrams and baseline fluxes (for the two undetected events, using the baseline flux upper limit), then performed a Paczynski fit in () to the combined light curve (Fig. 1). For the two undetected events, the resulting corresponds to a lower limit.
Only the Einstein time-scale () constrains lens characteristics, particularly its mass . For a given time-scale , the lens-mass probability distribution is , where is the event rate Griest (1991). We consider alternatively a lens located in the halo of M31, in the disk or in the bulge. For halo lensing, we consider the simple case where the lens is part of a spherical isothermal halo composed of single mass objects, with a density distribution defined as
| (1) |
where is the radial distance to the center of M31, and is a core radius of kpc. The one-dimensional velocity dispersion of the lenses is set to km s-1, consistent with a rotation curve of km s-1. The disk is modelled by a double exponential with a radial scale length of kpc and a vertical scale length of pc. The bulge corresponds to the “small” bulge model of Kent (1989), with a velocity dispersion of km s-1. More details about the model can be found in Baltz, Gyuk, & Crotts (2003).
3 Individual events
| id | ML-8 | ML-10 | ML-11 (S4) | ML-16 (N1) | ML-18 |
|---|---|---|---|---|---|
| R.A. (J2000) | 00:43:24.53 | 00:43:54.87 | 00:42:29.90 | 00:42:51.22 | 00:43:17.27 |
| Declination (J2000) | 41:37:50.4 | 41:10:33.3 | 40:53:45.6 | 41:23:55.3 | 41:02:13.7 |
| Rhst | |||||
| Ihst | 23.32 | 24.59 | |||
| (R-I) | 0.60 | 1.05 | 0.15 | – | – |
| (R-I) | 0.59 | 1.05 | 0.21 | – | 0.51 |
| 8.49 | 4.00 | 41.93 | 16.01 | 11.42 | |
| /day | 6.9 | 86.6 | |||
| 0.89 | 1.26 | 1.01 | 1.29 | 1.04 | |
| aamost likely lens mass (with 1 confidence intervals) | |||||
| aamost likely lens mass (with 1 confidence intervals) | |||||
| aamost likely lens mass (with 1 confidence intervals) | |||||
| comment | red clump or SN | giant branch | very blue | undetected(?) | in cluster or galaxy |
ML-8:
this event’s position lands within the FWHM of a red clump star’s image,
with in
excellent agreement with the peak flux’s color in
differential light curves ( vs. mag).
With the baseline set
to this star’s flux, a Paczynski fit yields amplification ,
an Einstein time-scale days. The corresponding
lens masses are for a halo lens,
for a disk lens, and
for a bulge lens.
However, this event lands from the center
of a background
galaxy (subtending ).
Its color, flux and decline rate are consistent with a Type Ia supernova at
, with mag extinction (see Johnson & Crotts 2005).
One must balance the number of SNe ( y-1 deg-2 e.g., Woods
& Loeb 1998) landing within the FWHM disk of a source star of consistent
color we would detect
(1.2 arcsec-2) versus the number of microlensing events (evidently
5) landing so close to an galaxy (100 arcmin-2 — Huang et
al. 2001).
The expected number of both kind of events are of the order of a few tenths,
with perhaps microlensing being slightly more likely.
ML-10: this event lands within the FWHM disk of a giant branch star of color , in perfect agreement with the microlensing data. This source has and days, corresponding to a halo lens mass , a disk lens mass , or a bulge lens mass . It lands suspiciously close to a region of the CMD common to variables. Still, the achromaticity of the variation, the well-fit and well-sampled peak (), and the stability of the baseline over seasons strongly indicate a real microlensing event.
ML-11: this event lands on a faint blue star () severely blended with a red clump star. The light curves fit yields a similar . Its baseline flux implies and days. This event, from Paulin-Henriksson et al. (2002), is near M32, suggesting that the lens resides there. If not, the most likely lens mass is in the halo, in the disk, and in the bulge.
ML-16:
this event lands
in a WFPC2 field and was also seen by POINT-AGAPE (Aurière et al. 2001).
They publish a color for the event peak based on INT g′ and
r′ (no i′ data are available), corresponding to
V-I .
We find no detected source at this position; the nearest detected star
landing away (one WFPC2 pixel) with .
Using the flux of this star as an upper limit, we find ,
days,
and being poorly constrained for a halo lens.
Aurière et al. (2001) seem to have isolated a different source
star. Their celestial coordinates disagree with ours by , but
cannot be checked from published data since no image of the source field
is provided. In order to check our astrometry, we repeated the procedure
we applied to r′ data to g′ data retrieved from the INT
archive. We also repeated the same procedure (for both r′ and
g′ data) using the WFPC2 images taken by Aurière et al
from the archive. Finally,
one of us (A.C.) made an independent check by choosing bright
unsaturated, isolated stars as coordinate inputs to IRAF geomap
to construct the coordinate transform. These various estimates agree to
better than pixel in the INT data, whereas the nearest star (two
of them actually) with consistent colors and magnitudes to that claimed
by Aurière et al. are (or almost two INT pixels) away. Our
position is marginally consistent with the faint source cited above and in
Table 1, but inconsistent with that of Aurière et al.
ML-18: this event lands in a bright region, perhaps a cluster or background galaxy. We isolate no source here, so provide only an upper limit baseline flux, estimated by taking the brightest pixel within and considering that it contains at most of the source flux, as constrained by the point-spread function for ACS. With this flux limit, , days, and for a halo lens, for a disk lens, and for a bulge lens.
4 Conclusions
Of five events in our fields, we find three likely matches, and baseline flux upper limits on the other two. Colors of the three identified sources agree with those obtained from their differential light curves alone. The two upper limits displace these events from the asymtotic giant branch, where confusing mira and semiregular variables can occur. No candidate is a bright red variable. One might interpret ML-8 as a supernova, but a microlensing event is just as probable. We also cannot rule out a supernova as the source for ML-18, which might also coincide with a background galaxy. In a future paper, the complete MEGA data set will fill out ML-18’s light curve; unfortunately, we have no additional data on ML-8.
Taking the product of the individual mass probability distributions obtained for each event, these lenses in a halo model (Baltz, Gyuk & Crotts 2003) of a single component mass are constrained to at the 95% level. M31 microlensing rates may be consistent with pure self-lensing (de Jong et al. 2005), so we consider bulge lenses (), or disk lenses which correspond to probably unrealistic brown dwarf masses ().
We acknowledge support from STScI (GO 10273) and NSF (grants 0406970 and 0070882).
References
- (1) Afonso, C. et al. 2003, A&A, 400, 951
- (2) Alcock, C. et al. 2000, ApJ, 542, 281
- Ansari et al. (1999) Ansari, R., et al., 1999, A&A, 344, L49
- Aurière et al. (2001) Aurière, M., et al., 2001, ApJL, 553, L137
- Baltz et al. (2003) Baltz, E.A., Gyuk, G. & Crotts, A. 2003, ApJ, 582, 30
- Brown et al. (2004) Brown, T., et al., 2004, AJ, 127, 2738
- (7) Calchi Novati, S. et al. 2005, preprint
- (8) Crotts, A. 1992, ApJ, 399, L43
- Griest (1991) Griest, K., 1991, ApJ, 366, 412
- (10) de Jong, J.T.A. et al. 2004, A&A, 417, 461
- (11) de Jong, J.T.A. et al. 2005, A&A, in press
- Huang et al. (2001) Huang, J.-S., et al., 2001, A&A, 368, 787
- (13) Johnson, B. & Crotts, A. 2005, AJ, in press
- (14) Joshi, Y.C., Pandey, A.K., Narasimha & Sagar, R. 2004, astro-ph/0412550
- (15) Paczyński, B. 1986, 302, 1
- Paulin-Henriksson et al. (2002) Paulin-Henriksson, S., et al., 2002, ApJL, 576, 121
- (17) Riffeser, A., Fliri, J., Bender, R., Seitz, S. & Gössl, C.A. 2003, ApJ, 599, L17
- (18) Rubin, V.C. & Ford, W.K. 1970, ApJ, 159, 379
- (19) Sirianni, M., et al., 2005, PASP, in press
- (20) Stetson, P., 1987, PASP, 99, 191
- (21) Uglesich, R., Crotts, A.P.S., Baltz, E., de Jong, J., Boyle, R. & Corbally, C. 2004, ApJ, 612, 877
- Woods & Loeb (1998) Woods, E. & Loeb, A., 1998, ApJ, 508, 760
- Zwicky (1933) Zwicky, F., 1933, Helvetica Physica Acta, 6, 110