Spectroscopic Observations and Analysis of the Unusual Type Ia SN 1999ac
Abstract
We present optical spectra of the peculiar Type Ia supernova (SN Ia) 1999ac. The data extend from to days with respect to B-band maximum and reveal an event that is unusual in several respects. Prior to B-band maximum, the spectra resemble those of SN 1999aa, a slowly declining event, but possess stronger Si II and Ca II signatures (more characteristic of a spectroscopically normal SN). Spectra after B-band maximum appear more normal. The expansion velocities inferred from the Iron lines appear to be lower than average; whereas, the expansion velocity inferred from Calcium H and K are higher than average. The expansion velocities inferred from Si II are among the slowest ever observed, though SN 1999ac is not particularly dim. The analysis of the parameters Si II, Si II, , and further underlines the unique characteristics of SN 1999ac. We find convincing evidence of C II 6580 in the day spectrum with ejection velocity km s-1, but this signature disappears by day . This rapid evolution at early times highlights the importance of extremely early-time spectroscopy.
1 Introduction
Our understanding on the nature of Type Ia Supernovae (SNe Ia) would be greatly enhanced with the availability of high-quality spectra at very early phases (the first week or so after the explosion). At early phases, the ejecta is denser and observations probe the faster moving outer layers of the explosion (Ruiz-Lapuente et al., 1992; Khokhlov, 1991). The diversity in Type Ia Supernova spectra is greatest at this time. At later phases, the ejecta thins, we probe deeper into the slower moving layers of the explosion and SN Ia spectra become more homogeneous.
Mapping the composition of SN Ia ejecta at high velocity leverages direct constraints placed on explosion models. Such constraints include identifying the presence of ion signatures in SN spectra at various velocity intervals, a nontrivial task since the corresponding line profiles are often heavily blended. In particular, the presence of carbon at high velocity is consistent with a one-dimensional deflagration model (Nomoto et al., 1984; Branch et al., 1985). Silicon-peak elements at high velocity are more consistent with, for example, a one-dimensional delayed-detonation model (Khokhlov, 1991). The signature of unburned material at a variety of velocities discovered across a sample of SNe Ia may support more recent three-dimensional deflagration models (Reinecke et al., 2002; Gamezo et al., 2003).
However, the task of obtaining early phase spectra presents numerous logistical challenges. Efficient discovery of SNe very shortly after explosion requires both high sensitivity and reliable rejection of false positives. A spectrum for confirmation (that a candidate is a SN) and classification must be obtained within a day. A program for intensive followup may then be triggered, requiring coordination of limited telescope time at possibly several different sites. Seeking to augment the local SN Ia dataset used as calibrated candles for cosmological distance measurement (Perlmutter et al., 1998; Garnavich et al., 1998; Schmidt et al., 1998; Riess et al., 1998; Perlmutter et al., 1999; Knop et al., 2003; Tonry et al., 2003; Riess et al., 2004), the Supernova Cosmology Project (SCP) organized such a program together with several other teams (Aldering, 2000) which ran during the Spring of 1999. When SN 1999ac was reported (Modjaz et al., 1999), the SCP had many telescope nights pre-scheduled for spectroscopy and photometry to observe this bright event. As a result, some of the earliest observed spectra of a SN Ia were obtained.
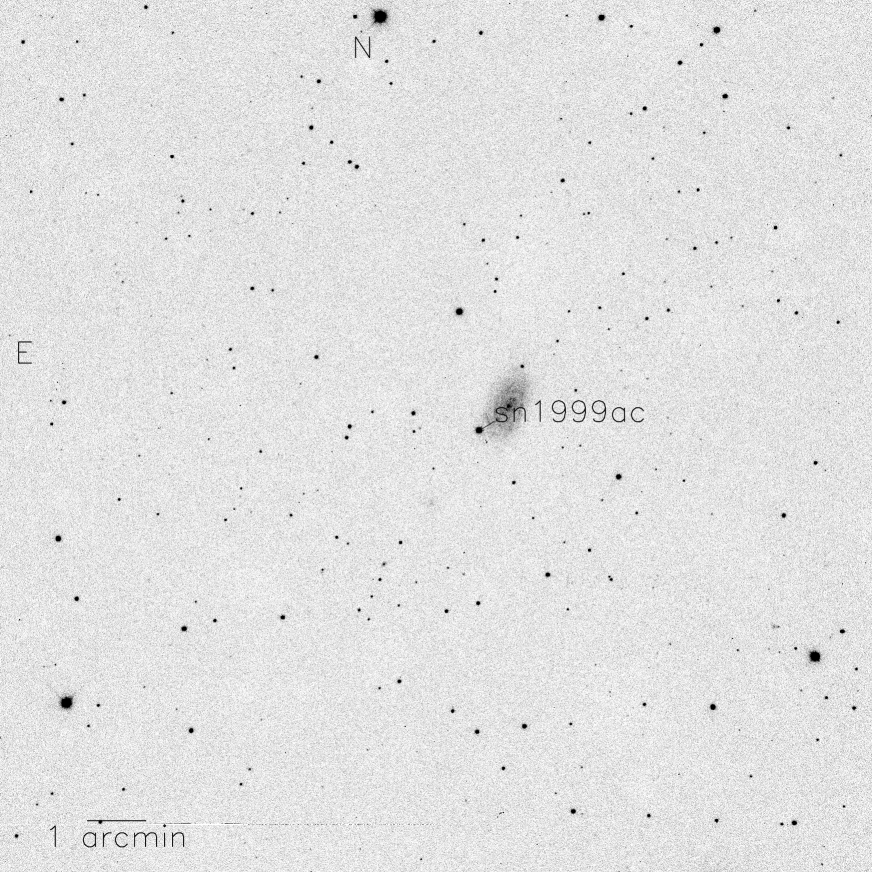
SN 1999ac (R.A. = 16h07m15.0s Decl. = +07d5820, equinox 2000.0) was discovered and confirmed on unfiltered observations taken on Feb. 26.5 and 27.5 UT at 23".9 east and 29".8 south of the nucleus of its Scd host galaxy, NGC 6063 (Modjaz et al., 1999). Phillips et al. (1999a) reports that a confirmation spectrum taken on Feb. 28 UT is similar to that SN 1999aa with stronger Si II 6355 and well defined Ca II H&K. Optical light curves of SN 1999ac have been discussed in Phillips et al. (2002) and Li et al. (2003). They report a B-band light curve similar to that of SN 2002cx raising as fast as SN 1991T and declining similarly to SN 1994D until two weeks after maximum. The V-band light curve of SN 1999ac closely resembles that of SN 2002cx until 30 days after maximum light. The similarities between SN 1999ac and SN 2002cx break down in R and I bands.
SN 1999ac was found to be spectroscopically similar to SN 1999aa (Li et al., 2001b; Garavini et al., 2004), which is considered to be an “intermediate” SN Ia with properties “between” those of spectroscopically normal SNe Ia and those of the spectroscopically peculiar, bright SN 1991T (for a discussion of whether or not this has implications for progenitor channels, consult Li et al., 2001b; Branch, 2001). However, as we will show in this paper, the peculiarities of SN 1999ac are not limited to early epochs. The study of the ejecta geometry indicates calcium lines being formed in high velocity layers and iron and silicon lines being formed in low velocity layers. Furthermore, when SN 1999ac is plotted in the parameter space of Si II, Si II, , and it stands out as an outlier among other well studied SNe.
Here we present the collected spectra (our photometry of this SN will appear in a later work) and discuss in detail the two earliest spectra taken at days and with respect to the date of maximum brightness. The organization of this article is as follows. In §2, a description of the reduction scheme is given. Section §3 presents the spectra of SN 1999ac, and includes some empirical analysis of the early time spectra. Fits to the early spectra produced with the SN spectrum synthesis code SYNOW appear in §4. A study of the ejecta geometry is carried out in §5 and a comparison of several spectral indicators with those of other objects in §6 and §7 concludes the article.
2 Data & Reduction
Figure 1 shows the position of SN 1999ac in its host galaxy NGC 6063, an Scd galaxy with a recession velocity of 2848 km s-1 as determined from narrow H emission (Theureau et al., 1998). All spectra presented in this paper have been shifted to rest frame using this recession velocity.
The data set consists of 14 optical spectra extending from day to day (in this work all phases are expressed with respect to B-band maximum). In most cases, the spectra were acquired using different instrumental settings for the blue and red parts of the spectrum to avoid possible second-order contamination. Hence, the fully reduced 14 spectra are the combinations of both blue and red parts. The observation log appears in Table 1.
The data were reduced using standard IRAF routines. The two-dimensional images were bias-subtracted and flat-fielded. The sky background was fitted, subtracted, and extracted for systematics checks on the wavelength calibration. Wavelength and flux calibration were applied to the one-dimensional extracted spectra using calibration observations taken with the same instrumental setting and during the same night as science observations. The accuracy of the wavelength calibration was checked against the extracted sky spectra and generally found to agree to within 2 Å. Synthetic spectrophotometry was computed to check the overall accuracy of the flux calibration against the publicly available photometric data (Jha, 2002) and found to agree within the quoted statistical uncertainties. An atmospheric extinction correction was applied via tabulated extinction coefficients for each telescope used.
Galactic reddening in the direction of SN 1999ac was estimated following Schlegel et al. (1998). A value of mag was found. For host galaxy extinction, Phillips et al. (2002) found that SN 1999ac’s photometric evolution does not follow the Lira-Phillips relation (Phillips et al., 1999b), making problematic an estimate of host galaxy extinction with this technique. Labbe (2001) tentatively derive a total extinction to SN 1999ac of mag. All spectra of SN 1999ac were corrected for Galactic extinction assuming , i.e. (Cardelli et al., 1989) but no attempt was made to correct for host galaxy extinction correction because of the mentioned uncertainties in its estimate. This has no impact on the analysis presented, since we focus our analysis on line profiles, which cover wavelength scales smaller than those affected by reddening. For a given line profile, the effect of reddening can be considered as a global flux offset.
The amount of host galaxy light contamination was estimated by -fit of the data with a SN spectrum template. It was found to be negligible at all epochs, and hence no subtraction of host galaxy light beyond that included in the sky background reference regions was performed.
Telluric corrections are applied to spectra used for synthetic spectrum analysis, using calibration spectra from spectrophotometric standard stars in the vicinity of SN 1999ac. The wavelength regions with telluric corrections are marked in the figures, and their effect can be seen by comparing Figure 2 with Figure 4, which show the spectra after telluric correction.
3 Spectra
The timespan and sampling frequency of the data set permits study of the spectroscopic evolution of SN 1999ac from very soon after explosion to seven weeks beyond B-band maximum light. Figure 2 presents the 14 fully reduced spectra, along with phases of observation for each. The top spectrum, taken at day , is one of the earliest ever obtained of a SN Ia.
The two earliest spectra are relatively featureless, though they clearly show the ion signatures of a SN Ia. The more obvious absorption features are at 4900, 6100, and 8100 Å; due to Fe III blends, the Si II 6355 blend, and the Ca II infrared (IR) triplet (respectively). A weak absorption at 4200 Å is probably also due to Fe III, while Si III is responsible for a weak absorption at 4400 Å. Two very weak notches at 5200 and 5500 Å hint at the presence of the S II “W” feature. A small depression just redward of the Si II 6100 Å absorption could be due to C II. We return to this issue later in this article.
The absorptions strengthen up to about day . The Si II 6355 absorption shifts noticeably to the red during this time. After day , the Ca II IR triplet profile morphology remains roughly constant. The S II “W” feature strengthens at maximum light, but shortly afterward disappears as it is replaced by Fe II and Na I lines.
The absorption at 6100 Å, due to Si II 6355, changes shape between days and as Fe II lines strengthen and obliterate it through line blending. By day , four robust minima have replaced the 6100 Å absorption. Furthermore, the ostensible Si II emission peak appears to shift redward during this interval. The simplest explanation for this behavior is not a real shift per se, but rather an effect of blending, as the bluest part of the emission feature is overcome by the reddest absorption notch. It is interesting to note that Fe II lines begin contaminating the Si II feature as early as day , somewhat earlier than usual in SNe Ia.
From day onward, however, the spectrum basically does not evolve. The transition to iron-peak species dominance is complete just three weeks after maximum light, as numerous iron-peak lines dominate the spectrum from the ultraviolet to the near IR, excluding the Ca II H&K and IR triplet features.
3.1 Early-Time Comparisons
Generally, the post-maximum spectroscopic evolution of SN 1999ac resembles that of a normal SN Ia. The early-time spectra (days and ) present the unusual opportunity of comparison with the small set of supernovae with similarly early spectra.
In Figure 3, the day spectrum is presented along with early-time spectra of SNe 1991T (Filippenko et al., 1992), 1999aa (Garavini et al., 2004), 1990N (Leibundgut et al., 1991), and 1994D (Patat et al., 1996). Compared to the spectroscopically peculiar SNe 1999aa and 1991T, SN 1999ac exhibits stronger Ca II and Si II 6355 absorptions. On the other hand, its Fe III 4400, 4100 Å and Si III 4560 features are weaker.
A small flux depression in the day spectrum is clearly visible to the red of the Si II 6100 Å feature, echoing one visible in the spectrum of SN 1990N. Though made uncertain by the presence of the telluric absorption at 6900 Å, another feature at 7000 Å could be common to both spectra as well. The first feature has been identified as C II 6580 in SN 1990N (Mazzali, 2001), in SN 1994D (Hatano et al., 1999a), in SN 1998aq (Branch et al., 2003), and in SN 1999aa (Garavini et al., 2004). The second feature could be due to another line from the same ion, C II 7234.
Overall, the day spectrum resembles that of SN 1990N more than it does SN 1994D, with its more obvious (and characteristic) S II and Fe II blends. In summary, at day , SN 1999ac possess spectroscopic characteristics common to both slow-declining SNe like SN 1991T and spectroscopically normal ones like SN 1990N at a similar phase.
The day spectrum of SN 1999ac (Figure 3) does not extend to the Ca II H&K absorption. The two Fe III features are still weaker than in SN 1991T and possess rounded minima. The contribution from Fe II in the region between 4000 and 5000 Å appears weaker than in SN 1994D and in SN 1990N. The absorption feature present on the red edge of this line and that around 7000 Å at day are no longer evident.
4 Synthetic Spectra
One of the more interesting ion signatures suggested in the previous section is that of C II. The presence of carbon lines and their ejection velocities pose potential constraints on hydrodynamical explosion models. Carbon at high velocity is consistent with both one-dimensional (Nomoto et al., 1984) and three-dimensional (Reinecke et al., 2002; Gamezo et al., 2003) deflagration models. An apparently generic result from the newer models is the mixing of “fuel” (carbon and oxygen) and “ashes” (products of nucleosynthesis) at all velocities. Hence, the detection of carbon at low velocity would support the three-dimensional deflagrations.
To further explore the C II signature and its behavior at early times, in this section we compare synthetic spectra to those observed before maximum light. Clearly, the ideal approach would be to invert a SN spectrum in some way to yield a composition model. Unfortunately, the SN atmosphere problem is an ill-posed inverse problem. Instead, one of two approaches must be adopted.
One approach is detailed analysis, where the goal is to include all relevant transfer physics (nonlocal thermodynamic equilibrium rates, relativity, time-dependence, energy from radioactive decays, etc.) and numerically simulate the emergent spectrum of a given hydrodynamical model. This approach is appropriate for validating hydrodynamical models, or suggesting adjustments to such models in the future. Though powerful, detailed analysis codes (for example, the general-purpose PHOENIX code, Hauschildt & Baron, 1999) consume months of computer time for a single calculation.
Another, complimentary approach is direct analysis. The goal of direct analysis is more empirical; to constrain the presence or absence of ions in a spectrum and the ejection velocities of their parent atoms. The task is generally nontrivial, since SN spectra consist of many blends of lines which cannot be treated simplistically. Still, approximate techniques are used to make the process fast and iterative, but the results are powerful. Constraints from direct analysis are of use to both detailed modelers and explosion modelers. In the latter case, the results of direct analysis can rule out many hydrodynamical models (in principle) before the extensive simulation calculations are performed.
SYNOW (Fisher, 2000) is a direct analysis code that generates spectra based on a simple, conceptual model of a SN appropriate during the first few weeks to months after explosion. This model consists of a blackbody-emitting, sharply defined photosphere surrounded by an extended line-forming, pure scattering atmosphere. The entire envelope is assumed to be homologously expanding. Line transfer is treated using the Sobolev method (Sobolev, 1960; Castor, 1970; Jeffery & Branch, 1990) so line opacity is parameterized in terms of Sobolev optical depth. Which ions are used in the calculation is determined by experience, guided by the SN ion signatures atlas of Hatano et al. (1999b). For each ion introduced, Sobolev optical depth as a function of velocity for a “reference line” (usually a strong optical line) is specified. Optical depths in other lines of the ion are set assuming Boltzmann excitation of the levels at temperature .
The parameters and set the velocity and blackbody continuum temperature of the photosphere, respectively. For each ion, the optical depth at the minimum ejection velocity is specified. Optical depth scales exponentially with velocity according to the -folding velocity parameter , and is considered to be zero for velocity greater than . If for an ion, we refer to the ion as “detached.”
A sharply defined, blackbody-emitting photosphere clearly cannot serve as a perfect substitute for the processes of continuum formation in a SN atmosphere. Hence, the synthesized continuum level may systematically differ from that observed in some wavelength regions. Generally, a good fit to the blue continuum results in a brighter red synthetic continuum. This effect has little to no bearing on line identifications or velocity inferences.
Day
Figure 4 is a comparison of a synthetic spectrum to the observed spectrum at day . Choosing K reproduces a satisfactory reproduction of the overall continuum shape. We also find that the choice of km s-1 assists in producing reasonable line profiles when other factors are taken into account for each individual ion.
The Si II optical depth profiles are detached, with km s-1. This detachment moves the synthetic Si II 6355 absorption higher in velocity space so that it matches the observed feature. It also flattens the corresponding emission feature to improve the agreement. We regard the presence of Si II in this spectrum as definite.
Si III optical depth must be capped at km s-1 to match the feature usually associated with it at 4400 Å. Interestingly, a concomitant synthetic feature appears to reproduce a feature in the near-infrared around 9000 Å. Though the fit is not perfect here, we regard the presence of Si III in this spectrum as definite.
The velocity range in which we introduce Ca II is mainly constrained by the Ca II IR triplet since the H&K component is missing from the data. Nevertheless, the agreement with the observed Ca II IR triplet and the falling edge of the observable H&K signature is convincing. The presence of Ca II in this spectrum is definite.
Introducing Fe III provides a match to two observed features, one at 4200 Å and another at 4900 Å. Like Si II, the corresponding optical depth profile must be detached (in this case to km s-1) to reproduce the features. Adding some Mg II improves the fit to the absorption at 4200 Å. The presence of Fe III is definite.
As previously mentioned, the characteristic S II feature does not yet appear to be fully developed at phase days. Including some S II optical depth produces an absorption blend around 5300 Å. Generally, however, fits to the S II blend region using SYNOW do not reproduce the observed features in most cases. Our fit in this region is not optimal, nevertheless, we regard the presence of S II in the day spectrum as probable.
It is interesting that including some Ni III to the synthetic spectrum helps to account for the flux deficit to the blue of the Fe III 4900 Å feature and near 5300 Å. The appearance of this ion in a spectrum is somewhat unusual, nevertheless the improvement cannot be discounted. Conservately, however, we regard the presence of Ni III as possible.
The weak absorption at 6300 Å is well matched by a detached C II (v km s-1) that may also contribute to a feature near 4500Å and perhaps at 7000 Å. The wavelength regions where C II makes its contribution are highlighted in Figure 5 showing the effect of the presence of this ion on the synthetic spectrum. The good matching of the absorption feature at 6300 Å and the possible contribution near 4500 Å makes the identification of C II definite in the day spectrum.
We have considered C III to match the small notch on the red side of the Si III feature near 4500 Å. However, we find the evidence for C III less convincing than that for C II. The small optical depth used to generate the C III feature prevents the appearance of other, weaker C III lines in the synthetic spectrum. Hence, the only sign of C III (an unusual identification) would be this line by itself. Without concomitant C III lines, we consider this ion to be only a remote possibility. The feature is probably not due to H, since the spectrum shows no other signs of hydrogen.
Day
Figure 6 presents the synthetic spectrum produced for comparison with the day spectrum. The fit parameters used appear in Table 3. The photospheric velocity has been lowered to km s-1, and the blackbody temperature increased to K. The increased temperature should not be interpreted as a peculiarity since the blackbody continuum used by SYNOW has to be regarded only as an approximation with little physical meaning (see section 4 for details.) For the most part, the same ions are used for this fit as in the previous one. Note that at this phase, SYNOW is overestimating the continuum through the Si II 6100 Å absorption and redward. However, this offset has no effect on line identifications or ejection velocity interval measurements.
Ions definitely present in the spectrum include Si II (though no longer detached), Si III and Fe III. Again the fit to S II is problematic, but its identification based on the two notches redward of 5200 Å is not unreasonable. Ni III seems to remove some excess flux again near 4700 Å, but it no longer is sufficient to account for all of the flux deficit.
Most interestingly, it appears that between day and day , the C II signature has disappeared. A small notch near 4500 Å could be due to a small amount of C III at photospheric velocities, but adding C III optical depth only enhances the excess flux to the red of this feature. For this reason, we consider the presence of C III in this spectrum as unlikely, though no alternative has been identified.
5 Ejecta geometry
We have seen in previous sections tentative evidence of C II lines moving at velocities above 20,000 km/sec. The peculiarity of SN 1999ac is not limited to the high velocity ejecta. Distinctive characteristics are noticed in many other absorption features pointing out an overall unusual ejecta geometry. This can be investigated, in first approximation, by looking at the line profile of spectral features. The characteristic line profile during the first several weeks after outburst is a P-Cygni profile. We here briefly review the relevant features of the P-Cygni line profile before presenting measurements based on it.
A P-Cygni profile arises from a configuration consisting of an extended, expanding line-forming region surrounding an optically thick core. Consider such a configuration, observed in the frame coinciding with the rest frame of the core’s center. Material in front of the core (as observed) moves toward the observer, and scatters radiation out of the line of sight, resulting in an absorption feature blueshifted with respect to the line rest wavelength. Material not in front of the core (and expanding away from it) scatters radiation into the observer line of sight, resulting in an emission feature peaked at the line rest wavelength. Together, the blueshifted absorption and rest-wavelength centered emission features form the P-Cygni profile.
The morphology of a P-Cygni absorption component provides an estimate of the velocity interval in which the originating line forms. The blue edge of the absorption feature forms at the highest ejection velocities where the line is optically thick. In practice, the minimum of an absorption profile is used to derive a characteristic ejection velocity describing where in velocity space a line forms.
The strength of a line can easily influence its shape. A weak line (with smaller line opacity) produces a sharp, robust minimum that can be measured with little ambiguity. Conversely, a strong line produces a more rounded absorption feature, and as line strength increases, the position of the absorption minimum shifts to the blue. Hence, a velocity measured from such a minimum is not necessarily representative of the minimum ejection velocity of a line.
Two lines from the same parent ion, or concomitant lines, that are closely spaced in wavelength (as in a doublet) may generally be treated as a single line for the purposes of velocity estimation. On the other hand, features from other ions blending with a given line present a problem, as they can easily shift the position of the line minimum to the blue or red. Therefore, care must be exercised when making inferences from absorption features that may or may not be suffering blending effects.
5.1 Ejecta geometry comparison
In the following paragraphs we compare the velocity field of some of the characteristic features of SN 1999ac with those of other SNe known for having a peculiar ejecta geometry, namely SN 2002cx (Li et al., 2003), SN 1999aa (Garavini et al., 2004) and SN 2002bo (Benetti et al., 2004b), and with that of SN 1994D (Patat et al., 1996) which we here take as a prototype of normal supernova. SN 2002cx is a well studied under-luminous supernova with normal B-band light curve decline rate, spectral signatures similar to SN 1991T but with spectral lines with low expansion velocities. SN 2002bo had a normal decline rate but showed spectra with higher than average expansion velocities similar to SN 1984A (Barbon et al., 1989). Finally, SN 1999aa was found to have a slow light curve decline rate and very weak Si II absorption features with expansion velocities constant in time. Also, its spectra had similarities with SN 1991T at early epochs, but rapidly changed toward normal looking spectra just before maximum light.
5.1.1 Pre-maximum spectra
The comparison of the spectrum of SN 1999ac at day with those of the SNe mentioned above is shown in Figure 7, Panel A. The most noticeable differences lie in the region of Fe III and Si II lines. To investigate such differences, we show, in Panel B and Panel C, the comparison in velocity space of the absorption features in the wavelength region respectively around 4250 Å and 6150 Å.
In early spectra the absorption visible at 4250 Å is generally due mostly to Fe III 4404 but a contribution of Mg II 4481 is expected and can vary from object to object. Normal SNe have a stronger Mg II component whereas SN 1991T-like SNe are dominated by Fe III. Among the SNe we compare, the Mg II contamination is probably more important for SN 1994D and SN 2002bo. SN 1999ac appears to have approximately the same velocity distribution as SN 2002bo and as SN 1999aa. Both SN 1994D and SN 2002cx have lower velocities than our object. The actual ejecta geometry is difficult to disentangle from this comparison because of the uneven contamination of Mg II among the different objects. However, based on the analysis we performed in §4, this absorption in SN 1999ac appears to be the result of both Mg II and a dominant component of low velocity Fe III. We will come back later to this point for more discussion.
In Panel C we compare the line profile in velocity space of the absorption feature at around 6150 Å. This line is due to Si II 6355 and it is usually the one suffering the least blending among all the supernova optical spectral features. It is thus considered the simplest to use for expansion velocity studies. At this epoch SN 1999ac appears to have its line minimum at the same velocity as SN 1994D but with a lower velocity for its blue edge. This is consistent with the optical depth of Si II being weak in the outermost layer. We will come back to this point later in the analysis. SN 2002bo and SN 2002cx show respectively a faster and slower Si II layer.
5.1.2 Spectra at maximum
The ejecta geometry of the same SNe at around maximum light is compared in Figure 8, Panel A . As in the previous epoch the most noticeable differences are in the iron and silicon absorption features. Furthermore, Ca II H&K also appears to have a different line profile in each supernova.
The line profile in velocity space of Ca II H&K (Panel B) of SN 1999ac is comparable with that of SN 2002bo and has a single minimum while SN 1994D and SN 1999aa have double minima ( see Nugent et al. (1997); Garavini et al. (2004) a discussion of the double minima in these SNe.).
At this epoch the velocity of the minima are approximately all comparable with differences of the order of a thousand kilometer per second. The only exception is SN 2002cx for which this feature is much weaker and at lower velocity.
Fe II 5083.4 (Panel C) is at lower velocity in SN 1999ac than in SN 1994D, SN 2002bo and SN 1999aa, while only SN 2002cx shows even lower values. This is consistent with the iron layer of SN 1999ac being deeper into the atmosphere than that of the other objects as already mentioned for the case of Fe III 4404. At this epoch Si II 6355 (Panel D) also shows lower values than all the other SNe analyzed except for SN 2002cx where this line is considerably weaker.
5.1.3 Late time spectra
In late time spectra, showed in Panel A of Figure 9, the absorption features are mainly formed by iron lines. The velocity distribution and relative abundances of iron in the SNe analyzed can be discerned by inspection of the different strengths of the small absorptions and peaks in the spectra. In Panel C, vertical dotted lines mark the position of the various iron line minima. SN 1999ac shows lower velocity compared to all SNe with the usual exception of SN 2002cx. Si II at this epoch is too weak and blended with iron lines to disentangle its complete line profile and is not analyzed further. Ca II H&K (Panel B) is still strong, and for SN 1999ac this absorption feature has the highest velocity among the analyzed SNe; The Ca II IR, Panel D, has a velocity similar to the other analyzed SNe.
5.2 Velocity time evolution
The most striking peculiarity of SN 1999ac seems to be the concomitance of high velocity calcium with low velocity iron and silicon. This characteristic becomes more evident with time. Table 4 lists the velocities inferred from the minimum of the Ca II H&K feature, together with those measured for SN 1999aa (Garavini et al., 2004). Figure 10 shows these velocities as a function of time compared with those of other well observed SNe (see Garavini et al. (2004) for details on the measurement techniques). The statistical uncertainty of the measurements is negligible compared with the estimated 100 km s-1 uncertainty in host galaxy recession velocity. Spectra obtained before maximum light do not include this feature, so at those phases no measurement can be reported. After maximum, the Ca II H&K velocity decreases monotonically. This is in agreement with the trend measured for most of other SNe, but with SN 1999ac systematically offset to higher velocity.
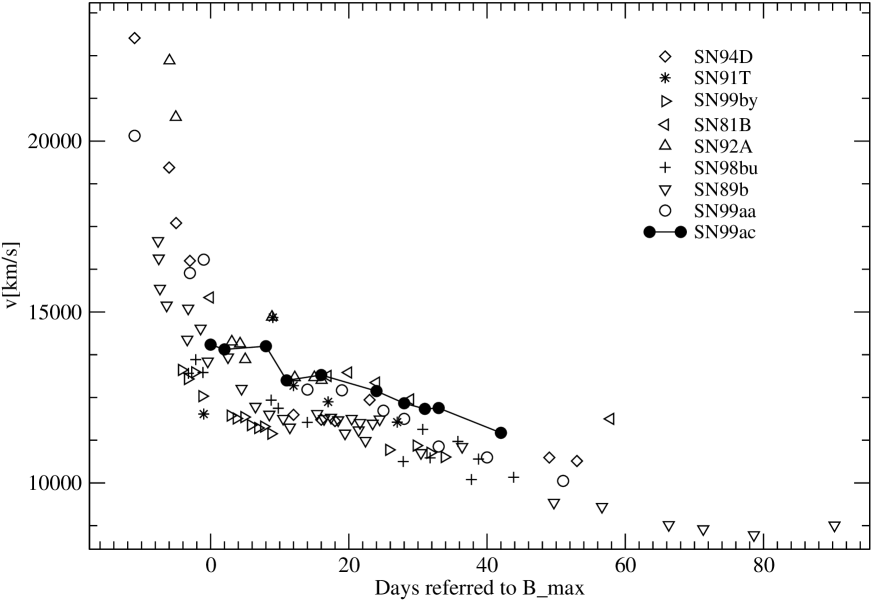
The evolution of the velocity inferred from the minimum of Si II 6355 in Figure 11 is even more peculiar. (The measured values are reported in Table 4 together with those measured for SN 1999aa.) The Si II velocity of SN 1999ac appears to be monotonically decreasing with time as is usually the case for dimmer supernovae, like SN 1991bg or SN 1999by. However, SN 1999ac was not intrinsically dim (M=() Li et al. (2003)). Some events, such as SN 2000cx or SN 1999aa, maintain a rather constant Si II velocity as a function of time. It should be noted that after day the measurements may become less meaningful because of possible blending with Fe II. Figure 12 illustrates this ambiguity clearly: By day , the entire feature can no longer be assumed to arise from Si II 6355 alone, since the peak of the emission feature has shifted to the red of the rest wavelength (zero velocity). Still, it is clear that the velocity evolution of the feature out to day is extreme among SNe Ia.
6 Type Ia SN parameter space.
Type Ia supernovae are currently believed to be a multiparameter class of objects. The standard paradigm is, however, to describe the intrinsic spread of properties through one parameter: the light curve width stretch, s, or equivalently, through the light curve decline rate . This, indeed has proved to be successful in reducing the intrinsic spread in brightness and in enabling the use of Type Ia SNe as high-quality distance indicators. Several other parameters have been proposed with the goal of fully describing SNe Ia and their parameter space. In the following sections we compare the measurements of the parameters Si II (Nugent et al., 1995), Si II (Branch & van den Bergh, 1993) and (Benetti et al., 2004a) for SN 1999ac with those of the dataset presented in Benetti et al. (2004a). For completeness we report here also the data for SN 1999aa analyzed in Garavini et al. (2004). The measured values for both supernovae are reported in Table 5. The symbols used in the following figures are chosen to be as those in Benetti et al. (2004a) to maintain the same distinction among the three clusters found in their analysis.
6.1 versus Si II
Figure 13 is a plot of as a function of the quantity Si II for many SNe Ia, including SN 1999ac. Nugent et al. (1995) defined Si II as the ratio of the depth of the Si II 5800 Å absorption to that of the Si II 6100 Å absorption. The authors theorize that the observed correlation between and Si II is driven by temperature (and hence nickel mass). Thus, hotter and brighter events tend to be characterized by a small Si II value; cooler and dimmer events are characterized by a larger Si II value. The plot shows that SN 1999ac is above the general trend. The small value of Si II of SN 1999ac is consistent with the presence of strong Fe III lines in early epochs and a high temperature of the envelope. The photometric peculiarities of SN 1999ac, reported in section 1, suggest that for this object might not be a good indicator of luminosity. The parameter space of this diagram is further expanded by the inclusion of the values for SN 1999aw, SN 1999bp and SN 1999aa (Folatelli, 2004) to which the correlation appears to apply.
6.2 versus Si II
Hatano et al. (2000) investigated the spectroscopic diversity of SNe Ia by plotting values of Si II against Si II (the blueshift measured in the Si II 6355 feature at ten days after maximum light). The authors reasoned that if SNe Ia were a one-dimensional family based on the mass of synthesized 56Ni, then the two observables would be correlated. Unable to discern such a correlation, they reasoned that the differences reflect differences in the explosion mechanism itself. In Figure 14, we plot (a proxy for Si II) against Si II, including observed values from SN 1999ac, SN 1999aw, SN 1999bp and SN 1999aa. SN 1999ac possesses a low value for Si II but a normal value of (Li et al., 2003), similar to that of SNe 1989B, 1994D, and 1996X, making SN 1999ac unique in falling outside the apparent groupings. The same would be true plotting Si II instead of its proxy . While SN 1999ac is spectroscopically similar to SNe 1990N and 1999aa (except with lower velocities), its placement on the diagram away from those events indicates the possibility of even higher dimensions of diversity in these objects.
The parameter space of this diagram is further expanded by the inclusion of the values for SN 1999aw, SN 1999bp and SN 1999aa, though perhaps in directions that appear more consistent with the trends among the groupings.
6.3 versus
The parameter was introduced in Benetti et al. (2004a) as an estimate of the expansion velocity time derivative computed after B-band maximum light. The authors found a weak correlation with , Fast declining, under-luminous supernovae show large . Slow declining supernovae show small , while normal supernovae can have both large and small values. In the versus plane (Figure 15) SN 1999ac falls on the high edge of the normal supernovae with the highest measured to date – similar to that of SN 1983G, which had different Si II and Si II. The parameter space of this diagram is again expanded by the inclusion of the values for SN 1999aa and SN 2000cx which are found to have very small values of (Garavini et al., 2004).
6.4 versus Si II
The plot of versus Si II shown in Figure 16, was left unexplored in Benetti et al. (2004a) but it is interesting to note that the three SN groups identified by the authors still populate different regions of this plot, meeting each other at intermediate values. On this plot underluminous supernova tend to have small values of Si II and high values of . Normal supernovae populate the central part of the plane while supernovae with fast expansion velocity (i.e. high Si II) have also high . SN 1999ac has the highest and the lowest Si II among the supernova measured, making it similar to the faint supernovae but on the extreme end. However, as noted, SN 1999ac did not appear to be dim. It also should be noted that SN 2000cx falls in an unpopulated region of the plot with high Si II and low .
7 Conclusions
We have presented spectroscopic observations of SN 1999ac from to days with respect to B-band maximum light. The earliest spectra are similar to those of SN 1999aa, but share some characteristics of spectroscopically normal SNe like SN 1990N. Notable is the early appearance of iron features in the spectrum at days and the lack of any real evolution in the features after days.
Using synthetic spectra, we have unambiguously identified the presence of C II at high velocity in the earliest spectrum at days. However, just six days later, all significant traces of C II have disappeared. This indicates that obtaining spectra even earlier than days with respect to maximum may be required to reliably probe the outer layers of SNe Ia. Obtaining this level of efficiency from an observing program requires careful coordination, similar to that achieved by the European Research Training Network111http://www.mpa-garching.mpg.de/ rtn/ search for SNe Ia, and the Nearby Supernova Factory (Aldering et al., 2002).
Comparing the spectra of SN 1999ac with those of other supernovae we find an unusual ejecta geometry. Iron and silicon lines appear to be formed in deeper atmosphere layers than the corresponding lines for other supernovae with the exception of the extreme case of SN 2002cx. Calcium lines, however, are found to be formed in high velocity layers. The same trends are confirmed when analyzing the time evolution of velocities as derived from the minimum of Ca II H&K and Si II 6355. The former shows a trend consistent with normal SNe Ia, though the values are slightly higher than average, while the latter shows monotonically decreasing values that follow the trend of under-luminous SNe Ia.
We have presented measurements for spectroscopically derived observables such as Si II, Si IIand . While the values for SN 1999ac weakly support the correlation between Si II and , the position of SN 1999ac on the versus Si II plane is somewhat off the main trend. In the plane versus SN 1999ac falls in a region of normal supernovae but has the highest value of , while in the plane versus Si II it appears to be on the extreme of faint supernovae with the highest and lowest Si II. However, SN 1999ac was not reported as a dim supernova. This analysis points out that SN 1999ac is unlike any other known supernova.
References
- Aldering (2000) Aldering, G. 2000, in American Institute of Physics Conference Series: Type Ia supernovae and cosmic acceleration, 75–84
- Aldering et al. (2002) Aldering, G., Adam, G., Antilogus, P., et al. 2002, in Survey and Other Telescope Technologies and Discoveries. Edited by Tyson, J. Anthony; Wolff, Sidney. Proceedings of the SPIE, Volume 4836, pp. 61-72 (2002)., 61–72
- Barbon et al. (1989) Barbon, R., Rosino, L., & Iijima, T. 1989, A&A, 220, 83
- Benetti et al. (2004a) Benetti, S., Cappellaro, E., Mazzali, P. A., et al. 2004a, ArXiv Astrophysics e-prints
- Benetti et al. (2004b) Benetti, S., Meikle, P., Stehle, M., et al. 2004b, MNRAS, 348, 261
- Branch (2001) Branch, D. 2001, PASP, 113, 169
- Branch et al. (1985) Branch, D., Doggett, J. B., Nomoto, K., & Thielemann, F.-K. 1985, ApJ, 294, 619
- Branch et al. (2003) Branch, D., Garnavich, P., Matheson, T., et al. 2003, AJ, 126, 1489
- Branch & van den Bergh (1993) Branch, D. & van den Bergh, S. 1993, AJ, 105, 2231
- Cardelli et al. (1989) Cardelli, J. A., Clayton, G. C., & Mathis, J. S. 1989, ApJ, 345, 245
- Castor (1970) Castor, J. I. 1970, MNRAS, 149, 111
- Filippenko et al. (1992) Filippenko, A. V., Richmond, M. W., Matheson, T., et al. 1992, ApJ, 384, L15
- Fisher et al. (1999) Fisher, A., Branch, D., Hatano, K., & Baron, E. 1999, MNRAS, 304, 67
- Fisher (2000) Fisher, A. K. 2000, Ph.D. Thesis
- Folatelli (2004) Folatelli, G. 2004, PhD Thesis U. Stockholm
- Gamezo et al. (2003) Gamezo, V. N., Khokhlov, A. M., Oran, E. S., Chtchelkanova, A. Y., & Rosenberg, R. O. 2003, Science, 299, 77
- Garavini et al. (2004) Garavini, G., Folatelli, G., Goobar, A., et al. 2004, AJ, 128, 387
- Garnavich et al. (2004) Garnavich, P. M., Bonanos, A. Z., Krisciunas, K., et al. 2004, ApJ, 613, 1120
- Garnavich et al. (1998) Garnavich, P. M., Kirshner, R. P., Challis, P., et al. 1998, ApJ, 493, L53+
- Hatano et al. (1999a) Hatano, K., Branch, D., Fisher, A., Baron, E., & Filippenko, A. V. 1999a, ApJ, 525, 881
- Hatano et al. (1999b) Hatano, K., Branch, D., Fisher, A., Millard, J., & Baron, E. 1999b, ApJS, 121, 233
- Hatano et al. (2000) Hatano, K., Branch, D., Lentz, E. J., et al. 2000, ApJ, 543, L49
- Hauschildt & Baron (1999) Hauschildt, P. H. & Baron, E. 1999, J. Comp. Applied Math., 109, 41
- Jeffery & Branch (1990) Jeffery, D. J. & Branch, D. 1990, in Supernovae, Jerusalem Winter School for Theoretical Physics, 149–+
- Jeffery et al. (1992) Jeffery, D. J., Leibundgut, B., Kirshner, R. P., et al. 1992, ApJ, 397, 304
- Jha (2002) Jha, S. 2002, PhD Thesis (Harvard University, 2002)
- Jha et al. (1999) Jha, S., Garnavich, P. M., Kirshner, R. P., et al. 1999, ApJS, 125, 73
- Khokhlov (1991) Khokhlov, A. M. 1991, A&A, 245, 114
- Kirshner et al. (1993) Kirshner, R. P., Jeffery, D. J., Leibundgut, B., et al. 1993, ApJ, 415, 589
- Knop et al. (2003) Knop, R. A., Aldering, G., Amanullah, R., et al. 2003, ApJ, 598, 102
- Kurucz (1993) Kurucz, R. 1993, Atomic data for opacity calculations. Kurucz CD-ROM No. 1. Cambridge, Mass.: Smithsonian Astrophysical Observatory, 1993., 1
- Labbe (2001) Labbe, e. a. 2001, BAAS, 33, 1207
- Leibundgut et al. (1991) Leibundgut, B., Kirshner, R. P., Filippenko, A. V., et al. 1991, ApJ, 371, L23
- Li et al. (2003) Li, W., Filippenko, A. V., Chornock, R., et al. 2003, PASP, 115, 453
- Li et al. (2001a) Li, W., Filippenko, A. V., Gates, E., et al. 2001a, PASP, 113, 1178
- Li et al. (2001b) Li, W., Filippenko, A. V., Treffers, R. R., et al. 2001b, ApJ, 546, 734
- Li et al. (1999) Li, W. D., Qiu, Y. L., Qiao, Q. Y., et al. 1999, AJ, 117, 2709
- Mazzali (2001) Mazzali, P. A. 2001, MNRAS, 321, 341
- Mazzali et al. (1995) Mazzali, P. A., Danziger, I. J., & Turatto, M. 1995, A&A, 297, 509
- Modjaz et al. (1999) Modjaz, M., King, J. Y., Papenkova, M., et al. 1999, IAU Circ., 7114, 1
- Nomoto et al. (1984) Nomoto, K., Thielemann, F.-K., & Yokoi, K. 1984, ApJ, 286, 644
- Nugent et al. (1997) Nugent, P., Baron, E., Branch, D., Fisher, A., & Hauschildt, P. H. 1997, ApJ, 485, 812
- Nugent et al. (1995) Nugent, P., Phillips, M., Baron, E., Branch, D., & Hauschildt, P. 1995, ApJ, 455, L147+
- Patat et al. (1996) Patat, F., Benetti, S., Cappellaro, E., et al. 1996, MNRAS, 278, 111
- Perlmutter et al. (1998) Perlmutter, S., Aldering, G., della Valle, M., et al. 1998, Nature, 391, 51
- Perlmutter et al. (1999) Perlmutter, S., Aldering, G., Goldhaber, G., et al. 1999, ApJ, 517, 565
- Phillips et al. (1999a) Phillips, M. M., Kunkel, W., & Filippenko, A. V. 1999a, IAU Circ., 7122, 2
- Phillips et al. (1999b) Phillips, M. M., Lira, P., Suntzeff, N. B., et al. 1999b, AJ, 118, 1766
- Phillips et al. (2002) Phillips, M. M., Krisciunas, K., Suntzeff, N. B., et al. 2002, arXiv:astro-ph/0211100
- Reinecke et al. (2002) Reinecke, M., Hillebrandt, W., & Niemeyer, J. C. 2002, A&A, 391, 1167
- Riess et al. (1998) Riess, A. G., Filippenko, A. V., Challis, P., et al. 1998, AJ, 116, 1009
- Riess et al. (2004) Riess, A. G., Strolger, L., Tonry, J., et al. 2004, ApJ, 607, 665
- Ruiz-Lapuente et al. (1992) Ruiz-Lapuente, P., Cappellaro, E., Turatto, M., et al. 1992, ApJ, 387, L33
- Salvo et al. (2001) Salvo, M. E., Cappellaro, E., Mazzali, P. A., et al. 2001, MNRAS, 321, 254
- Schlegel et al. (1998) Schlegel, D. J., Finkbeiner, D. P., & Davis, M. 1998, ApJ, 500, 525
- Schmidt et al. (1998) Schmidt, B. P., Suntzeff, N. B., Phillips, M. M., et al. 1998, ApJ, 507, 46
- Sobolev (1960) Sobolev, V. V. 1960, Moving envelopes of stars (Cambridge: Harvard University Press, 1960)
- Theureau et al. (1998) Theureau, G., Bottinelli, L., Coudreau-Durand, N., et al. 1998, A&AS, 130, 333
- Tonry et al. (2003) Tonry, J. L., Schmidt, B. P., Barris, B., et al. 2003, ApJ, 594, 1
- Wells et al. (1994) Wells, L. A., Phillips, M. M., Suntzeff, B., et al. 1994, AJ, 108, 2233


.


| JD | EpochffRest Frame days. | Telescope | Instrument | RangeggRest Frame wavelength. | FWHMa,ga,gfootnotemark: | bbAverage signal-to-noise ratio per wavelength bin. | Comments |
|---|---|---|---|---|---|---|---|
| -2400000 | ref | [Å] | [Å] | ||||
| 51236.89 | -15 | APO | DIS | 3703-10307 | 11 | 125 | 5696.16 ccBeginning of red channel, [Å]. |
| 51240.95 | -9 | MDM 2.4m | MARK III | 3827-8860 | 16 | 63 | eePossible 2nd order contamination above 7500 Å. |
| 51251.39 | +0 | ESO 3.6m | EFOSC2 | 3331-7495 | 32 | 325 | ddNegligible 2nd order contamination. |
| 51253.84 | +2 | CTIO 4m | RCSP | 3235-9263 | 5 | 76 | ddNegligible 2nd order contamination. |
| 51253.72 | +2 | NOT | ALFOSC | 3285-9655 | 34 | 176 | 5852.06ccBeginning of red channel, [Å]. |
| 51259.88 | +8 | CTIO 4m | RCSP | 3227-9254 | 6 | 94 | ddNegligible 2nd order contamination. |
| 51262.89 | +11 | CTIO 4m | RCSP | 3254-9278 | 6 | 114 | ddNegligible 2nd order contamination. |
| 51267.87 | +16 | CTIO 4m | RCSP | 3239-9241 | 6 | 90 | ddNegligible 2nd order contamination. |
| 51275.98 | +24 | KPNO 4m | T2KB | 3029-10401 | 11 | 59 | ddNegligible 2nd order contamination. |
| 51279.85 | +28 | ESO 3.6m | EFOSC2 | 3341-10255 | 32 | 237 | 7440.45c,dc,dfootnotemark: |
| 51282.90 | +31 | Lick 3m | KAST | 3321-10483 | 5 | 46 | 5489.40ccBeginning of red channel, [Å]. |
| 51284.84 | +33 | ESO 3.6m | EFOSC2 | 3392-10128 | 32 | 195 | 7363.23c,dc,dfootnotemark: |
| 51290.84 | +39 | ESO 3.6m | EFOSC2 | 3344-10194 | 32 | 146 | 7435.50c,dc,dfootnotemark: |
| 51293.97 | +42 | Lick 3m | KAST | 3268-8002 | 5 | 49 | 5417.33ccBeginning of red channel, [Å]. |
| Ion | |||||
|---|---|---|---|---|---|
| km | km | K | km | ||
| C ii | 0.038 | 16 | 40 | 15 | 5 |
| C iii | 0.2 | - | 14.2 | 15 | 5 |
| O i | 0.2 | - | 40 | 15 | 5 |
| Mg ii | 0.15 | - | 40 | 15 | 5 |
| Si ii | 0.65 | 14.2 | 40 | 15 | 5 |
| Si iii | 0.42 | - | 17 | 15 | 5 |
| S ii | 0.2 | - | 17 | 15 | 5 |
| Ca ii | 1.5 | 16 | 40 | 15 | 5 |
| Fe iii | 0.55 | 14.5 | 18 | 12 | 5 |
| Co ii | 0.006 | - | 40 | 15 | 5 |
| Ni iii | 5 | - | 40 | 12 | 5 |
| Ion | |||||
|---|---|---|---|---|---|
| km | km | K | km | ||
| C ii | 0.015 | 16 | 40 | 12 | 5 |
| C iii | 0.75 | - | 12.8 | 12 | 5 |
| O i | 0.1 | - | 40 | 12 | 5 |
| Mg ii | 0.2 | - | 40 | 12 | 5 |
| Si ii | 1.2 | - | 40 | 12 | 5 |
| Si iii | 0.6 | - | 16 | 12 | 5 |
| S ii | 0.2 | - | 17 | 12 | 5 |
| Ca ii | 1.5 | 16 | 40 | 12 | 5 |
| Fe iii | 0.65 | - | 18 | 12 | 5 |
| Ni iii | 7.0 | - | 40 | 12 | 5 |
| Co ii | 0.045 | - | 40 | 12 | 5 |
| SN 1999ac | SN 1999aa | ||||
| Epoch | Ca II H&K | Si II | Epoch | Ca II H&K | Si II |
| days | [km s-1] | [km s-1] | days | [km s-1] | [km s-1] |
| -15 | - | 13409 | -11 | 20155 | - |
| -9 | - | 12169 | -7 | - | 10519 |
| 0 | 14045 | 9801 | -3 | 16138 | - |
| 2 | 13907 | 9488 | -1 | 16531 | 10060 |
| 8 | 14000 | 8844 | 5 | - | 10233 |
| 11 | 12999 | 8269 | 14 | 12730 | 10083 |
| 16 | 13156 | 7410 | 19 | 12710 | 9928 |
| 24 | 12687 | 6572 | 25 | 12114 | 10085 |
| 28 | 12331 | 6361 | 28 | 11874 | 10107 |
| 31 | 12167 | - | 33 | 11066 | 10922 |
| 33 | 12192 | - | 40 | 10747 | - |
| 42 | 11465 | - | 51 | 10058 | - |
| SN 1999ac | SN 1999aa | |
|---|---|---|
| M | -18.98(0.39)aaAverage over wavelength. | -19.14(0.78) |
| 1.30(0.09)aaAs reported in Li et al. (2003). | 0.85(0.08) | |
| Si II | 0.098(0.030) | 0.163(0.016) |
| Si II | 8470(300) | 10100(300) |
| 137(14) | 4(14) |