EVOLUTION OF STELLAR BARS IN LIVE AXISYMMETRIC HALOS: RECURRENT BUCKLING AND SECULAR GROWTH
Abstract
Evolution of stellar bars in disk galaxies is accompanied by dynamical instabilities and secular changes. Following the vertical buckling instability, the bars are known to weaken dramatically and develop a pronounced boxy/peanut shape when observed edge-on. Using high-resolution -body simulations of stellar disks embedded in live axisymmetric dark matter halos, we have investigated the long-term changes in the bar morphology, specifically the evolution of the bar size, its vertical structure and exchange of angular momentum. We find that following the initial buckling, the bar resumes its growth from deep inside the corotation radius and follows the Ultra-Harmonic resonance thereafter. We also find that this secular bar growth triggers a spectacular secondary vertical buckling instability which leads to the appearance of characteristic boxy/peanut/X-shaped bulges. The secular bar growth is crucial for the recurrent buckling to develop. Furthermore, the secondary buckling is milder, persists over a substantial period of time, Gyr, and can have observational counterparts. Overall, the stellar bars show recurrent behavior in their properties and evolve by increasing their linear and vertical extents, both dynamically and secularly. We also demonstrate explicitly that the prolonged growth of the bar is mediated by continuous angular momentum transfer from the disk to the surrounding halo, and that this angular momentum redistribution is resonant in nature — a large number of lower resonances trap disk and halo particles and this trapping is robust, in a broad agreement with the earlier results in the literature.
Subject headings:
galaxies: bulges — galaxies: evolution — galaxies: formation — galaxies: halos — galaxies: kinematics and dynamics — galaxies: spiral1. Introduction
Observations and numerical modeling of galactic stellar bars have been frequently accompanied with basic controversies about their origin and evolution. While modern understanding of bar growth in a live and responsive environment is rooted in the angular momentum redistribution between the inner and outer disks, bulges and dark matter halos (Athanassoula 2003), the efficiency of this process is hardly known and its details are still to be investigated. Recent efforts include but are not limited to the issues related to the bar lifetime cycles, gas-star interactions, bar amplitudes and sizes, and bar slowdown (e.g., Bournaud & Combes 2002; Valenzuela & Klypin 2003; Shen & Sellwood 2004; Weinberg 1985; Hernquist & Weinberg 1992; Debattista & Sellwood 1998, 2000). The bigger issue of course is how the observational and theoretical aspects of bar evolution fit within the emerging understanding of cosmological galaxy evolution (e.g., Jogee et al. 2004; Elmegreen et al. 2004), specifically the bar evolution in triaxial halos (El-Zant & Shlosman 2002; Berentzen, Shlosman & Jogee 2005).
On one hand, early self-consistent models of numerical stellar bars have relied heavily on the Ostriker & Peebles (1973) result which emphasized the Maclauren sequence parameter — the ratio of bulk kinetic-to-gravitational energy as the threshold of bar instability. On the other hand, they revealed robustness of the bars — once formed, the bars persisted (Athanassoula 1984 and refs. therein). The subsequent increase in the particle number above , switching from 2-D to 3-D models with responsive spheroidal components, and introduction of nonlinear physics tools in the orbital analysis have shown a much more complex bar evolution and morphology than was anticipated originally (e.g., review by Athanassoula 2002a). This refers especially to the numerical confirmation that live halos can indeed drive the bar instability rather than damp it (Athanassoula & Misiriotis 2002; Athanassoula 2003). Lastly, it is still unclear to what extent and how closely the numerical bars correspond to their observed counterparts. This issue exacerbates galaxy studies because overall, both theoretically and observationally, the bars appear to be among the most important drivers of galactic evolution across a wide range of spatial scales.
In this paper, we have revisited some aspects of a self-consistent evolution of stellar bars originating in live stellar disks embedded in live dark matter halos by focusing on dynamical and secular changes111We refer to a dynamical evolution when changes develop on the timescale of disk rotation, and to a secular evolution when they develop on a much longer timescale of rotations. in these systems. The evolution of numerical collisionless bars has been characterized so far in the literature by three distinct phases — the initial growth, the rapid vertical buckling and the prolonged quasi-steady regime, i.e., when the bars preserve their basic parameters (e.g., Sellwood & Wilkinson 1993). However, some indication that bars can grow even in the last phase has been noticed already in low-resolution 3-D models with live halos (e.g., Sellwood 1980). This ability of the bars to grow over extended period of time due to the momentum exchange with the outer disk and especially with the halo has been confirmed recently and analyzed in self-consistent 3-D simulations (Athanassoula 2003). Here we attempt to quantify this secular growth in terms of the bar size and its ellipticity, of the angular momentum exchange, and of the ratio of vertical-to-radial dispersion velocities. Moreover, we look into the corollaries of such recurrent growth and find that it leads to additional and substantial 2-D and 3-D structural changes in the bar. We, therefore, discuss the observational consequences of this evolution.
Early in their growth stage, numerical stellar bars experience a dynamical instability — the vertical buckling. The bars thicken profoundly, become more centrally-concentrated and acquire a characteristic peanut/boxy shape when seen edge-on (Combes et al. 1990; Pfenniger & Friedli 1991; Raha et al. 1991; Berentzen et al. 1998; Patsis, Skokos & Athanassoula 2002a), while nearly dissolving the outer half of the bar, beyond the vertical inner Lindblad resonance (Martinez-Valpuesta & Shlosman 2004). This happens in live models with both axisymmetric and mildly triaxial halos (Berentzen, Shlosman & Jogee 2005). These boxy/peanut shapes are similar to bulge shapes observed in edge-on galaxies (e.g., Jarvis 1986; Shaw 1987; Bureau & Freeman 1999; Merrifield & Kuijken 1999), which can be found in nearly half of all edge-on disk galaxies (Lütticke, Dettmar & Pohlen 2000). Although observed in numerical simulations a long time ago (Combes & Sanders 1981), the origin of boxy/peanut bulge shapes still has two alternative explanations — the well-known firehose instability (e.g., Toomre 1966; Raha et al. 1991; Merritt & Sellwood 1994) and the resonance heating (e.g., Combes et al. 1990; Pfenniger & Friedli 1991; Patsis et al. 2002b). These two views can be reconciled if buckling is responsible for shortening the secular timescale of particle diffusion out of the disk plane and for accelerating the buildup of boxy/peanut bulges which proceeds on a much shorter dynamical timescale instead (Martinez-Valpuesta & Shlosman 2004).
However, is the buckling really necessary for a buildup of these boxy/peanut shaped bulges? After all, even imposing vertical symmetry did not eliminate this effect, albeit the buildup proceeded on a much longer timescale (Friedli & Pfenniger 1990). Where are the observational counterparts of these asymmetric buckled bars? Due to a particular importance of the buckling instability for the evolution of numerical bars and its plausible connection to the buildup of the pronounced 3-D structure there, we have analyzed the bar behavior during and following this instability. Specifically, we find that the bars in a live environment are capable of recurrent growth, that the buckling instability is a recurrent event and that the buildup of the 3-D shape is not necessarily a dynamic phenomenon.
Much of the analysis of bar evolution and the accompaning instabilities is implemented here by means of nonlinear orbit analysis, because for such strong departures from axial symmetry the epicyclic approximation cannot be relied upon — being wrong quantitatively it frequently leads to qualitative errors. We shall try to avoid the specific jargon associated with this technique where possible. The angular momentum redistribution in the model is quantified using orbital spectral analysis.
In section 2 we provide the details of numerical modeling and analysis. Section 3 describes the overall results of secular bar evolution. The 3-D bar orbital structure and the inferred vertical structure in the bar are analyzed in section 4, and the resonant interaction between the disk and the halo in section 5. Discussion and conclusions are given in sections 6 and 7.
2. Numerical Tools and Modeling
2.1. -Body Simulations
To simulate the stellar disk embedded in a live dark matter halo, we have used version FTM-4.4 of the -body code (Heller & Shlosman 1994; Heller 1995) with . The gravitational forces are computed using Dehnen’s (2002) falcON force solver, a tree code with mutual cell-cell interactions and complexity O(N). It conserves momentum exactly and is about 10 times faster than an optimally coded Barnes & Hut (1986) tree code.
The initial density distribution is derived from the Fall & Efstathiou (1980) disk-halo analytical model. The system is not in exact virial equilibrium, and therefore must be relaxed iteratively. The halo-to-disk mass ratio within 10 kpc is fixed to unity. The halo has a flat density core of 2 kpc to avoid excessive stochastic behavior associated with the central cusps (El-Zant & Shlosman 2002). The disk is exponential and its radial and vertical scalelengths are taken as 2.85 kpc and 0.5 kpc, respectively. The disk and halo cut off radii are 25 kpc and 30 kpc and the initial circular velocity curves for disk and halo components and their sum are given in Fig. 1. The gravitational softening used is 160 pc and Toomre’s parameter . The adopted units are those of , mass and distance kpc. This leads to the time unit of yrs and a velocity unit of 208 . The energy and angular momentum in the system are conserved to within approximately 1% and 0.05% accuracy, respectively. Above our results appear to be reasonably independent of . The model evolution presented here has , with particles in the disk.

2.2. Orbital and Spectral Analysis
The self-consistent evolution of stellar bars can be only understood by studying their 3-D structure (e.g., Pfenniger & Friedli 1991; Skokos, Patsis & Athanassoula 2002a,b). For such in-depth investigation we use the updated algorithm described in Heller & Shlosman (1996), which is based on a comprehensive search for periodic orbits in arbitrary gravitational potentials, and display them in characteristic diagrams (section 4). These orbits close in the bar frame and provide the backbone for any meaningful analysis of the bar properties. Periodic orbits characterize the overall orbital structure of the bar phase space, because each of them traps a region of phase space around it. These trapped orbits have shapes similar to the shapes of the parent periodic orbit. The algorithm is run using the package Parallel Virtual Machine (PVM), which distributes the search for orbits among different processors and computes the orbits using adaptive step size, with a relative accuracy of . We also calculate the stability of these periodic orbits to estimate which orbits can be populated. We track both the 2-D orbital families and the 3-D families bifurcating from planar (i.e., equatorial) orbits at the (vertically) unstable gaps. The shapes of these 3-D orbital families will contribute to the shape of the simulated bar, when populated, including the evolving shape of the growing boxy/peanut bulge.
To quantify the disk–halo interaction and the angular momentum redsitribution in the system, we have developed a package based on the orbital analysis algorithm and which uses the Fast Fourier Transform (FFT) to find the main orbital frequencies — the angular frequency , and the radial and vertical epicyclic frequencies and in the disk and the halo. The particle distribution with the frequency ratio is then determined to find the population of resonant orbits. Lastly the change in the angular momentum is computed for each of these particles (see section 5).
3. Results
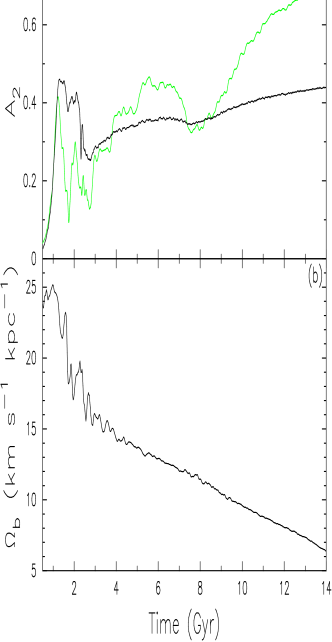
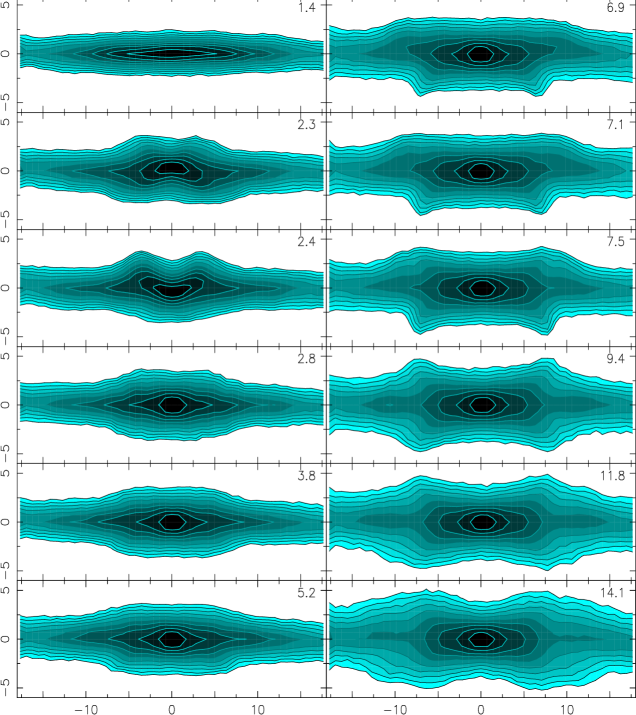
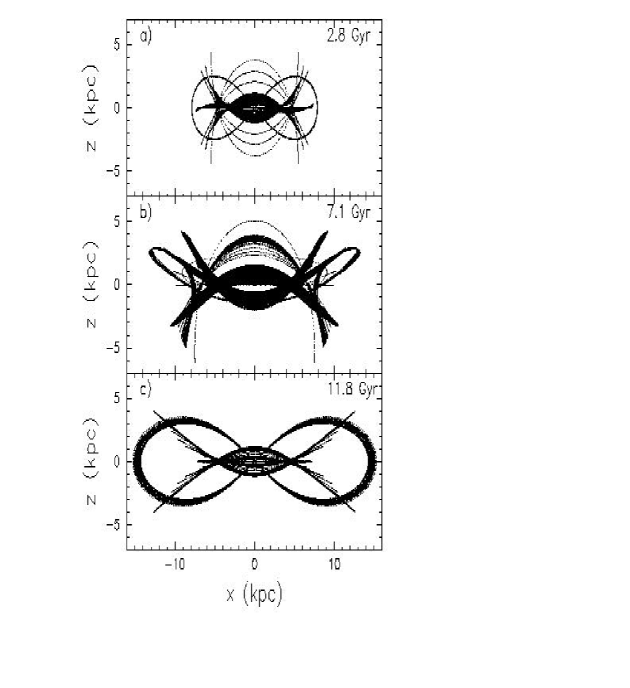
We first describe the overall bar evolution during the simulation period of Gyr and analyze some of its more important behaviors. The bar develops in otherwise axisymmetric model during the first two-three disk rotations. Initially it has an axial ratio (flatness) , the same thickness as the disk, but this ratio increases with time by a factor of . The bar starts to brake against the outer disk and the halo as seen in Fig. 2b, reaching maximum strength at Gyr. At around Gyr the bar experiences a vertical buckling instability which affects its 2-D and 3-D appearance. The outer part of the bar nearly dissolves, while overall the bar is weakened dramatically, as shown by the amplitudes, , in Fig. 2a. Immediately following this buckling, the bar resumes its growth which saturates again at Gyr. At this time in the outer part weakens again. The growth is resumed after Gyr. A close inspection of the edge-on bar frames during time intervals of Gyr and Gyr and the analysis described in the next sections, reveal sufficient similarities between these two events — both represent the vertical buckling instability in the bar, i.e., the breaking of symmetry of the bar (Fig. 3). Such a recurrent buckling of bars has never been reported in the literature.
3.1. Secular Growth of Stellar Bars
The stellar bar evolution presented here is characterized by substantial changes in the bar size and strength, and by changes in its 3-D shape (Fig. 3 and Animation Sequence 1). Determination of the live bar size in numerical simulations is not trivial. For example, Athanassoula & Misiriotis (2002) and O’Neil & Dubinski (2003) used a variety of methods and found that some of them give erroneous and unreliable results. The position of maximum does not provide any meaningful estimate for the bar size because the contribution of higher harmonics, such as and 8, is neglected. To quantify the bar size changes we have used two alternative methods — an ellipse fitting to the isodensity curves and the characteristic orbital diagrams. The former method has been previously used to detect and to characterize ‘observational’ bars (e.g., Knapen et al. 2000; Laine et al. 2002; Hunt & Malkan 2004). Its main deficiency when applied to numerical bars is an excessive noise for low-to-moderate and the resulting distribution of the bar ellipticities, , being flat for young unbuckled bars (Martinez-Valpuesta & Shlosman 2004). However, at later times, with the growth of the central mass concentration, this method becomes more reliable. We find that a consistently reliable estimate of the bar size, , is the radius where declines from its maximal value. The alternative and a new method used by us here relates the bar extent to the size of the maximal stable orbit of the main orbital family supporting the bar (more in Section 4). Both methods produce consistent results with each other.
The bar size evolution is shown in Fig. 4a, for both methods. It grows initially to 11 kpc, then buckles and shortens to 6 kpc. It then grows again to 13 kpc, where the growth stagnates due to the secondary buckling, for about 3 Gyr. After this the bar resumes its growth to about 16 kpc. The size evolution in the plane is accompanied by the vertical thickening of the bar. It does not stop after the first buckling instability, but continues gradually due to the vertical resonance scattering, amplified by the recurrent buckling instability of the bar. The accompanied boxy/peanut shaped bulge also grows with time (Fig. 3).
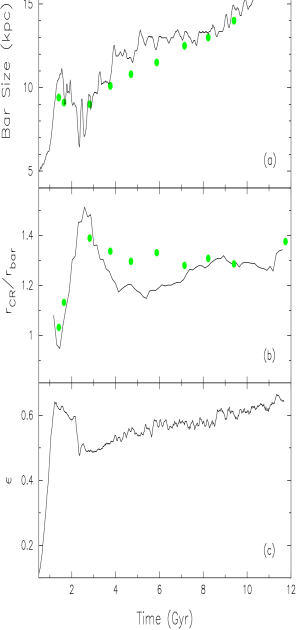
With the bar length, , and its corotation radius, , we can quantify some of the dynamical characteristics of an evolving bar. The ratio is shown in Fig. 4b. This ratio determines the shape of the offset dust lanes in barred galaxies which delineate shocks in the gas flow (Athanassoula 1992). The observed shapes constrain the ratio to . The modeled ratio typically falls within the required limits except during the first buckling when it is higher, , as noticed already by Martinez-Valpuesta & Shlosman (2004). We shall discuss this issue in more detail in Section 6.
3.2. Recurrent Buckling of Stellar Bars
The buckling is a 3-D phenomena and is most visible in the vertical -plane (Fig. 3). To quantify the bar asymmetry, we have calculated the vertical mode amplitude in the plane and follow the maximal distortion of the bar during its buckling periods. Two maxima are apparent at Gyr and Gyr in Fig. 5. Note, that the vertical asymmetry given by this Figure is building up slower and is weaker for the second buckling, i.e., from Gyr to Gyr the amplitude is growing to , compared to at Gyr. Fig. 3 shows this evolution in a more graphical way — while the first buckling affects mostly the central few kpc, especially the bar’s midplane, the second buckling is most prominent in the outer bar range of 5–10 kpc and affects the midplane much less visibly.

The recurrent buckling can be detected in a number of ways, e.g., from in the -plane (Fig. 2a), as mentioned in section 3.1 and above, and from in the plane, which quantifies the breaking of vertical symmetry in the bar (Fig. 5). Each of the coefficients emphasizes a different property of this instability. We are basically looking at the same phenomena at different times — the first buckling extends over Gyr and the second one over Gyr. The changes in the orbital structure of the bar during the bucklings will be analyzed in Section 4.
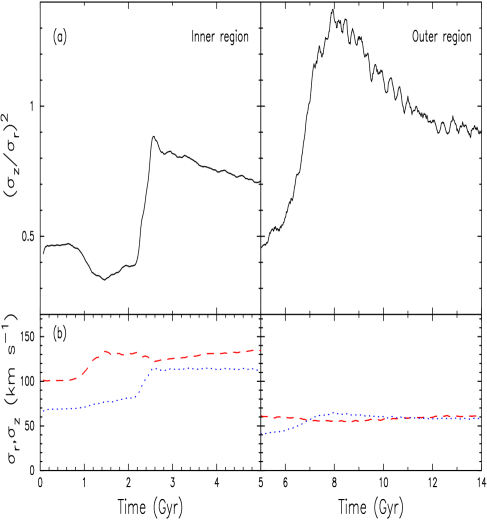
We have commented in Section 1 that the buckling instability is a collective breaking of a vertical symmetry in the bar. Toomre (1966) has shown that the coupling between the vertical and radial degrees of motion is the prime driver of this instability and the main outcome of it is the equalizing of the velocity dispersion in the plane with the vertical velocity dispersion.222Normally, the kinetic energy of oscillations about the equatorial plane, i.e. along the -axis, is an adiabatic invariant This evolution is characterized by changes in vertical-to-radial velocity dispersion ratio . Toomre estimated the critical value for this ratio to lie at for a non-rotating plane-parallel slab, Raha et al. (1991) at 0.06-0.3 for a 3-D stellar disk, and Sotnikova & Rodionov (2005) at for the central regions embedded in the hot halos. Sellwood (1996) have shown that Toomre’s limit is violated for many of his stellar models, some remaining unstable up to 0.4. We plot this ratio for two areas of the bar at two different times. For the first buckling (Fig. 6), the velocity dispersions are calculated in the central kpc, where the maximum effect is expected (e.g., Fig. 3). During this buckling, we observe first an increase in (the initial growth of the bar), and after Gyr a decrease in with a corresponding increase in . When drops below the bar buckles and weakens. The buckling ends when increases to unity. The bar thickens and grows and the vertical ILR moves gradually out. We expect and observe the maximal vertical asymmetry in the outer part of the bar during the second buckling, and therefore calculate at around 7 kpc. Again, the gradual increase in and decrease in drive the ratio up from 0.4 to about unity, similar to the first buckling. For both bucklings we observe a very similar evolution in terms of the velocity dispersions and their ratios.
So far we have shown that the bar buckles twice during the simulations: first time — abruptly, fast and in the central part, and the second time — slower, less pronounced and in a different part of the bar. In both bucklings we observe the loss of symmetry in the vertical plane, the drop in and the equilizing of the vertical and radial velocity dispersions. After each buckling the bar becomes more symmetric, with the difference that after the first buckling the asymmetry starts to build anew, and after the second buckling — the asymmetry is completely washed out.
To summarize, three main factors characterize the end of the buckling instability: starts to decrease, the asymmetry in the -plane decreases (given by ), and . Applying these conditions to our model, the end of the first buckling appears at Gyr and the end of the second buckling at Gyr.
Since the buckling leads to a sudden vertical thickening of the bar and is therefore characterized by particle injection above the disk plane, we can monitor this instability by following the particle distribution. When viewed along the bar minor axis, during the first buckling the bar bends and develops a boxy/peanut shaped bulge, while during the second buckling the bar acquires an asymmetric shape which leads to the appearance of an X-shaped bulge (Fig. 3). These shapes have a direct relationship to the population of orbits trapped by the main family of periodic orbits in the bar (Pfenniger & Friedli 1991; Section 4 below).
4. Analysis: Bar Orbital Structure Evolution
Stellar bars are 3-D objects which exhibit dynamical and secular evolutionary trends both in their morphology and internal structure. In this section, we study the evolution of the orbital structure in the bar by searching for the main 2-D and 3-D families of orbits at various snapshots, with a particular emphasis on the recurrent buckling periods. A comprehensive search for the orbits is beyond the scope of this work. We analyze the main parameters of detected orbits and calculate their stability. This section uses a specific terminology developed for nonlinear orbital dynamics (e.g., Binney & Tremaine 1987; Sellwood & Wilkinson 1993). Reader unfamiliar with this terminology can skip it and go directly to Section 5. We shall discuss the results of the orbital analysis in the context of the bar evolution in Section 6.
The initial vertical axial ratio of the bar which develops in our models is (nearly a 2-D object), and grows dynamically and secularly to over the Hubble time. We first analyze the bar’s orbital structure in the equatorial plane, then add the 3-D effects accounting for the finite thickness and shape of the bar. In doing so, we limit our analysis to the periodic orbits within , which are largely responsible for the bar shape, and to specific times of bar evolution: Gyr (just prior to first buckling), 2.8 Gyr (after the first buckling), 7.1 Gyr (during the second buckling) and 11.8 Gyr (after the second buckling). The orbits are searched in the potential symmetrized horizontally with respect to the four quadrants. Fig. 5 confirms that the vertical symmetry is violated during the buckling periods. The first buckling is fast and there is little meaning, therefore, to calculate the orbits without some frame averaging — the stars see only a time-averaged potential. Hence, we resort to a vertically-symmetrised potential at 2.8 Gyr. On the other hand, the second buckling is much more gradual and we calculate the orbits in the actual ‘raw’ potential at Gyr to capture the persisting asymmetry. The third snapshot with the bar being symmetric again is treated similarly to the first snapshot for simplicity.
The extent of the orbital families and their stability are displayed by means of characteristic diagrams. The , , or intercept values with the plane are plotted with respect to their Jacobi integral, (e.g., Binney & Tremaine 1987). The Jacobi (energy) integral of motion is conserved along any given orbit in the rotating bar frame. The orbits form curves or families in the characteristic diagrams. The actual trajectories will not coincide exactly with these periodic orbits but may be ‘trapped’ in their vicinity. The properties of periodic orbits and their temporal changes, therefore, reflect the bar structural evolution.

The most important single-periodic orbits in the bar midplane are those aligned parallel or normal to the bar major axis, the so-called and orbits (e.g., Contopoulos & Papayannopoulos 1980; Binney & Tremaine 1987). The constitutes the main family of orbits which support the bar figure. While this family exists always within , the appear only if the planar inner Lindblad resonance(s) (ILRs) are present. Typically, numerical bars form with a pattern speed sufficiently high to avoid the ILRs, at least in the beginning, and hence the family completely dominates the bar midplane, short of the corotation region.
The vertical shape of the bar is determined by the projection of the populated 3-D orbits onto the corresponding planes. We search for the vertically-unstable gaps in the family. It is at these gaps where the 3-D families bifurcate through and bifurcations (e.g., Pfenniger 1984; Pfenniger & Friedli 1991; Skokos et al. 2002a,b; Patsis et al. 2002b). These gaps coincide with the vertical ILR and other vertical resonances. When an orbital family goes from being stable to unstable, in the mentioned gaps, we get the 3-D prograde families, i.e., orbits with initial conditions , with . When it goes from being unstable to stable, we get the retrograde families, , with , where , and are oriented along bar’s major, minor and vertical axes.
While the vertical ILR is associated with the boxy/peanut bulge shapes, which develop as a result of the resonance heating of midplane orbits, Patsis et al. (2002b) have found that this effect is not limited to a particular resonance and not to the barred galaxies per se, but operates equally well in nearly axisymmetric and/or ovally distorted disks. Furthermore, the buckling itself is not a necessary condition for these shapes to form, but rather accelerates the process from secular to a dynamical timescale.
The main families of 3-D orbits which are responsible for the appearance of the boxy/peanut shaped bulges are BAN (prograde to the bar rotation) and ABAN (retrograde) families found by Pfenniger & Friedli (1991). They are called and , respectively, and appear as the 3-D generalizations of and families in the nomenclature of Skokos et al. (2002a). In general terms, the BAN orbits can be described as “” () and “” (), and ABAN as “,” when projected onto the -plane. Both families are (i.e., two radial oscillations for two vertical oscillations for one turn) in the notation of Sellwood & Wilkinson (1993). Their projections onto the plane have the orbit shapes. We trace the planar and and the 3-D BAN/ABAN families from the bar initial growth period. For simplicity, we have divided the simulation into a number of characteristic time intervals and discuss them separately.
Before and during the first buckling, Gyr. During this period the bar develops and buckles (Figs. 2–6). It is geometrically thin and is not centrally concentrated, so the vertical ILR is not present. Neither present are the planar ILRs and consequently the orbits. The stable 3-D orbits lie close to the midplane. As we stated above, there is little meaning to calculate the orbits in the rapidly varying potential without the proper time-averaging. Because the midplane of the bar is bent in the plane (Fig. 3), so are the orbits.
After the first buckling, Gyr. The bar has increased its central mass concentration and acquired its boxy/peanut shaped bulge (see Fig. 3). As we stated above, there is little meaning to calculate the orbits in the vertically unsymmetrized potential at the time of the first buckling because of the rapidly varying potential. Moreover, the bar midplane is bent in at this time, and so are the orbits (Fig. 3). Hence, we have vertically symmetrized the potential at this time frame (Fig. 7b, left frame). In the midplane, the orbits dominate and no family exists (Fig. 6a). Most of the orbits are stable, except for a small gap, where the vertical ILR is located. At Gyr the gap is at , where the BAN/ABAN orbits bifurcate (Fig. 7a). The BAN/ABAN are traced (Fig. 7b,c) — their origin in plane moves gradually out with time toward higher Jacobi energy. By the end of the first buckling it stabilizes and subsequently creeps toward higher as the bar brakes against the halo. BAN orbits appear stable from 300 pc above the midplane, with a broad unstable gap at kpc and a narrow stability island (Fig. 7b). Initially, the stable part of these families is limited to a very small height above the bar midplane, compared to the bar vertical thickness. Gradually the stable extent of the BAN family is increasing both in and in (Fig. 8). The ABAN family is unstable when BAN is stable and vice versa (Fig. 7c), as first noted by Pfenniger & Friedli (1991).
Before/during the second buckling, Gyr. The bar is growing both in size and amplitude and exhibits a pronounced boxy profile when viewed along its minor axis. It appears symmetric with respect to the bar midplane up to Gyr (Fig. 3), although shows that some small residual asymmetry remains between the bucklings (Fig. 5). After Gyr, the vertical symmetry of the bar is broken for an extended period of time Gyr (Figs. 3, 5). The maximal distortion happens at Gyr. No orbits exist during this time period and the unstable gap in moved to somewhat higher energies, , due to the bar braking (Fig. 7a). Additional unstable gap has appeared at , where the 3:2:1 orbit family bifurcates.
Note that the analysis shown in the Gyr frame of Fig. 7 is performed in the actual gravitational potential of the -body simulation, i.e., without symmetrization with respect to the plane. Therefore, we should not expect to find all the families existing in the symmetrized potentials. But we should be able at least to identify the reason for the vertical asymmetry of the particle distribution in the projection of the 3D-orbits onto the plane from the orbital shapes (Fig. 8b). We find the BAN family and also the family in the nomenclature of Patsis et al. (2002a).
The BAN family appears stable everywhere above the midplane, except around kpc (Fig. 7b), while ABAN is unstable everywhere and so is not shown here. For , the BAN family is detached from the midplane and starts at kpc. It forms a kind of loop in the characteristic diagram. We do not find any stable orbit below kpc. The family is stable only for a low range in energies and only below the midplane, which makes it important for contributing to the vertical asymmetry in the bar (Fig. 8b).
After the second buckling, Gyr. The bar slowly regains its vertical symmetry, and becomes symmetric after Gyr. As a result of this instability, the bar has developed a pronounced X-shape which differs from the ‘usual’ peanut shape because of the extended concave region between the spikes, i.e., peanuts (Fig. 8c). Orbits which appear at the same in the characteristic diagram but at different time frames differ in their projections. After the second buckling the orbits are longer and extend higher, i.e., the convexity and concavity have significantly changed. The vertical ILR has moved to by 11.8 Gyr. The BAN orbits are stable while ABAN are unstable. Overall, the boxy/peanut bulge has increased in size from kpc (after the first buckling) to kpc (after the second buckling).
The orbits and consequently two ILRs in the -plane appear only after the second buckling, Gyr. Initially occupying a small range in energies, their extent grows with time. The family is mostly stable up to the (mostly) unstable ‘shoulder’ in the characteristic diagram (Fig. 7a, right frame), which has continued to move out to higher Jacobi energies, along with the last stable orbit supporting the bar.
We also use the characteristic diagrams to get an independent estimate for the bar physical size. Unlike the case of analytical bars where this issue is resolved trivially, to estimate the length of the live numerical and ‘observed’ bars can be more difficult. For example, if the bar potential or bar nonaxisymmetric force is used for this purpose, one can get an erroneous result that the bar extends beyond its corotation radius. If one relies on the density distribution, one can overestimate the size as well because the bar can drive a pair of open spirals. Instead, we use the calculated orbital structure of the bar and rely on the properties of family which is generally stable except for narrow gaps (in Jacobi energy) and in the region around the corotation. Specifically, close to the corotation, the curve bends upward (e.g., Fig. 7a; Binney & Tremaine 1987). We use the -axis extent of the last stable orbit which lies on this upward branch. It is the slow drift of unstable gaps and of the elbow of the -curve towards higher which leads to the trapping of orbits and the secular increase in the bar size. A large number of models here and in Berentzen et al. (2005) have been used for the comparison with the isodensities fit to the bar (Section 3).
The bar amplitude shows that the outer half of the bar practically dissolves in the first buckling and weakens substantially in the recurrent buckling (Fig. 2). The ellipse fit to the bar reflects this by a dramatic decrease in the bar length from kpc to kpc in radius. Unfortunately, it is more tricky to estimate the bar size from the orbital analysis at this time — the underlying potential is time-dependent while the analysis is performed in the frozen potential. Nevertheless, both methods agree before and after the the first buckling and capture the change in the growth rate of the bar length after the second buckling. To summarize, the bar size decreases during the first buckling and levels-off during the second one.
The simple explanation for the success of the orbital analysis method is that it is the most self-consistent method known to us and relies on the orbit trapping by the stable periodic family whose existence basically defines the bar. We note that the middle frame of Fig. 7a does show a large unstable gap just below the elbow of curve. However, we note once more that the potential in this frame has not been vertically symmetrized and that the weakening of the bar during this time of buckling is in fact a direct consequence of this gap.
In summary, the characteristic diagrams and their respective orbital families reflect both the dynamical and secular evolution of the bar shown in both Fig. 3 and the Animation Sequence. The ustable gaps, where the vertical families (BAN/ABAN) bifurcate, move toward higher Jacobi energies while the orbits become more extended along the bar axes. The orbital families evolve not just quantitatively but also qualitatively — this shows up in the changing shape of the bar. Although we do not measure the population of the different families, the bar shapes appear to be governed mainly by the BAN family, which evolves by changing the concavity of its orbits, thus giving the bar the pronounced peanut/boxy/X shapes when viewed along the minor axis. The change in the orbital structure of the bar supports our observation, based on independent arguments, that there is a recurrent buckling. At the secondary buckling time, the vertical families differ above and below the plane. The former are stable orbits extending more along the -axis and also giving it more of a boxy shape. The latter ones are stable orbits which give the bar more of a peanut shape. The appearance of the family confirms that the ILRs form only after the second buckling of the bar.
5. Disk–Halo Angular Momentum Exchange: the Role of the Resonances
The disk region which gives rise to a bar is known to lose its angular momentum (). In principle, a number of components in a galaxy can acquire this momentum, namely, the outer disk, the bulge, and the halo. While the former two components are able to store , the responsive (i.e., live) halo can serve as a particularly large angular momentum sink due to its large mass and low . Athanassoula (2002b, 2003) has shown that the disk-halo interaction is mediated by lower resonances. In order to understand more fully the complex behavior exhibited by the model, such as the initial bar growth, its recurrent bucklings, and subsequent secular growth — we find it instructive to determine the balance of the angular momentum and its evolution. We pay particular attention to the resonant interactions between the model components.
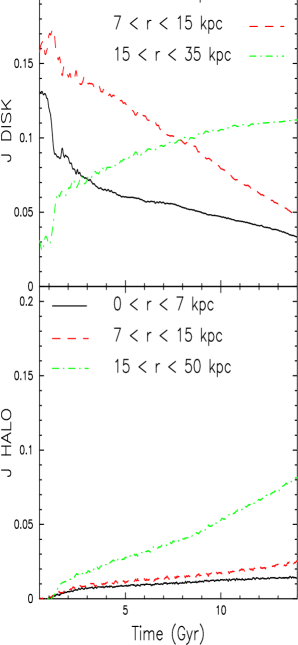

We first determine the overall balance in the different regions of the disk and the halo. Fig. 9 shows the total angular momentum evolution for three different regions in the disk and halo: inner ( kpc), intermediate ( kpc) and outer ( kpc or 15-50 kpc) regions. The inner and intermediate regions are those hosting the bar for various times during its evolution. The time of the bar formation is characterized by a substantial loss of in the inner disk. This angular momentum is redistributed to the intermediate and especially to the outer disk (Fig. 8). During the first buckling, there is some indication that the inner disk gains some angular momentum, and we return to this issue in section 6.2. The subsequent growth of the bar is accompanied by a slow growth in the outer disk and the halo. Interestingly, after the second buckling stops growing in the outer disk, while the outer halo picks-up at an increasing rate. There is a general loss of angular momentum from the disk and there is a general gain in the halo. The loss of in the disk correlates with the slowdown of the bar, which is known to anti-correlate with the growth of the bar (e.g., Athanassoula 2003).
Next, we calculate the contribution of the resonances between disk and halo particles with the bar’s to the angular momentum exchange between the disk and the halo. We generally follow the procedure described in Athanassoula (2002b). The principal frequences, and of azimuthal motion and of radial oscillations of the 3-D orbits, have been determined by means of spectral analysis (Binney & Spergel 1982). We freeze the gravitational potential in the model at times Gyr and 5.2 Gyr, but allow the bar to tumble with its original , and integrate the orbits of randomly-picked particles in the disk and the same amount in the halo for an additional 9.4 Gyr, about 20 bar tumblings. Results are plotted in Fig. 10 as a function of the frequency ratio , where particles are binned in the intervals of (top frames). The difference in angular momentum between the two times is given as a function of at Gyr (bottom frames). The major resonances are located at (ILR and OLR), etc., with the positive indicating the resonances inside the corotation radius and — outside the corotation. The corotation resonance corresponds to .
The resonant and near-resonant particle distributions at the time Gyr are clearly non-uniform and are permeated by numerous resonances. The trapping of orbits by the resonances is also evident. The dominant resonance in the disk appears to be the ILR which traps the largest number of particles and therefore facilitates the loss of the angular momentum from the disk (lower panels of Fig. 10). Note, that we have cut for this resonance to keep the same scales for disk and halo diagrams — it extends to . The within the CR and later on (if populated) orbits, as well as BAN/ABAN orbits are trapped within this resonance. The broad asymmetric peak (Fig. 10a, left panel) in the range of is made out of near-resonant orbits in the (rotating) boxy/peanut bulge, many of them near resonant BAN orbits. Those have been injected during the first buckling. They appear on both sides of the CR because along these orbits oscillates wildly, , and it is sometimes difficult to disentangle the prograde from retrograde ones among them. For comparison, we repeated this procedure at Gyr and confirmed that more than half of the particles in the above broad peaks have been trapped by the nearby ILR and OLR by that time. The resonances for , with CR and OLR as the next strongest ones, absorb the angular momentum and their are all positive.
The halo is dominated by the corotation resonance which absorbs from the disk. Overall, the disk resonances emit and the halo resonances absorb . This behavior was demonstrated by Athanassoula (2002b, 2003), where similar plots to Fig. 10 were given and there is a very good agreement between our results. The only difference we find is that the halo ILR is actually losing in our model, albeit a small amount, unlike in Athanassoula’s models. The modeled halo extends well beyond the disk and its outer part appears to be actively storing , up to . This effect is confirmed by the overall evolution in the halo (Fig. 9). We find that the trapping of orbits by the resonances is robust — almost all the particles trapped at Gyr remain trapped at 5.2 Gyr. The ability of the barred disk to transfer its angular momentum to the halo while saturates in the outer disk, explains why the bar is able to grow during this time interval as exhibited by the amplitude and the size of the bar (e.g., Figs. 2–5). It is this growth of the bar which is ultimately responsible for the recurrent buckling phenomenon analyzed here.
6. Discussion
We have modeled the evolution of collisionless (stellar) bars embedded in responsive (live) axisymmetric dark matter halos using high-resolution -body simulations. We find that (1) bars experience secular growth over the simulation ( Hubble) time, except (2) during well defined time periods when the bars encounter spontaneous breaks of vertical symmetry, so-called buckling (or firehose) instability (e.g., Fig. 3 and the Animation Sequence 1). We detect such a recurrent buckling during which the bar, and especially its outer half, weakens substantially, but the growth is resumed subsequently. Two different techniques have been used to measure the bar size, namely, the nonlinear orbital analysis and the isodensity ellipse fitting. The bar strength has been measured using the amplitude of mode, and the bar vertical asymmetry — using the vertical mode. Moreover, we have analyzed the bar evolution and its buckling periods by means of the nonlinear orbit analysis and the ratio of vertical-to-planar velocity dispersions. Finally, we have examined the bar development in terms of the angular momentum redistribution between various components in the disk-halo system mediated by the resonant interactions using orbital spectral analysis.
Low resolution -body simulations exhibit fast (e.g., during one disk rotation) stellar bar growth, followed by a vertical buckling and secular weakening. High-resolution simulations with show a more complex evolution. They allow for modeling the disks embedded in live halos and account for the resonant interactions between the halo and the disk, adding a new and crucial element to the simulations in the form of angular momentum transfer between these components. The main difference with the previous low-resolution models and that presented in this work is the ability of the stellar bar to strengthen again after its original weakening following the buckling — a process which leads to the bar growth and consequently to its recurrent buckling.
6.1. Disk-Halo Resonant Interactions
The bar growth has been associated with the existence of ‘sinks’ of angular momentum located elsewhere. Athanassoula (2002b, 2003) has shown that a galactic halo can play such a role and absorb large quantities of angular momentum from the disk/bar region. This effect appears to completely invert the original suggestion by Ostriker & Peebles (1973) about the stabilizing function of dark matter halos in disk galaxies against the bar formation instability. Angular momentum redistribution, at least in principle, can have contributions both from the non-resonant and resonant interactions between the bar and orbits in the halo. To capture the latter requires large to stabilize the population of resonant particles (e.g., Weinberg & Katz 2002).
It is therefore important to demonstrate that resonant particles are indeed responsible for the angular momentum transfer in the first place. We start with the relative contributions to the transfer between the disk and the halo and between the inner (i.e., bar unstable kpc) and outer disks (Fig. 9). Although the efficiency of this redistribution is of course model dependent, we nevertheless quote the numbers, assuming that to a certain degree, they are representative. We find that of the angular momentum in the disk is lost to the halo during the evolution. The bar unstable region, kpc has lost about 71% of its original , of which about 38% went to the outer disk and the rest was absorbed by the halo. The most intensive flow of to the outer disk happens in the early stage which ends with the first buckling. The halo particles have much larger dispersion velocities than the disk and until the bar fully develops, their resonant interaction with the asymmetry in the disk is virtually non-existent.
After the first buckling, it is the halo which absorbs most of the angular momentum lost by the bar region and from Fig. 9 (lower frames) it is clear that the lion share of this exchange is resonant and mediated by the CR and the OLR in the halo and by the ILR and the CR in the disk, with some contribution from the numerous minor resonances. This results in the increase of the bar size and strength, and leads to the gradual decrease in the ratio of the velocity dispersion, , in a close analogy with the disk evolution preceeding the first buckling. The secondary buckling of the bar, therefore, can be directly traced to its robust growth in our model.
The issue of a bar dissolution vs. growth has become controversial recently. While it is beyond the scope of this work, indirectly we do touch it. First, we confirm the results of Martinez-Valpuesta & Shlosman (2004) that vertical bucklings do not destroy the bar, unlike suggested by Raha et al. (1991; see also Sellwood & Wilkinson 1993). Next, in various axisymmetric models, here and in Berentzen et al. (2005), a robust growth in the bar is observed after the first buckling, supplemented by the angular momentum exchange between the disk and the halo. Athanassoula (2003) has analyzed the effect of initial conditions on this redistribution, namely, of the initial disk-to-halo mass ratio and of the Toomre’s Q-parameter — the angular momentum exchange varied from to with a clear correlation between the amount of the exchanged momentum and the size of the bar. In comparison, our models have a halo-to-disk mass ratio of unity within the central 10 kpc, , and a halo core of kpc. They lie between the models MH1, M3-4 and MQ4 of Athanassoula.
Interestingly, Valenzuela & Klypin (2003) argued that it is the mass and force resolutions of numerical models which dictate the efficiency of transfer to the halo and hence play an important role in the evolution of the bar. Insufficient resolution results in an excessive growth of numerical bars and an excessive decrease in the bar pattern speed. However, it seems rather that the physical conditions mentioned above take priority — their high resolution models have extended and hot halos. High dispersion velocities in the halo affect the particle trapping by the resonances and so are expected to lower substantially the transfer.
6.2. Bar size evolution
If one neglects the dissipative component in a modeled galaxy, the bar pattern speed decreases secularly, except during brief time intervals of internal instabilities in the bar itself. At least in numerical models of stellar bars, their overall slowdown is accompanied by an increase in the bar length, so the bar roughly extends to its corotation radius which increases with time (Athanassoula 1992). Alternative theoretical models of bars terminating at the ILR exist (Lynden-Bell 1979), but difficulties remain in actually reproducing them in numerical simulations (but see e.g., Polyachenko & Polyacnenko 1994 for the so-called slow bars). A sole exception consists of a system of nested bars, where the inner (nuclear) bars form within the ILR (e.g., Shlosman, Frank & Begelman 1989; Friedli & Martinet 1993; Englmaier & Shlosman 2004). However, a dissipative component is required to be present for self-consistency in this case. How exactly the bar traps the disk orbits in order to increase its length is not known at present.
We have demosntrated that while the size of the bar, , drops during the first buckling (Fig. 2a), the ratio of (Fig. 1b) does not increase dramatically above the range of determined by Athanassoula (1992) to fit the observed shapes of the offset dust lanes in barred galaxies. Amazingly, the reason for this is that drops as well due to the sudden increase in the bar pattern speed in the same time interval. This is not unexpected due to a clear trend between and (Athanassoula 2003) and a long known fact that the bar lengthens with its slowdown in numerical simulations. What is new here is that we find that increases sharply during the first buckling and this increase apparently correlates with the sudden decrease in the bar length. Hence the relation between between , and appears to be more fundamental than anticipated and holds for decelerating and accelerating bars altogether.
We associate the continued bar growth with the ability of the halo to absorb angular momentum from the disk region lying within the corotation radius — a region which itself expands with time. This process leads to a stronger bar and can be seen as a counterbalance to a number of other processes which have been discussed in the literature within the framework of bar dissolution. Recent observational results from Galaxy Evolution from Morphology and SEDs (GEMS, Rix et al. 2004) survey have shown that the bar size and axial ratio distributions at intermediate redshifts of are compatible with those in the local Universe (Jogee et al. 2004; Elmegreen et al. 2004; Sheth et al. 2003). Our models which exhibit a slow secular bar growth over the Hubble time are in general agreement with these results. They do lack the gaseous component which can dramatically shorten the bar life cycle (e.g., Bournaud & Combes 2002). However, it is difficult to understand how the short-lived (e.g., less than 1.5 Gyr [Bournaud & Combes 2002; Combes 2005]) bars can form at the same rate and with the same sizes and axial ratios they are being destroyed by the gas. Yet, taken at the face value, in order to agree with the GEMS results, the bars must preserve their size and strength distributions nearly unchanged over the last 8 Gyr. Clearly, the precise role of gas in the bar evolution must still be determined.
6.3. Bar shape evolution
Next we focus on some aspects of the bar 3-D shape evolution in the model, specifically on the axial ratio in the bar midplane and on the bar symmetry in the vertical plane. The midplane axial ratio, or alternatively the bar ellipticity , is measured from the ellipse fitting (Fig. 4c) and agrees with the evolution of the bar amplitude . At the same time, the variations in appear less dramatic than in , although recurrent bucklings are clearly visible as a decrease or saturation.
The ratio has also dynamical implications for the bar. For example, it determines the shape of the offset dust lanes in barred galaxies, which in turn delineate shocks in the gas flow (Athanassoula 1992). The strength of the underlying shocks determines the gas inflow towards the central kpc. A bar which is considerably weakened will slow down the radial gas inflow. The observed shapes constrain the ratio to . The modeled ratio (Fig. 4b) typically falls within the required limits except during the first buckling when it is higher, .
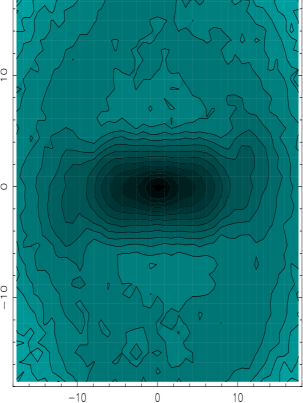
After the second buckling, the bar shows the so-called ansae (handles) on both its ends. We observe them as characteristic density enhancements in the face-on (Fig. 11) or edge-on (Fig. 3) disks. Athanassoula (2001) related the appearance of ansae to initial conditions in the models (e.g., the halo-to-disk mass ratio). It remains unknown why they appear at this particular evolutionary stage, Gyr. The ansae can be seen in some early-type barred galaxies, e.g., NGC 4262, NGC 2859 and NGC 2950 (Sandage 1961), NGC 4151 (Mundell & Shone 1999), ESO 509-98 (Buta et al. 1998), etc.
Vertically, the bar evolves from a geometrically thin configuration, similar to the disk hosting it. The vertical bar buckling, when viewed along the bar’s minor axis, shows a rapidly evolving bending which relaxes to a boxy shaped bulge, i.e., bulge with flat or mildly convex isodensities (Fig. 8a). Subsequently, the bulge acquires a peanut shape. During the second buckling, for Gyr, the vertical asymmetry persists with one-sided boxy and peanut symmetries which derive from the asymmetric BAN family (Fig. 8b). With the asymmetry washed out, the boxy/peanut bulge/bar has a pronounced X-shape: two pointed spikes with a large concave region in between (Fig. 8c). The X-shapes have been seen before in numerical simulations (e.g., Athanassoula & Misiriotis 2002) and have been observed as well (e.g., NGC 4845, NGC 1381, IC 4767 (Whitmore & Bell 1988), IC 3370 (Jarvis 1987) and AM 1025-401 (Arp & Madore 1987; Bureau & Freeman 1999; Patsis et al. 2002a). Mihos et al. (1995) proposed a merging scenario for the formation of the X-shaped bulges, e.g., a minor merger for Hickson 87a galaxy. This merger triggers the bar instability in the disk, followed by the buckling and the X-shaped bulge, when viewed from a specific aspect angle. In principle, there may be more than one cause for the bar buckling and for the formation of peanut/boxy/X-shaped bulges. But when taken together, a high observed frequency of these bulges (Lütticke et al. 2000) and the need for only mild asymmetry in the disk for their appearance (Patsis et al. 2002b) may hint to their intrinsic origin.
6.4. Vertical asymmetry of the bar
The vertical asymmetry of the modeled bar has been detected during its recurrent bucklings, for about 1 Gyr and Gyr, respectively (Figs. 3, 5). Its characteristic shape, in principle, is detectable by observations of edge-on galaxies (e.g., Fig. 3 and the Animation Seq. 1), especially during the second buckling due to its prolonged period. Observationally, the bucklings differ when viewed edge-on along the bar minor axis. The main difference is the location of the maximal asymmetry — it is close to the rotation axis during the first buckling and around the middle region of the bar during the second buckling.
Lütticke et al. (2000) present first statistics of edge-on galaxies with the boxy/peanut bulges and show some isophote fits (their Fig. 2). They distinguish between peanut-shaped and boxy-shaped bulges. A total of 27% of the sample of 734 galaxies with boxy/peanut bulges have bulges which are either close to boxy or, due to low resolution, could not be distinguished between boxy and peanuts. Some of these bulges show a mild vertical asymmetry similar to that found during the second buckling, e.g., NGC 4289 — a good example of a possible observed secondary buckling. Of course, to corroborate the numerical simulations one needs a large, statistically significant sample with high resolution. The main difficulty lies in the unambigious determination of the inclination angle of a galactic disk — it must be edge-on within .
From a theoretical point of view, it is unclear how wide-spread is the recurrent buckling in stellar bars — how sensitive it is to disk and especially halo parameters, such as mass distribution and dispersion velocities. While the condition for a second buckling seem to be directly related to the ability of the bar to strengthen after the initial weakening, this process can depend on a number of additional parameters. For example, Athanassoula (2003) has found that the angular momentum transfer between the disk and the halo depends on the mass distribution in the halo and weakens substantially for hotter halos. Berentzen et al. (2005) have detected a recurrent buckling in their LS2 model with 2 kpc flat core (live) halo with a logarithmic potential. At the time of the second buckling, the bar in this model appears somewhat stronger than in the first buckling. Moreover, the secondary buckling can be apparently seen in Fig. 4 of O’Neil & Dubinski (2003) and also in Fig. 11 of Valenzuela & Klypin (2003), the latter based on the evolution of the bar pattern speed, strength and the angular momentum rate change. Secondary buckling is also present in some models of L. Athanassoula (private communication 2005). In all the cases they went unnoticed. Lastly, we comment on the addition of the dissipative component to the stellar disk (Berentzen et al. 1998). The effect of the clumpy gas component is to weaken the buckling instability, but without quantifying the degree of clumpiness within the central kpc, it is not clear whether the isothermal equation of state used has led in fact to over-damping of this instability.
7. Conclusions
To summarize this work, we have studied the long-term stellar bar evolution in a high-resolution self-consistent model of a disk and a responsive halo. We find that a developing bar goes through the vertical buckling instability which weakens it and dissolves its outer half. Subsequently, the bar experiences a renewed growth which leads to a recurrent buckling. This evolution is driven by the resonant interaction between the barred disk and the surrounding halo — we quantify this effect by means of the spectral analysis of individual orbits in the disk and the halo and show that the halo particles are trapped by numerous lower resonances with the bar and that this trapping is robust. During these periods of recurrent instability, and especially during the slower second buckling, the bar remains vertically asymmetric for a prolonged Gyr time interval — which in principle can be detected observationally. However, two issues can potentially complicate this detection. First, it is not clear how widespread are the conditions favorable for the recurrent bar growth, although we have detected it in a number of models with different initial conditions. Second, while it was shown that a clumpy gaseous component with an isothermal equation of state in the disk will weaken this instability, the effect of a realistic ISM was never estimated. A statistically significant sample of (nearly) edge-on galaxies is required to test the prediction of a prolonged vertical asymmetry.
We also find that the secular bar growth and the triggered buckling instabilities lead to pronounced changes in the bulge shape — it grows both radially and vertically, acquiring a peanut, a boxy and finally the X-shaped appearance. While the bar size approximately follows the 4:1 (Ultra-Harmonic) resonance in the disk, the boxy/peanut bulge size appears to be guided by the vertical ILR. Concurrently, the bar is going through a structural evolution — new families of 3-D periodic orbits appear (or become more pronounced) after the bucklings.
Finally, we find that the bar strength correlates with its pattern speed, in both strengthening and weakening bars. While it was known already that a stellar bar becomes stronger as it slows down, we detect the reverse trend as well — bars that weaken during the buckling speed up their tumbling. Moreover, the bar size appears to be sensitive to these changes — slowing down bars become longer, while speeding up bars shorten.
References
- (1) Arp, H.C. Madore, B. 1987, A Catalogue of Southern Peculiar Galaxies & Associations (New York: Cambridge Univ. Press)
- (2) Athanassoula, E. 1984, Phys. Reports, 114, 320
- (3) Athanassoula, E. 1992, MNRAS, 259, 345
- (4) Athanassoula, E. 2001, New Horizons of Computational Science, (Eds.) T.Ebisuzaki & J.Makino (Dordrecht: Kluwer Acad. Publ.), 312 (astro-ph/0112076)
- (5) Athanassoula, E. 2002a, Disks of Galaxies: Kinematics, Dynamics & Interactions, (Eds.) E. Athanassoula, A. Bosma, and R. Mujica (ASP Conf. Ser., Vol. 275), 141
- (6) Athanassoula, E. 2002b, ApJ, 569, L83
- (7) Athanassoula, E., Misiriotis, A. 2002, MNRAS, 330, 35
- (8) Athanassoula, E. 2003, MNRAS, 341, 1179
- (9) Barnes, J., Hut. P. 1986, 324, 446
- (10) Berentzen, I., Heller, C.H., Shlosman, I., Fricke, K. 1998, MNRAS, 300, 49
- (11) Berentzen, I., Shlosman, I., Jogee, S. 2006, ApJ, 637, in press (astro-ph/0501352)
- (12) Binney, J., Spergel, D. 1982, ApJ, 252, 308
- (13) Binney, J., Tremaine, S. 1987, Galactic Dynamics, Princeton Univ. Press
- (14) Bournaud, F., Combes, F. 2002, A&A, 392, 83
- (15) Bureau, M., Freeman, K.C. 1999, ApJ, 118, 126
- (16) Buta, R. et al., 1998, AJ, 116, 1142
- (17) Combes, F. Sanders, R.H. 1981, A&A, 96, 164
- (18) Combes, F., Debbasch, F., Friedli, D., Pfenniger, D. 1990, A&A, 233, 82
- (19) Combes, F. 2005, The Interplay Among Black Holes, Stars and ISM in Galactic Nuclei, (Eds.) Th. Storchi-Bergmann, L.C. Ho & H.R. Schmitt Proc. IAU 222, in press (astro-ph/0404210)
- (20) Contopoulos, G., Papayannopoulos, T. 1980, A&A, 92, 33
- (21) Debattista, V.P., Sellwood, J.A. 1998, ApJ, 493, L5
- (22) Debattista, V.P., Sellwood, J.A. 2000, ApJ, 543, 704
- (23) Denhen, W. 2002, J. Comp. Phys., 179, 27
- (24) Elmegreen, B. G., et al. 2004, ApJ, 612, 191
- (25) El-Zant, A., Shlosman, I. 2002, ApJ, 577, 626
- (26) Englmaier, P., Shlosman, I. 2004, ApJ, 617, L115
- (27) Fall, S.M., Efstathiou, G. 1980, MNRAS, 193, 189
- (28) Friedli, D., Pfenniger, D. 1990, ESO/CTIO Workshop on Bulges of Galaxies, eds., B. Jarvis & D.M. Terndrup, p. 265
- (29) Friedli, D., Martinet, L. 1993, A&A, 277, 27 187),
- Heller (1995) Heller, C. H. 1995, ApJ, 455, 252
- (31) Heller, C.H., Shlosman, I., 1994, ApJ, 424, 84
- (32) Heller, C.H., Shlosman, I. 1996, ApJ, 471, 143
- (33) Hernquist, L., Weinberg, M.D. 1992, ApJ, 400, 80
- (34) Hunt, L. K., Malkan, M. A. 2004, ApJ, 616, 707
- (35) Jarvis, B.J. 1986, AJ, 91, 65
- (36) Jogee, S., Barazza, F.D., Rix, H.-W. Shlosman, et al. 2004, ApJ, 615, L105
- (37) Knapen, J.H., Shlosman, I., Peletier, R.F. 2000, ApJ, 529, L93
- (38) Laine, S, Shlosman, I., Knapen, J.H., Peletier, R.F., 2002, ApJ, 567,97
- (39) Lütticke, R., Dettmar, R.-J., Pohlen, M. 2000, A&AS, 145, 405
- (40) Lynden-Bell, D. 1979, MNRAS, 187, 101
- (41) Martinez-Valpuesta, I. & Shlosman, I. 2004, ApJ Letters, 613, 29
- (42) Merrifield, M.R., Kuijken, K. 1999, A&A, 345, L45
- (43) Merritt, D., Sellwood, J.A. 1994, ApJ, 425, 551
- (44) Mihos, J.C., Walker, I.R., Hernquist, L., Mendes de Oliveira, C., Bolte, M. 1995, ApJ, 447, L87
- (45) Mundell, C.G., Shone,D.L. 1999, MNRAS, 304 475
- (46) O’Neil, J.K., Dubinski, J. 2003, MNRAS, 346, 251
- (47) Ostriker, J. P. & Peebles, P. J. E. 1973, ApJ, 186, 467
- (48) Patsis, P.A., Skokos, Ch., Athanassoula, E. 2002a, MNRAS, 337, 578
- (49) Patsis, P.A., Athanassoula, E., Grosbol, P., Skokos, Ch. 2002b, MNRAS, 335, 1049
- (50) Pfenniger, D. 1984, A&A, 134, 373
- (51) Pfenniger, D., Friedli, D. 1991, A&A, 252, 75
- (52) Polyachenko, V.L., Polyachenko, E.V. 1994, Astronomy Letters, 20, 416
- (53) Raha, N., Sellwood, J.A., James, R.A., Kahn, F.D. 1991, Nature, 352, 411
- (54) Rix, H. et al. 2004, ApJS, 162, 163
- (55) Sandage, A. 1961, The Hubble Atlas of Galaxies (Washington, D.C.: Carnegie Institution of Washington)
- (56) Sellwood, J.A. 1980, A&A, 89, 296
- (57) Sellwood, J.A., Wilkinson, A. 1993, Rep. Prog. Phys., 56, 173
- (58) Sellwood, J.A. 1996, Barred galaxies, (Eds.) R.Buta, D.A. Crocker & B.G. Elmegreen (San Francisco: ASP Conf. Ser., Vol. 91), 259
- (59) Shaw, M.A. 1987, MNRAS, 229, 691
- (60) Shen, J., Sellwood, J.A. 2004, ApJ, 604, 614
- (61) Sheth, K., Regan, M. W., Scoville, N. Z., Strubbe, L. E. 2003, ApJL,592, L13
- (62) Shlosman, I., Frank, J., Begelman, M.C. 1989, Nature, 338, 45
- (63) Skokos, Ch., Patsis, P.A., Athanassoula, E. 2002a, MNRAS, 333, 847
- (64) Skokos, Ch., Patsis, P.A., Athanassoula, E. 2002b, MNRAS, 333, 861
- (65) Sotnikova, N.Y., Rodionov, S.A. 2005, Astronomy Letters, 31, 15
- (66) Toomre, A. 1966, Geophysical Fluid Dynamics, Notes on Summer Study Prog. Woods Hole Oceanographic Institution, No. 66-46, 111
- (67) Valenzuela, O., Klypin, A. 2003, MNRAS, 345, 406
- (68) Weinberg, M.D. 1985, MNRAS, 213, 451
- (69) Weinberg, M.D., Katz, N. 2002, ApJ, 580, 627
- (70) Whitmore, B.C., Bell, M. 1988, ApJ, 324, 741