11email: steiner@astro.iag.usp.br 22institutetext: SOAR Telescope, Chile
22email: aoliveira@ctio.noao.edu
A hot story with many tales: the qWR star HD~45166 ††thanks: Based on observations made at the 1.5m ESO telescope at La Silla, Chile, and at Laboratório Nacional de Astrofísica/CNPq, Brazil
The binary star HD~45166 has been observed since 1922 but its orbital period has not yet been found. It is considered a peculiar Wolf-Rayet star, and its assigned classification varied along the years. For this reason we included the object as a candidate to the class of V Sge stars and performed spectroscopy in order to search for its putative orbital period. High-resolution spectroscopic observations show that the spectrum, in emission and in absorption, is quite rich. The emission lines have great diversity of widths and profiles. The full widths at half maximum vary from 70 km s-1 for the weakest lines up to 370 km s-1 for the most intense ones. The Hydrogen and Helium lines are systematically broader than the CNO lines. Assuming that HD~45166 is a double-line spectroscopic binary, it presents an orbital period of P = 1.596 0.003 days, with an eccentricity of e = 0.18 0.08. In addition, a search for periodicity using standard techniques reveals that the emission lines present at least two other periods, of 5 hours and of 15 hours. The secondary star has a spectral type of B7 V and, therefore, should have a mass of about M2 = 4.8 M☉. Given the radial velocity amplitudes, we determined the mass of the hot (primary) star as being M1 = 4.2 0.7 M☉ and the inclination angle of the system, i = 0.77 0.09. As the eccentricity of the orbit is non zero, the Roche lobes increase and decrease as a function of the orbital phase. At periastron, the secondary star fills its Roche lobe. The distance to the star has been re-determined as d = 1.3 0.2 kpc and a color excess of has been derived. This implies an absolute magnitude of for the primary star and for the B7 star. We suggest that the discrete absorption components (DACs) observed in the ultraviolet with a periodicity similar to the orbital period may be induced by periastron events.
Key Words.:
Techniques: spectroscopic – binaries: spectroscopic – Stars: Wolf-Rayet.1 Introduction
HD~45166 has been observed since 1922, being an enigma that up to now has not been deciphered. Anger (ange (1933)) described observations done between 1922 and 1933, showing that the emission spectrum is highly variable. The He ii 4686 Å line is always present, with variable intensity, while the lines of N iii 4640 Å and N iv 4058 Å appear and disappear completely. The star has been observed ever since, but no photometric or spectroscopic periodic variation has been discovered, in spite of the suspicions that it is, in fact, a binary system.
The spectral classification assigned to this object has been varying along the years. Anger (ange (1933)) proposed that the object is a Wolf-Rayet of the type WN. Neubauer & Aller (neub (1948)) classified it as a W7n. Morgan et al. (morg (1955)) classified it as Bpe while Hiltner & Schild (hilt2 (1968)) recovered the WR classification. Hiltner (hilt1 (1956)) described the object as having high excitation emission lines superposed upon an approximately O9 spectral type. Heap & Aller (heap (1978)), in a frequently cited (see for instance Willis & Stickland will1 (1983) – WS83) but never published paper, classified the star as B8 V + qWR, that is, a binary with a B8 V component and a ”quasi” Wolf-Rayet one. WS83 proposed a classification of B8 V + SdO – a main sequence star and a hot sub-dwarf. The Sixth Catalog of Galactic Wolf- Rayet Stars (van der Hucht et al. huch1 (1981)) recovers for HD~45166 the classification proposed by Heap & Aller (heap (1978)) (B8 V + qWR) and puts it, together with V~Sge, in the category of low mass WR, composed by only these two objects. This category does not exist in the Seventh Catalog of Galactic WR Stars (van der Hucht huch2 (2001)), since neither HD~45166 nor V~Sge are included in this catalog.
The star differs from a classic Population I WR in the sense that its emission lines are very narrow (typically full width at half maximum (FWHM) = 300 km s-1 for the He ii lines). Besides, the object presents both characteristics of WN and WC simultaneously and seems to have a significant abundance of Hydrogen judging from the He ii Pickering decrement (Heap & Aller heap (1978); WS83). The object has a much smaller luminosity than a population I WR.
Van Blerkom (bler (1978)) made an analysis of the Hydrogen and Helium lines with the hypothesis that it is a population I WR object. He concluded that the WR component has a radius of 1 R☉ and has a small size envelope that expands with a velocity of 150 km s-1, which results in number densities of He ii of about cm-3 and mimics the environment of a WR envelope. He found that the wind density is cm-3 and cm-3, and the mass loss rate, M☉ year-1. On the other hand, WS83 obtained, on the basis of ultraviolet observations with the IUE satellite, the following parameters for the WR component: M; T K; (L/L☉)=3.84; R=0.77 R☉ and M1=0.5 M☉. They obtained, also, a distance of 1 208 pc from spectroscopic parallax of the secondary star and a reddening of =0.15 derived from the 2200 Å interstellar extinction band.
Willis et al. (will2 (1989)) – WHSH89 – based on a sequence of high resolution IUE spectra, found an extreme constancy of the UV continuum, in contrast to the variability of the line spectrum. On long time scales they found variability in the intensities of the C iv, N iv, N v and He ii emission lines. On short time scales, however, they found variability exclusively in the C iv 1559 Å doublet absorption lines. These short time scale variations ( day) are seen as discrete absorption components (DACs) characterized by two main features, with mean velocities of km s-1 and km s-1. DACs are usually found in stars with P Cygni profiles. They can also be seen in luminous OB stars as well as in some SdO stars (see Brown et al. brown (2004) for a recent review on DACs). In HD~45166, both components are observed to migrate in velocity with an acceleration of cm s-2, a recurrence time of 1.60 0.15 days and average lifetime of approximately 3 days. WHSH89 considered that these DACs in HD~45166 could result from structural changes in the wind, produced by radiative instabilities.
Until now photometric variability has not been detected in HD~45166. Ross (ross (1961)) made observations on 24 nights and did not find any variation. WHSH89 performed 36 hours of UV observations with the IUE satellite and did not find any variation with amplitude larger than 0.02 magnitudes, that is, within the accuracy limit of the data. The photometric measurements published in the literature are summarized in the Table 1.
There are several properties in common between HD 45166 and the V Sge stars: Van der Hucht et al. (huch1 (1981)) already compared the system to V~Sge. With the parameters proposed by WS83 its mass ratio is inverted as in the V Sge stars. Moreover, its emission line properties are quite similar. Therefore, we included HD 45166 in our ongoing search program for V Sge stars.
The V Sge stars are a group of 4 stars defined by Steiner & Diaz (stei98 (1998)): V~Sge (Herbig et al. herb (1965); Diaz diaz99 (1999)), WX~Cen (Oliveira & Steiner olivwx (2004); Diaz & Steiner diaz95 (1995)), V617~Sgr (Steiner et al. stei99 (1999); Cieslinski et al. cies (1999)) and DI~Cru (Oliveira et al. olivdi (2004); Veen et al. veen (2002)). They are characterized by the presence of strong emission lines of O vi and N v. Besides, He ii 4686 Å is at least two times more intense than H. The V Sge stars are very similar to the Close Binary Supersoft X-rays Sources – CBSS – common in Magellanic Clouds, but not that frequent in the Galaxy. The CBSS are interpreted as binary systems with a white dwarf that presents hydrostatic Hydrogen nuclear burning on its surface. This burning is due to the high mass transfer rate which is a consequence of the inverted mass ratio (see Kahabka & van den Heuvel kah (1997), for a review and references).
The similarities between the spectra of HD~45166 and of the V Sge stars are the simultaneous presence of WN and WC characteristics, strong lines of Hydrogen, as well as the ratios and widths of the emission lines. The main differences are that HD~45166 presents a spectrum of lower ionization: in spite of having N v, it doesn’t present O vi. Besides, the star also presents He i emission lines, differently from the V Sge or CBSS objects. On the other hand, unlike HD~45166, no V Sge star or CBSS has the spectrum of the secondary star published up to now.
In the next section we will describe our observations. In Sects. 3 and 4 we describe the optical spectrum of HD 45166 and the spectral classification of the secondary star. In Sect. 5 we derive the orbital period while in Sect. 6, two additional periods are proposed. In Sect. 7, the masses and orbital inclination are derived. In Sects. 8 and 9 we present a discussion and conclusions. In an accompanying paper (Paper II) we study the structure of the wind and discuss the nature of the system.
| Band | Measurement | Refs. |
| 9.983; 9.88 | Menzies et al. (mara (1990)); Hiltner (hilt1 (1956)) | |
| Menzies et al. (mara (1990)); Hiltner (hilt1 (1956)) | ||
| Menzies et al. (mara (1990)); Hiltner (hilt1 (1956)) | ||
| 0.072 | Menzies et al. (mara (1990)) | |
| 0.108 | Menzies et al. (mara (1990)) | |
| 10.18; 9.81 | Ulla & Thejll (ulla (1998)); 2MASS all-sky survey | |
| 10.12; 9.75 | Ulla & Thejll (ulla (1998)); 2MASS all-sky survey | |
| 10.00; 9.57 | Ulla & Thejll (ulla (1998)); 2MASS all-sky survey |
2 Observations
We made spectroscopic observations of HD~45166 from 1998 to 2004 (Table 2), using the Coudé spectrograph at the 1.6 m telescope of Laboratório Nacional de Astrofísica (LNA) in Itajubá, Brazil, and the Fiber-fed Extended Range Optical Spectrograph (FEROS) (Kaufer et al. kauf (1999)) at the 1.52 m telescope of the European Southern Observatory (ESO) in La Silla, Chile.
At the Coudé spectrograph we employed 600 l mm-1 and 1800 l mm-1 gratings, resulting in spectral resolution of 0.7 and 0.2 Å FWHM and reaching S/N of about 20 to 30 at the continuum. We used a retro-illuminated Site () CCD detector with 24 micrometers resolution elements. Several exposures of bias and flatfield were obtained to correct for the sensitivity of the CCD. Measurements of dark current were not necessary. The slit of the spectrograph was adjusted to 250 m (about 1.1 arcsec). Observations of Thorium lamps were made for the purpose of wavelength calibration. The data reduction was performed with the standard procedures, using IRAF 111IRAF is distributed by the National Optical Astronomy Observatories, which are operated by the Association of Universities for Research in Astronomy, Inc., under cooperative agreement with the National Science Foundation. routines. Typical calibration residuals were of 2 mÅ for the 1800 l mm-1 grating observations.
| Date (UT) | Telescope | Spectral | Exp. | number | Spectral |
|---|---|---|---|---|---|
| resolution (Å) | time (min) | of exps. | coverage | ||
| 1998 Apr 10 | 1.6m LNA | 0.7 | 2 | 14 | 4520 to 4960 Å |
| 1998 Apr 11 | 1.6m LNA | 0.7 | 2 | 12 | 4520 to 4960 Å |
| 1999 Nov 23 | 1.6m LNA | 0.2 | 10 | 3 | 4590 to 4740 Å |
| 1999 Nov 24 | 1.6m LNA | 0.2 | 10 | 21 | 4590 to 4740 Å |
| 1999 Nov 26 | 1.6m LNA | 0.2 | 10 | 18 | 4590 to 4740 Å |
| 1999 Nov 27 | 1.6m LNA | 0.2 | 10 | 27 | 4590 to 4740 Å |
| 2002 Jan 24 | 1.52m ESO | 0.1 | 15 | 14 | 3600 to 9200 Å |
| 2002 Jan 25 | 1.52m ESO | 0.1 | 15 | 10 | 3600 to 9200 Å |
| 2002 Jan 26 | 1.52m ESO | 0.1 | 15 | 11 | 3600 to 9200 Å |
| 2002 Jan 27 | 1.52m ESO | 0.1 | 15 | 5 | 3600 to 9200 Å |
| 2004 Feb 17 | 1.6m LNA | 0.7 | 10 | 5 | 4050 to 5180 Å |
| 2004 Feb 18 | 1.6m LNA | 0.7 | 10 | 4 | 4050 to 5180 Å |
The FEROS spectrograph, on the other hand, uses a bench mounted echelle grating with reception fibers in the Cassegrain focus. Its measured spectral resolving power is R = 48 000. A completely automatic online reduction system was available (Stahl et al. stahl (1999)) and was adopted by us. We obtained a total of 40 spectra with integration times of 15 minutes and readout time of about 7 minutes. The signal-to-noise ratio at the continuum for each individual spectrum was typically S/N=80 at the central wavelength region (4500 through 7000 Å), decreasing to about S/N=35 at the blue and red edges of the spectrum. The wavelength calibration residuals were of 7 mÅ. We cut the spectra in slices of 250 Å to normalize each slice by interactively fitting a low order Legendre polynomial to the continuum.
3 The optical spectrum
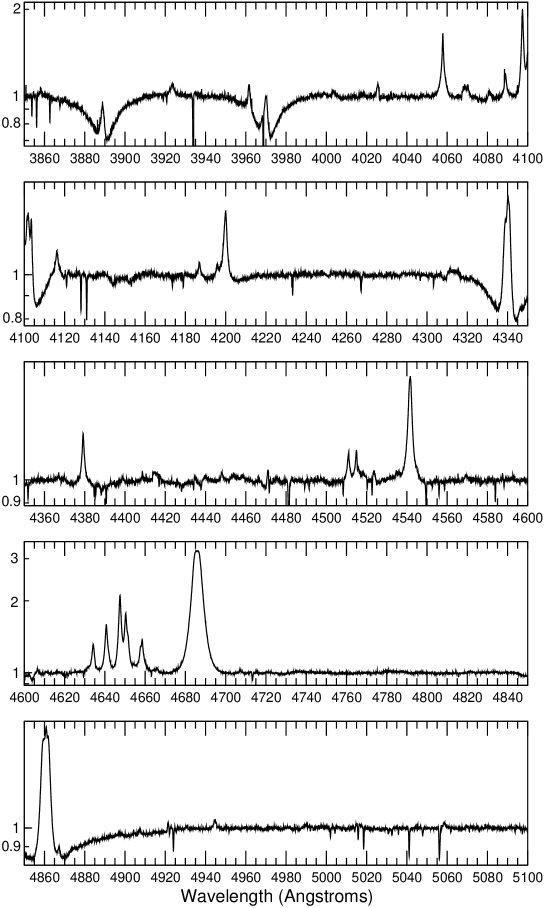
The average of the 40 spectra obtained with the FEROS spectrograph is presented in Fig. 1 in logarithmic scale, in order to show a maximum amount of details to the reader. It presents a large set of lines in absorption as well as in emission (please note the large number of telluric absorption lines). Quantitative characteristics of the lines are presented in Tables 3, 4 and 5. The spectrum in absorption presents lines of H, He i, C ii, N i, O i, Mg ii, Si ii and Fe ii. Weak lines in absorption of C i, Mg i, Al ii, Si i, P ii, S ii, Cr ii, Fe i, and Ni ii are also present. The Fe ii lines present an average heliocentric velocity of km s-1, where the uncertainty is the standard deviation divided by the square root of the number of measurements. This km s-1 uncertainty is 30 times better than the spectral resolution. The lines of Si ii have km s-1 and the lines of O i, km s-1. He i lines present km s-1. The discrepancy between the radial velocities of He i lines and the other lines can be explained by the emission that can be seen in the blue wings of some of the He i lines as in the case of He i 4713 Å.
![[Uncaptioned image]](/html/astro-ph/0507211/assets/x2.png)
![[Uncaptioned image]](/html/astro-ph/0507211/assets/x3.png)
![[Uncaptioned image]](/html/astro-ph/0507211/assets/x4.png)
A complete list of absorption lines is given in Table 3 for all of the absorption lines with Å. Besides the measured wavelength we supply, also, the rest wavelength (in parenthesis), the radial velocity in the heliocentric system, the equivalent width, the FWHM and the identification of the species 222The line identifications were done with the help of the following online databases: the ”NIST Atomic Spectra Database” (http://www.physics.nist.gov/cgi-bin/AtData/main_asd), the ”Atomic Line List” (http://www.pa.uky.edu/~peter/atomic/) and the ”Atomic Molecular and Optical Database Systems” (http://amods.kaeri.re.kr/spect/SPECT.html).. It is worth to notice that isolated lines have radial velocities and widths that are comparable amongst themselves. Doublets, triplets and blended lines are easily identified by the discrepancies in the values of these measurements. Selected weak absorption lines are also shown in Table 4, where we present only species which have not been listed in Table 3.
| Wavelength (Å)a | RV (km s-1)b | (Å) | FWHM (km s-1) | Identification |
|---|---|---|---|---|
| 3853.76(.67) | 6.7 | 0.039 | 20.1 | Si ii |
| 3856.10(.02) | 6.7 | 0.069 | 22.0 | Si ii |
| 3862.69(.59) | 7.1 | 0.056 | 21.4 | Si ii |
| 4120.99(.81; .82; .99) | … | 0.028 | 30.9 | He i |
| 4128.15(.05) | 7.0 | 0.058 | 23.5 | Si ii |
| 4130.98(.87; .89) | … | 0.072 | 24.8 | Si ii |
| 4178.96(.86) | 7.1 | 0.021 | 24.3 | Fe ii |
| 4233.28(.17) | 7.8 | 0.033 | 21.7 | Fe ii |
| 4267.25 | . . . | 0.042 | 33.5 | C ii |
| 4351.85(.77) | 5.9 | 0.022 | 21.9 | Fe ii |
| 4384.73(.64) | 6.6 | 0.020 | 24.1 | Mg ii+Fe ii |
| 4481.32(.13; .15; .33) | … | 0.171 | 34.0 | Mg ii |
| 4508.37(.29) | 5.4 | 0.024 | 23.3 | Fe ii |
| 4522.72(.63) | 5.6 | 0.026 | 21.8 | Fe ii |
| 4549.55(.47) | 4.9 | 0.044 | 27.4 | Fe ii |
| 4555.99(.89) | 6.3 | 0.022 | 22.0 | Fe ii |
| 4583.93(.84) | 5.9 | 0.032 | 21.6 | Fe ii |
| 4713.32(.14; .16; .38) | . . . | 0.037 | 31.8 | He i |
| 4922.11(1.93) | 11.2 | 0.023 | 27.4 | He i |
| 4924.06(3.93) | 7.7 | 0.047 | 22.9 | Fe ii |
| 5015.80(.68) | 19.4 | 0.037 | 25.9 | He i |
| 5018.55(.44) | 6.6 | 0.046 | 21.8 | Fe ii |
| 5041.14(.02) | 7.0 | 0.058 | 23.5 | Si ii |
| 5047.86(.74) | 7.3 | 0.023 | 31.9 | He i |
| 5056.19(5.98) | 12.3 | 0.095 | 32.6 | Si ii |
| 5100.83(.66; .95) | … | 0.025 | 23.5 | Fe ii |
| 5169.15(.03) | 6.5 | 0.048 | 21.3 | Fe ii |
| 5197.68(.58) | 6.1 | 0.021 | 20.8 | Fe ii |
| 5227.58(.49) | 5.3 | 0.025 | 27.8 | Fe ii |
| 5234.71(.63) | 4.9 | 0.027 | 26.4 | Fe ii |
| 5264.45(.22; .36) | … | 0.029 | 47.3: | Mg ii+Fe ii |
| 5276.11(.00) | 6.2 | 0.024 | 21.8 | Fe ii |
| 5316.73(.62) | 6.7 | 0.048 | 29.3: | Fe ii |
| 5640.14(9.98; .24) | . . . | 0.029 | 54.8 | S ii |
| 5957.68(.56) | 6.2 | 0.042 | 23.4 | Si ii |
| 5979.06(8.93) | 6.7 | 0.042 | 21.5 | Si ii |
-
a
The values in parenthesis are the rest wavelengths.
-
b
Velocities in the heliocentric system.
Table 3. Absorption lines with 0,02 Å, from the FEROS spectra (continued).
| Wavelength (Å)a | RV (km s-1)b | (Å) | FWHM (km s-1) | Identification |
| 6156.93(.74; .76; .78) | … | 0.027 | 23.1 | O i |
| 6158.32(.15; .17; .19) | … | 0.026 | 22.2 | O i |
| 6347.19(.11; 6.97) | … | 0.119 | 28.4 | Si ii+ Mg ii |
| 6371.50(.37) | 6.3 | 0.081 | 23.2 | Si ii |
| 6402.40 | . . . | 0.023 | . . . | Ne i |
| 6456.46(.38; 5.84) | … | 0.031 | 30.1 | Fe ii |
| 6516.26(.08) | 8.3 | 0.024 | 11.0: | Fe ii |
| 7468.47(.31) | 6.2 | 0.020 | 22.8 | N i |
| 7772.11(1.99) | 4.6 | 0.115 | 23.3 | O i |
| 7774.33(.17) | 6.4 | 0.133 | 26.2 | O i |
| 7775.56(.39) | 6.7 | 0.120 | 27.0 | O i |
| 7947.51(.17; .55) | … | 0.034 | 25.1 | O i |
| 7950.87(.80) | 2.7 | 0.027 | 23.8 | O i |
| 8446.70(.25; .36; .76) | … | 0.163 | 28.4 | O i |
| 8680.46(.28) | 6.2 | 0.044 | 26.2 | N i |
| 8683.55(.40) | 5.1 | 0.037 | 24.3 | N i |
| 8686.31(.15) | 5.6 | 0.023 | 26.3 | N i |
| 8719.10(8.84) | 9.2 | 0.020 | 22.7 | N i |
| Other absorption features | ||||
| 3933.9(.66) | 18.1 | 0.265 | 28.6 | Ca ii |
| 3968.8(.47) | 25.1 | 0.128 | 23.5 | Ca ii |
| 4134.5(.11) | 0.4: | 0.032 | 140 | O v? |
| 4143.96:(.7) | 20.6: | 0.113: | 203: | O v? |
| 4603.91(.74) | 10.1 | 0.076 | 92 | N v |
| 4620.39(9.97) | 27 | 0.097 | 200 | N v |
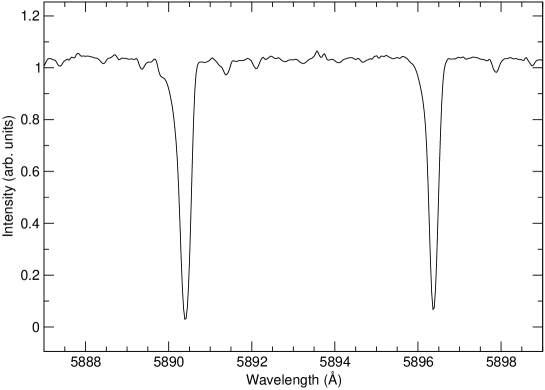
| 5890.40(9.95) | 23.0 | 0.348 | 15.5 | Na i IS |
| 5896.37(5.93) | 22.5 | 0.282 | 13.3 | Na i IS |
| 5780 | . . . | 0.100 | . . . | DIB |
-
a
The values in parenthesis are the rest wavelengths.
-
b
Velocities in the heliocentric system.
| Wavelength (Å)a | RV (km s-1)b | (Å) | Identification |
|---|---|---|---|
| 3919.02 | . . . | 0.0129 | C ii+Fe ii |
| 4267 | . . . | . . . | C ii |
| 4294.50(.40) | 6.9 | 0.0066 | S ii |
| 4588.27(.20) | 4.5 | 0.0087 | Cr ii |
| 4663.15(.05) | 6.4 | 0.0157 | Al ii |
| 4824.21 (.06) | 9.5 | 0.0060 | S ii |
| 4917.26(.20) | 3.8 | 0.0066 | S ii |
| 4925.46(.34) | 7.1 | 0.0066 | S ii |
| 4992.12(1.97) | 8.8 | 0.0089 | S ii |
| 5032.60(.43) | 9.7 | 0.0151 | S ii |
| 5183.69(.60) | 5.0 | 0.0077 | Mg i |
| 5428.78(.66) | 7.1 | 0.0069 | S ii |
| 5606.27(.15) | 6.4 | 0.0061 | S ii |
| 5852.65(.06) | 7.4 | 0.0057 | Si i |
| 5883.63(.51) | 6.3 | 0.0057 | Si i |
| 5886.96(.83) | 6.4 | 0.0057 | Fe i |
| 5899.73 | … | . . . | Si i; Ni ii - (?) |
| 5910.34(.49) | 7.8 | 0.0050 | C i |
| 5912.71(.58) | 6.3 | 0.0035 | C i |
| 5919.36(.20;.23) | . . . | 0.0110 | Fe i; S ii |
| 5940.81(.66) | 7.5 | 0.0078 | Cr ii |
| 5941.35 | 7.8;7.7 | 0.0076 | Be i; Cu ii - (?) |
| 5945.72(.51;.54) | … | 0.0087 | Ni ii |
| 5948.88 | . . . | 0.0074 | Si i; Al ii - (?) |
| 5954.67(.47) | 10.2 | 0.0059 | Cr ii |
| 5968.01(.91) | 4.8 | 0.0050 | P ii |
| 5971.07 | . . . | 0.0036 | Cu ii; C i; Cr i - (?) |
-
a
The values in parenthesis are the rest wavelengths.
-
b
Velocities in the heliocentric system.
The emission spectrum is also quite rich, presenting lines of H, He i/ii, C iii/iv, N iii/iv/v, O iii and Si iv. In addition, it shows lines that possibly can be identified with O ii and Si iii, as well as some unidentified lines. The H lines are blended with lines of He ii, and this affects the measurement of their widths and also their intensities. In Table 5 we show a list as complete as possible of all of the emission lines. Besides the measured and rest wavelengths, we supplied the radial velocity in the heliocentric system, the equivalent width, FWHM and the identification of the species.
| Wavelengtha | RV b | FWHM | Identification | |
| (Å) | (km s-1) | (Å) | (km s-1) | |
| 3702.8:(2.75) | 4.1: | . . . | . . . | O iii |
| 3707.33(7.27) | 4.8 | 0.29 | 104 | O iii |
| 3715.14(5.09) | 4.0 | 1.0 | 120 | O iii |
| 3725.47:(5.94) | . . . | 0.3 | . . . | O iv |
| 3728.85:(9.03) | . . . | 0.6 | . . . | O iv |
| 3754.82(4.70) | 9.6 | 1: | 128 | O iii |
| 3757.3(7.23) | 6.0 | 1: | 169 | O iii |
| 3759.96(9.87) | 7.2 | 1: | 114 | O iii |
| 3762.3: | . . . | . . . | . . . | O iv+Si iv? |
| 3774.11 | . . . | . . . | . . . | O iv+O iii? |
| 3784.3 | . . . | . . . | . . . | O ii? |
| 3791.2(1.27) | -5.5 | . . . | . . . | O iii |
| 3835.1:(5.38) | . . . | . . . | . . . | H? |
| 3888.80:(8.60) | . . . | 0.6 | . . . | He i |
| 3923.47:(3.48) | . . . | 0.2 | 175 | He ii |
| 3961.64(1.57) | 5.3 | 0.3 | 106 | O iii |
| 3970.0(9.19) | . . . | 0.8: | 188 | H+He ii |
| 4003.6(3.6) | . . . | 0.06 | . . . | N iii |
| 4025.6(5.60) | . . . | 0.1: | . . . | He ii |
| 4057.85(7.76) | 6.6 | 1.1 | 103 | N iv |
| 4069:(8.91) | . . . | . . . | . . . | C iii |
| 4070.3(0.31) | . . . | . . . | . . . | C iii |
| 4081.0(1.02) | -1.5 | 0.15 | 138 | O iii |
| 4088.96(8.86) | 7.3 | 0.43 | 81 | Si iv |
| 4097.41(7.36) | 3.7 | 0.9 | 88 | N iii |
| 4101.8(1.76) | . . . | 0.93 | 135 | H+He ii |
| 4103.5(3.39) | 8.0 | 0.84 | 82 | N iii |
| 4116.2(61) | 7.1 | 0.2 | 102 | Si iv |
| 4187.0(6.9) | 7.2 | 0.1 | 86 | C iii |
| 4195.82(5.74) | 5.7 | . . . | . . . | N iii |
| 4199.97(9.83) | 10 | 0.7 | 142 | He ii |
| 4340.23(0.49) | . . . | . . . | . . . | H+He ii |
| 4379.22(9.11) | 7.5 | 0.6 | 97 | N iii |
-
a
The values in parenthesis are the rest wavelengths.
-
b
Velocities in the heliocentric system.
Table 5. Emission lines from the FEROS spectra (continued).
| Wavelengtha | RV b | FWHM | Identification | |
|---|---|---|---|---|
| (Å) | (km s-1) | (Å) | (km s-1) | |
| 4448.14:(8.19) | . . . | 0.05 | 88 | O ii? |
| 4510.99(0.88) | 7.3 | 0.3 | 100 | N iii |
| 4514.96(4.85) | 7.3 | 0.2 | 73: | N iii |
| 4518.25(8.14) | 7.3 | 0.1: | . . . | N iii |
| 4523.71(3.56) | 9.9 | 0.1 | 79 | N iii |
| 4534.7(4.58) | 7.9 | . . . | . . . | N iii |
| 4541.63(1.59) | 2.6 | 1.65 | 171 | He ii |
| 4569.3 (9.26) | 2.6 | 0.06 | 170 | O iv |
| 4606.51(6.33) | 11.7 | 0.07 | 85 | N iv |
| 4610.6(0.55) | 3.2 | . . . | . . . | N iii |
| 4634.23(4.13) | 6.5 | 0.75 | 101 | N iii |
| 4640.73(0.64) | 5.8 | 1.37 | 100 | N iii |
| 4647.51(7.42) | 5.8 | 2.38 | 93 | C iii |
| 4650.3(0.25) | 3.2 | 1.46 | 92 | C iii |
| 4651.56(1.47) | 5.8 | . . . | . . . | C iii |
| 4658.36(8.30) | 3.9 | 0.42: | 71: | C iv |
| 4665.8(5.86) | . . . | . . . | . . . | C iii |
| 4685.83(5.71) | 7.7 | 15.6 | 390 | He ii |
| 4707.36(7.31) | 3.2 | 0.06 | 108 | N iv |
| 4860.59 | . . . | 5.3 | 283 | H+He ii |
| 4867.18(7.17) | 0.6 | 0.20 | 90 | N iii |
| 4907.2 | . . . | 0.04 | 73 | O ii |
| 4944.72(4.56) | 9.9 | 0.1 | 109 | N v |
| 5058.6(8.73) | . . . | 0.03: | . . . | N iii |
| 5115.8:(5.41) | 22.9: | . . . | . . . | N iv |
| 5131.17 | . . . | 0.1 | 128 | . . . |
| 5147.8(7.88) | . . . | 0.08 | . . . | N iii |
| 5200.5(0.41) | 5.2 | 0.03: | . . . | N iv |
| 5204.4(4.28) | . . . | 0.06: | . . . | N iv |
| 5268.46(8.30) | 9.1 | 0.1 | 119 | O iii |
| 5305.0(4.97) | . . . | 0.07 | . . . | Si iv |
| 5411.49(1.52) | . . . | 4.64 | 216 | He ii |
| 5470.3: | . . . | 0.04 | . . . | C iv |
| 5488.54(8.27) | . . . | 0.04 | 71 | S iv |
| 5497.94(7.78) | 8.7 | 0.23 | 98 | S iv |
-
a
The values in parenthesis are the rest wavelengths.
-
b
Velocities in the heliocentric system.
Table 5. Emission lines from the FEROS spectra (continued).
| Wavelengtha | RV b | FWHM | Identification | |
| (Å) | (km s-1) | (Å) | (km s-1) | |
| 5592.40(2.25) | 8.0 | 0.75 | 96 | O iii |
| 5696.0:(5.92) | . . . | 0.09: | . . . | C iii |
| 5737.0:(6.93) | . . . | 0.01: | . . . | N iv |
| 5801.43(1.31) | 6.2 | 16.7 | 170 | C iv |
| 5812.04(1.97) | 3.6 | 9.96 | 142 | C iv |
| 5875.7(5.6) | . . . | 1.15 | 189 | He i |
| 6004.6:(4.73) | . . . | 0.1: | . . . | He ii |
| 6037.0(6.71) | . . . | 0.09: | . . . | He ii |
| 6074.2 (4.1) | . . . | 0.3: | He ii | |
| 6118.3(8.2) | . . . | 0.2 | 230 | He ii |
| 6170.8(0.6) | . . . | 0.3 | 251 | He ii |
| 6215.5:(5.45) | . . . | . . . | . . . | N iv |
| 6220.0:(9.89) | . . . | 0.05 | . . . | N iv |
| 6233.8 (3.8) | . . . | 0.3 | . . . | He ii |
| 6310.9(0.8) | . . . | . . . | . . . | He ii |
| 6380.9(0.75) | 7.0 | . . . | . . . | N iv |
| 6406.4:(6.3) | . . . | 0.6: | . . . | He ii |
| 6527.1(7.11) | . . . | 0.7: | 179 | He ii |
| 6562.0 | . . . | 14.4 | . . . | H+He ii |
| 6678.3(8.15) | . . . | 1.1 | 130 | He i |
| 6683.2(3.2) | . . . | 1.0 | 179 | He ii |
| 6701.0: | . . . | 0.04: | . . . | Si iv |
| 6731.1:(0.04) | . . . | 0.04 | . . . | C iii |
| 6744.5(0.39) | 4.9 | 0.2 | 182 | C iii |
| 6890.9:(0.88) | . . . | . . . | . . . | He ii |
| 7032.4:(0.34) | . . . | 0.1 | . . . | O iv |
| 7064.8:(5.2) | . . . | . . . | . . . | He i |
| 7103.45(0.24) | 8.9 | 0.8 | 97 | N iv |
| 7109.51(0.35) | 6.7 | 1.7 | 97 | N iv |
| 7111.6(0.28) | 13 | 0.5 | 72 | N iv |
| 7123.1(2.98) | 5.0 | 3.1 | 92 | N iv |
| 7127.1(0.25) | -6.3 | 1.1 | 151 | N iv |
| 7177.7(7.50) | . . . | . . . | . . . | He ii |
| 7455.3 | . . . | 0.05 | . . . | O iii |
| 7487.0 | . . . | 0.09 | . . . | C iii? |
-
a
The values in parenthesis are the rest wavelengths.
-
b
Velocities in the heliocentric system.
Table 5. Emission lines from the FEROS spectra (continued).
| Wavelengtha | RV b | FWHM | Identification | |
|---|---|---|---|---|
| (Å) | (km s-1) | (Å) | (km s-1) | |
| 7592(2.74) | . . . | . . . | . . . | He ii |
| 7726.2 | . . . | 1.3 | 112 | C iv |
| 7736.1: | . . . | 0.1 | . . . | C iv |
| 7839.8: | . . . | . . . | . . . | . . . |
| 7873.7:(3.3) | . . . | . . . | . . . | C iii |
| 8019.7 (9.09) | . . . | 0.5 | . . . | N iii |
| 8196.7:(6.48) | . . . | . . . | . . . | C iii |
| 8237.0:(6.77) | . . . | . . . | . . . | He ii |
| 8495.0: | . . . | . . . | . . . | N iii |
| 8500.5(0.32) | . . . | . . . | . . . | C iii |
| 8664.4 | . . . | . . . | . . . | C iii |
-
a
The values in parenthesis are the rest wavelengths.
-
b
Velocities in the heliocentric system.
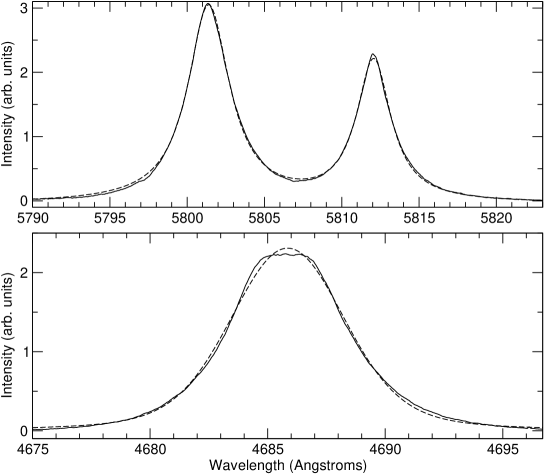
An important aspect of the emission line spectrum is the diversity of the widths and line profiles. The FWHM varies from 70 km s-1 for the weakest lines up to 370 km s-1 for the most intense ones. The H and He lines are systematically broader than the CNO lines and have a profile that can be described approximately by a profile of Voigt/Gauss, while the CNO lines are quite well adjusted by a Lorentz profile (see Fig. 2).
The emission line spectra observed in 1998, 1999, 2002 and 2004 are qualitatively quite similar. However, the equivalent width of the He ii 4686 Å line decreased from Å in 1998 and Å in 1999 to Å in 2002, and increased again to Å in 2004. Still, the FWHM remained constant along these observations, conserving the value of 380 10 km s-1.
4 The spectral classification of the secondary star
The absorption spectrum of the secondary star was detected for the first time by Hiltner (hilt1 (1956)) who described the spectrum of HD 45166 as of ”high excitation superposed on a O9 type star”. Heap & Aller (heap (1978)) classified the secondary as B8 V and this classification has been adopted in the literature until today. With the high resolution and the high signal-to-noise ratio that characterize our data, it seems to be adequate to return to the subject and to verify which, in fact, is the best classification for the star. Many of the conclusions, such as the values of the masses, depend critically on this parameter.
In order to re-evaluate the spectral class of the secondary component of the binary system, we compared the ratio of the observed Mg i 5183.6 Å/Mg ii 4481.3 Å equivalent widths (Wλ(Mg i)/Wλ(Mg ii) = ) to the ones given by the Kurucz (kurucz (1994)) models as provided by the VALD (Vienna Atomic Line Database) service (Kupka et al. kupka (1999)). We also compared this measured ratio to the ones found at the high resolution and high S/N ratio spectra of several B type stars from the UVES Paranal Observatory Project (Bagnulo et al. bagnu (2003)). From both comparisons we derived a B71 V spectral type. This classification is similar, within the errors, to that (B8 V) obtained by Heap & Aller (heap (1978)). According to Cox (cox (1999)), the properties of a B7V star are TK, M = 4.8 M☉, R = 3.4 R☉ and .
5 The orbital period
Heap & Aller heap (1978) determined that HD 45166 is a binary system composed of a ”quasi Wolf-Rayet” star and a B8 V star. With the observations described in the previous section, we may now verify whether this star has or not a detectable orbital period. If our data present radial velocity variations on both the emission and absorption features than we may be dealing with a double spectroscopic binary. However, previous observations discovered no radial velocity variability in excess of 10 km s-1 (WHSH89). Therefore it is very important that any measurement shall be made with maximum accuracy.
Photospheric absorption lines of a star are excellent tracers of its movement and potential indicators of an orbital period. To reach the necessary accuracy, we measured the radial velocities of the O i 7772/4/5 and 8446 Å absorption lines from the FEROS spectra and calculated their weighted average, taking as weight the equivalent widths, respectively W Å (7772 Å), W Å (7774 Å), W Å (7775 Å) and W Å (8446 Å). To proceed, we corrected the O i average radial velocities for possible uncertainties in the wavelength calibration. This correction was based on the averaged residuals of the nearby 7670.26 Å and 7671.31 Å telluric lines observed wavelengths, as compared to their rest wavelengths. The use of telluric absorption lines as stationary comparison source was analyzed by Griffin & Griffin griff (1973). In our case, to estimate the uncertainties resulting from this correction, one should note that the radial velocities of these two telluric lines differ one from the other by 0.2 km s-1 for a same exposure and by 0.5 km s-1 for different observations from the same night. Therefore, the uncertainty in the measurements of the O i lines position relative to the nearby telluric features may also be 0.2 km s-1, in spite of the observed spectral line resolution in this region being 6.2 km s-1. The relative dispersion of the radial velocities of O I in Fig. 4 (top diagram) suggests that this is quite reasonable. One could expect that measurements of absorption lines other than those O i would have uncertainties of 0.5 km s-1, because of the absence of such correction by close telluric features.
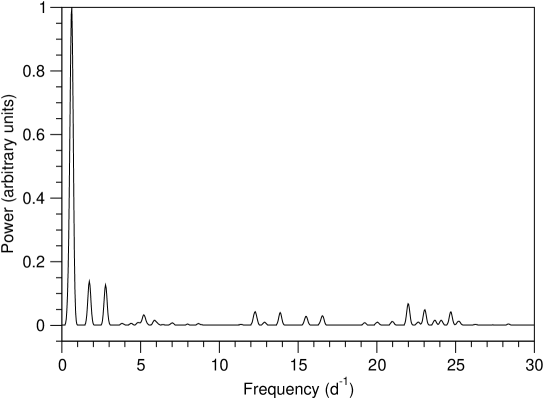
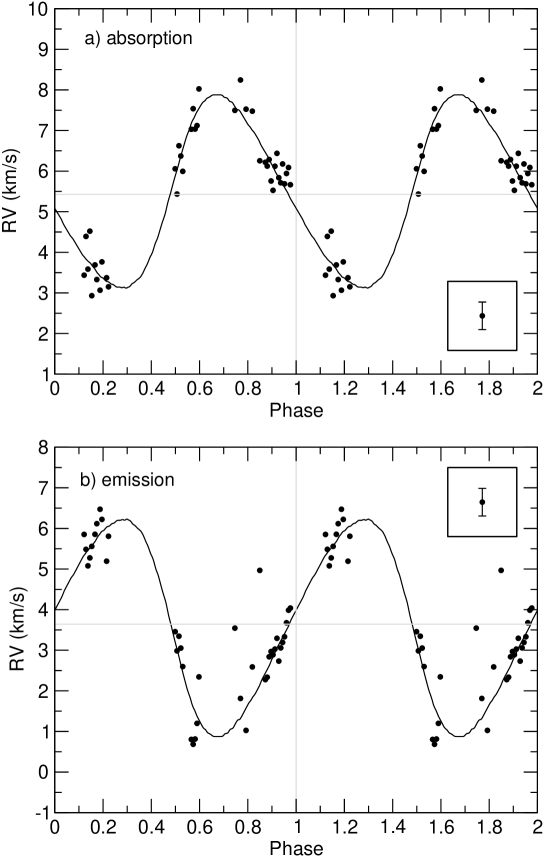
The CLEAN (Roberts et al. roberts (1987)) and PDM (Phase Dispersion Minimization, Stellingwerf stellin (1978)) routines for period search applied to the O i average radial velocities indicate a period of P = 1.596 0.003 days (Fig. 3). The associated radial velocity curve (Fig. 4, top) displays an amplitude of K 0.2 km s-1 and an eccentricity of e = 0.18 0.08. These parameters were obtained fitting the data with the Russell-Wilsing (Binnendijk binn (1960)) method.
The mass function is
| (1) |
where K2 is measured in km s-1 and P in days. With the values derived above we obtain a mass function of M☉.
6 The 5 and 15 hours periods
Since the emission spectrum (associated to the primary component of the binary system) is quite rich, we measured radial displacements of these lines to verify if the orbital period determined above is also seen in this component. In a first attempt (Oliveira & Steiner oliv (2002)) analyzing only the emission lines from the data obtained at LNA in 1999, we found a candidate period of 0.357 days.
To measure the radial velocities of the emission lines from the FEROS spectra we used the C iv 5801/11 Å lines, because these features are narrower than the H and He lines and they are very well fitted by Lorentzian profiles (Fig. 2, top diagram). Besides, they are located only 100 Å away from the Na i 5890/96 Å interstellar absorption lines (Fig. 5), which can be used as fiducial marks to correct for radial velocity inaccuracies. This is the same procedure we applied to the O i absorption lines above, when the fiducial references were telluric features. Therefore, the C iv radial velocity measurements were performed by simultaneously fitting Lorentz profiles and obtaining the simple average of both radial velocities. Then we subtracted, from this average, the residuals of the radial velocities of the Na i interstellar lines relative to their median value.
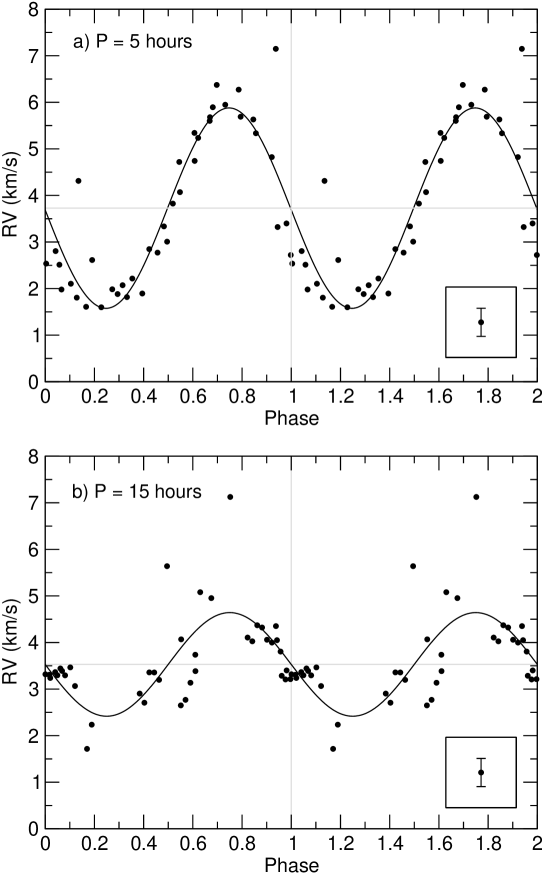
The resultant radial velocity curve shows a period of 0.205 days (5 hours) (Fig. 6, top). The fact that two spectroscopic periods exist is a complicating factor because, with the small amplitudes involved, it is very difficult to determine them. Another factor that complicates the determination of the periods is that their values coincide with unit fractions of a day. We have confused (Oliveira & Steiner oliv (2002)) the period of 0.205 days ( of a day) with 0.357 days ( of a day). In the periodogram obtained from the LNA data, the most visible period is, in fact, of a day. One should mention that the orbital period is of a day.
At this time we should wonder which, after all, is the orbital period as we have now identified two periods. We believe that the 1.596 days period is orbital for two strong reasons. First, it was derived using the photospheric absorption lines from the secondary star. Second, the 5 hours period is so short that, if it were orbital, the secondary star would not fit in its Roche lobe.
If the 1.596 0.003 days period is the orbital one, we should find this period also in the primary star, that is, we should search for this period in the emission lines. To do this, we subtracted the average radial velocity curve, folded with the 5 hours period, from the raw data of C iv radial velocity. The result is plotted as a function of the 1.596 days period (Fig. 4, bottom) and shows a curve symmetric to the absorption radial velocity curve with the same period, but with an amplitude slightly larger, that is, K 0.2 km s-1. The radial velocity curve derived from the C iv emission lines is in anti-phase with the O i absorption lines curve. This should be expected if the emission and absorption lines are produced on distinct stellar components of the binary system and if the sample period is the orbital one. To investigate whether the C iv radial velocity variations could be attributed to superposed photospheric absorption features from the secondary component, we searched for C iv 5801/11 Å absorption lines in high resolution spectra of B stars. Our FEROS spectra of HD 103401 (B5 V), HD 104432 and HD 102465 (both B9 V), taken with the same instrumental configuration as the spectra of HD 45166, do not show any features above the noise that could be associated to C iv 5801/11 Å lines. This fact, together with the anti-phase behavior of the radial velocity curves, lead to the interpretation of the C iv radial velocity variations as produced by the orbital motion of the primary star.
The mass function of the secondary component is
| (2) |
After we subtract the 1.596 days and the 5 hours modulations, we applied the PDM routine on the residuals and we identified an additional period of 0.64 days (15 hours, Fig. 6, bottom). Using these techniques, no other candidate period appeared with amplitude greater than 0.5 km s-1. In Paper II we will return to the non-orbital periods and their interpretation.
7 Masses and inclination
The orbital period was detected in both stars (associated to the absorption and also emission lines), so this system is a double spectroscopic binary. With the radial velocity amplitudes from both stars, we obtain
| (3) |
As a main sequence B7 V star, the mass of the secondary is M M☉; therefore M1 = 4.2 0.7 M☉. The mass of the primary star was estimated by WS83. They assume that the primary star obeys the wind relations of typical OB stars. From an approximate wind model and observed P-Cygni profile parameters from IUE, they estimate a mass of 0.5 M☉. In that case the mass was not inferred from dynamical parameters such as radial velocity curves.
The inclination angle of the system, obtained from the mass function, is i = 0.77 0.09. This is probably one of the smallest orbital inclination angles known for a binary system.
The major semi-axes of the orbits, (a1,a2), are defined as
| (4) |
and, in the case of HD~45166, are a 0.6 R☉ and a 0.5 R☉.
Would it be the case to ask whether the secondary star fills its Roche lobe? As the eccentricity of the orbit is non zero, the Roche lobes increase and decrease as a function of the orbital phase. At periastron, the Roche lobes have minimum dimensions and, at that phase, the effective radius of the secondary’s lobe is given by (Hilditch hildi (2001))
| (5) |
For the values determined for HD~45166, we have = 3.7 0.8 . Considering the uncertainties, this value is very close to the secondary’s radius (see Sect. 4) and, therefore, at periastron the secondary star may fill its Roche lobe.
The maximum radius for the secondary’s Roche lobe is (Hilditch hildi (2001))
| (6) |
that is, 5.4 1.1 R☉. In Table 6 we list the basic parameters for the system.
8 Discussion
8.1 Gravitational redshift
The General Theory of Relativity predicts the existence of gravitational redshift given by (for , where is the redshift, is velocity and is the velocity of light)
| (7) |
At the surface of the secondary star this corresponds to = +0.9 km s-1 and for the primary star, = +2.0 km s-1 (where we considered , see Paper II). As these values are larger than the precision of our measurements, they need to be taken into account in the data analysis. If the average velocity of the secondary absorption spectrum is +6.2 0.3 km s-1, then the expected average photospheric velocity in our spectra of the primary star should be of +7.3 km s-1. The average heliocentric velocity of the secondary star, corrected for the gravitational redshift, is = +5.3 0.3 km s-1. This velocity is not the radial velocity of the center of mass, because this depends on the sampling of the observation phases. The value of , that is, of the radial velocity of the mass center, is determined from the radial velocity curve and corresponds to the value that divides the curve in two segments of same underlying areas. Its value, obtained from the secondary star’s absorption lines radial velocities and corrected for the gravitational redshift, is = 4.5 0.2 km s-1 (Table 6).
| Parameters of the system | ||
|---|---|---|
| = 1.596 0.003 days | ||
| (HJD)= 2 452 097.03 0.17 | ||
| (abs) = 2.4 0.2 km s-1 | (emiss) = 2.7 0.2 km s-1 | |
| (HC) = +4.5 0.2 km s-1 | = + 283 28 | |
| kpc | = 0.155 0.007 | |
| Parameters of the primary star | ||
| = 0.205 days | = 4.2 0.7 | |
| (0.205 d) = 2.3 0.3 km s-1 | ||
| (HJD) = 2 452 299.62 0.01 | = 6.3 0.6 | |
| = 0.64 days | ||
| (0.64 d) = 1.1 0.4 km s-1 | ||
| (HJD) = 2 452 097.40 0.06 | ||
| Parameters of the secondary star | ||
| = 4.8 0.5 | = 5.5 0.5 | |
| = 3.4 | log g = 4.05 | |
| = 13 500 K | Spectral type = B71 V | |
| (min) = 3.7 0.8 | (max) = 5.4 | |
8.2 The distance to the system
Heap & Aller (heap (1978)), as well as WS83 determined the distance to the system based on the secondary star spectroscopic parallax. The first authors found a distance of 1.26 kpc. They also determined that the neighboring star HD~44498 has a reddening of . WS83 determined a distance of 1.208 kpc. The color excess measured by them is and it is quite reliable, given that it is based on the interstellar extinction band at 2200 Å.
In order to obtain an independent estimate of the interstellar extinction, we measured the equivalent width of the diffuse interstellar band (DIB) at 5780 Å and found Wλ(5780 Å) mÅ. Using the relation of the DIB equivalent width versus color excess (Somerville some (1988))
| (8) |
where Wλ is given in mÅ, we obtain, . The estimated error does not take into account the uncertainty of Somerville’s calibration. The two methods of estimating the color excess agree quite well. One should notice, however, that the DIB at 5780 Å may be contaminated by the N iv 5776.3 Å emission line.
We measured the equivalent width of Mg ii 4481 Å from the FEROS spectra of two comparison stars and obtained for HD~103401 (B5 V), Wλ(4481 Å) = 0.263 0.005 Å and for HD~102465 (B9 V), Wλ(4481 Å) = 0.377 0.004 Å. Interpolating the spectral type one would expect, for the B71 V secondary component of HD~45166, Wλ(4481 Å) = 0.320 0.005 Å. We found 0.177 0.005 Å, instead, due to the dilution from the companion’s continuum. This means that the secondary star contributes 55% 2% in the filter, and the distance to HD~45166 is, therefore, d = 1.3 0.2 kpc.
The radial velocity of the interstellar Na i lines determined by us (see Table 3) is 22.8 km s-1 in the heliocentric system. After correcting this value to the Local Standard of Rest (LSR) we obtain a radial velocity of V km s-1. From the galactic rotation curve we obtain, for the coordinates of HD~45166 (l = 203.1 / b = -2.3), the expected radial velocity of 10.8 (d/kpc) km s-1. The radial velocity of the average stellar spectrum, corrected for the gravitational redshift, is V km s-1. We conclude, therefore, that the star has an anomalous velocity of approximately km s-1 with respect to LSR.
8.3 DACs and the photospheric connection
The coincidence between the orbital period ( days) and the recurrence time of days (WHSH89) for the Discrete Absorption Components (DACs) is striking. Why should exist an association between the recurrent appearance of slowly accelerating clouds and the orbital period? Somehow the clouds responsible for the periodic absorption seem to be ejected at every orbit. What could be the periodic event, responsible for this ejection? At a first glance one could imagine that the non-zero eccentricity may play a key role in this game. At every orbit there is a periastron event in which the secondary fills its Roche lobe and is capable of transferring matter to the primary. This periodic accretion may be physically related to the DACs but how, exactly, is not clear at this point. We will revisit this issue in Paper II.
9 Conclusions
In what follows we present the main conclusions of this paper:
-
1.
The optical spectrum of HD~45166 presents a great wealth of information both in the emission as well as in the absorption spectrum. The emission spectrum has lines of H, He i/ii, C iii/iv, N iii/iv/v, O ii/iii/iv, Si iii/iv. The spectrum in absorption has lines of H, He i, C ii, N i, O i, Si ii, Mg ii and Fe ii. Weak lines of C i, Mg i, Si i, P ii, S ii, Cr ii and Fe i are also seen.
-
2.
We classified the spectral type of the secondary star as B7 V and, therefore, it should have a mass of M2 = 4.8 M☉ and a radius of R2 = 3.4 R☉.
-
3.
The emission lines have great diversity of widths and profiles. The most intense lines have FWHM of 370 km s-1 and the weakest lines of 70 km s-1. Lines of H and He have Voigt/Gauss profiles and are systematically broader than the lines of CNO, that have Lorentz profiles.
-
4.
HD~45166 is shown to be a double spectroscopic binary with orbital period of 1.596 0.003 days and eccentricity of e = 0.18 0.08.
-
5.
Standard techniques for period search applied to the emission lines show two additional periods, of 5 and 15 hours.
-
6.
The amplitude of the radial velocities of the orbital period are K1 = 2.7 0.2 km s-1 and K2 = 2.4 0.2 km s-1. We derived M1 = 4.2 0.7 M☉ and i = 0.77 0.09.
-
7.
The secondary star’s radius may be about the size of its Roche lobe at periastron. Therefore we can consider that, at periastron, it fills or it is very close to fill its Roche lobe.
-
8.
The expected gravitational redshift is 0.9 km s-1 for the secondary star and 2.0 km s-1 for the primary. These values are larger than the precision of our measurements and they need to be taken into account in the analysis of the data.
-
9.
We estimated a color excess of and the distance to HD~45166 as 1.3 0.2 kpc.
-
10.
We suggest that the discrete absorption components (DACs) observed in the ultraviolet with a periodicity similar to the orbital period may be induced by the periastron events.
Acknowledgements.
We would like to thank Dr. Albert Bruch for his careful reading of the manuscript and the anonymous referee for the constructive comments. We are specially grateful to Dr. Luiz Paulo Vaz for kindly fitting the measurements of the radial velocity with his program of orbit adjustment with non-zero eccentricity.References
- (1) Anger, C. 1933, Bull. Harvard Coll. Obs., 891
- (2) Bagnulo, S., Jehin, E., Ledoux, C., et al. 2003, Messenger, 114, 10
- (3) Binnendijk, L. 1960, in Properties of Double Stars, 163
- (4) Brown, J. C., Barrett, R. K., Oskinova, L. M., et al. 2004, A&A, 413, 959
- (5) Cieslinski, D., Diaz, M. P., & Steiner J. E. 1999, AJ, 117, 534
- (6) Cox, A.N. 1999, in Allen’s Astrophysical Quantities, Ed. Cox, Los Alamos, NM Fourth Edition, AIP Press
- (7) Diaz, M.P. 1999, PASP 111, 76
- (8) Diaz, M.P. & Steiner, J.E. 1995, AJ 110, 1816
- (9) Griffin, R. & Griffin, R. 1973, MNRAS 162, 243
- (10) Hilditch, R. W. 2001, in An Introduction to Close Binary Stars, Cambridge, Cambridge University Press
- (11) Heap, S.R., Aller, L.H. 1978, unpublished
- (12) Herbig, G.H., Preston, G.W., Smak, J., & Paczynski, B. 1965, ApJ 141, 617
- (13) Hiltner, W.A. 1956, ApJS 2, 389
- (14) Hiltner, W.A., Schild, R.E. 1968, ApJ 143, 770
- (15) Kahabka, P., & van den Heuvel, E.P.J. 1997, ARA&A 35, 69
- (16) Kaufer, A., Stahl, O., Tubbesing, S., et al. 1999, Messenger, 95, 8
- (17) Kupka, F., Piskunov, N.E., Ryabchikova, T.A., Stempels, H.C., Weiss, W.W. 1999, A&AS, 138, 119
- (18) Kurucz, R.L. 1994, SAO, Cambridge, CDROM 20-22
- (19) Menzies, J.W., Marang, F., Westerhuys, J.E. 1990, SAAOC 14, 33
- (20) Morgan, A.D., Code, A.D., Whitford A.E. 1955, ApJS 2, 41
- (21) Neubauer, F.J., Aller, L.H. 1948, ApJ, 107, 281
- (22) Oliveira, A.S. & Steiner, J.E. 2002, in ASP Conf. Series 261, the Physics of Cataclysmic Variables and Related Objects, ed. B.T. Gansicke, K. Beuermann & K. Reinsch (ASP), 649
- (23) Oliveira, A.S. & Steiner, J.E. 2004, MNRAS, 351, 685
- (24) Oliveira, A.S., Steiner, J.E. & Diaz, M.P. 2004, PASP, 116, 311
- (25) Roberts, D.H., Lehar, J., & Dreher, J.W. 1987, AJ, 93, 968
- (26) Ross, L.W. 1961, PASP 73, 354
- (27) Somerville, W.B. 1988, MNRAS 234, 655
- (28) Stahl, O., Kaufer, A. & Tubbesing, S. 1999, in ASP Conf. Series 188, Optical and Infrared Spectroscopy of Circumstellar Matter, ed. E. W. Guenther, B. Stecklum & S. Klose (ASP), 331
- (29) Steiner, J. E. & Diaz, M.P. 1998, PASP 110, 276
- (30) Steiner, J. E., Cieslinski, D., Jablonski, F.J. & Williams, R.E. 1999, A&A 351, 1021
- (31) Stellingwerf, R.F. 1978, ApJ 224, 953
- (32) Ulla, A., & Tejll, P. 1998, A&AS, 132, 1
- (33) Van Blerkom, D. 1978, ApJ 225, 175
- (34) Van der Hucht, K. A. 2001, New Astr. Rev. 45, 135
- (35) Van der Hucht, K.A., Conti, P.S., Lundstrom, I., Stenholm, B. 1981, Space Sci. Rev. 28, 227
- (36) Veen, P.M., van Genderen, A.M. & van der Hucht, K.A. 2002, A&A 385, 619
- (37) Willis, A.J. & Stickland, D.J. 1983, MNRAS 203, 619 – WS83
- (38) Willis, A.J., Howarth, I.D., Stickland, D.J., Heap, S.R. 1989, ApJ 347, 413 – WHSH89