Discovery of new quasi-periodic oscillations in the X-ray transient source V 0332+53
Abstract
We report the discovery of a new quasi-period oscillation (QPO) at 0.22 Hz, centered on the source spin frequency of the high mass X-ray binary system V 0332+53 when the source was observed during its November 2004/March 2005 outburst by RXTE. Besides this new QPO, we also detected the known 0.05 Hz QPO. Both the 0.22 and 0.05 Hz QPOs stand out clearly at a mid-flux level of the outburst within January 15–19 2005, and later at an even lower flux level as the width of 0.22 Hz QPO drops. No evolution of the centroid frequency with the flux is seen in either QPO. The rms value below 10 keV is around 4–6% for both QPOs and decreases at higher energies. We discuss our results in the context of current QPO models.
1 INTRODUCTION
The high mass X-ray binary (HMXB) transient V 0332+53 (X 0331+53) was discovered during a bright outburst phase in July 1973 with the Vela 5B observatory (Terrell & Priedhorsky, 1984). After the discovery, the source was extensively studied in three new outbursts: in 1983 by Tanaka et al. (1983) with EXOSAT, in 1989 by Makishima et al. (1990a) with Ginga and the last one in 2004/2005 by Zhang et al. (2005) and Kreykenbohm et al. (2005) with RXTE and INTEGRAL. No outburst was detected by BATSE on board CGRO during its era between 1991 and 2000 nor by RXTE until November 2004 when the source outburst was caught by the all sky monitor (ASM).
The recurrent HMXB transient system consists of an accreting neutron star (NS) and an early-type O8–9 Ve optical counterpart BQ Cam located at a distance of 7 kpc (Bernacca et al., 1984; Honeycutt & Schlegel, 1985; Negueruela et al., 1999). The pulse period was first measured at 4.375 s with a 34 day orbit period, and a moderately eccentric orbit (Stella et al., 1985). The morphology of the pulse profile changes as a function of energy. It shows a prominent and broad single-peak at lower-energy and a secondary peak which becomes more evident above 6 keV (Unger et al., 1992; Kreykenbohm et al., 2005). However, Stella et al. (1985) and Zhang et al. (2005) found that the pulse profile is also dependent on the source luminosity – evolving from a double pulse when the source is bright to a single pulse when the source flux is lower. The period was found to decrease during outburst, with a recently measured value of s s-1 (Zhang et al., 2005). Possible evidence of an accretion disk was found with the detection of a 0.05 Hz QPO (Takeshima et al., 1994).
Observations (Makishima et al., 1990b; Coburn et al., 2005; Soldi et al., 2005; Kreykenbohm et al., 2005) show that the spectrum is best fitted by an absorbed power-law with an exponential cut-off and the additional components of cyclotron absorption lines, located at 25 keV, 50 keV, and 70 keV. The magnetic field at the NS surface is estimated to be around 2.7 Gauss.
In this letter we report the discovery of a new QPO based on the RXTE observations of V 0332+53 during the 2004/2005 outburst.
2 OBSERVATIONS and DATA
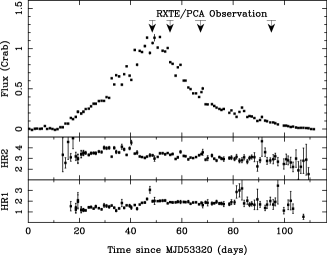
After the initial follow-up observation by RXTE starting November 27, 2004, Target of Opportunity (ToO) observations were performed between December 28, 2004 and February 15, 2005, the data from which were made public. The RXTE observations caught the source V 0332+53 at the outburst maximum on December 28–30, 2004 and during the outburst decay phase on January 4–6, 15–19, and February 12–15, 2005. In Fig.1 we show the four time intervals in which the RXTE observation was performed. Hereafter we call the four datasets I, II, III and IV, respectively. For our timing analysis, we used these datasets from the Proportional Counter Array (PCA; 2–60 keV) (Jahoda et al., 1996). The PCA data were collected in the binned and event mode, where the default selection criteria were applied. We used only the PCU2 which was on during the whole observation; the net PCU2 exposure time was 155 ks. The data reduction was performed using the standard software package FTOOLS version 5.3.1, and the background contribution was subtracted using the pcabackest version 4.0.

3 RESULTS
3.1 ASM AND PCA LIGHT CURVE
In Fig.1 we show the one day averaged ASM light curve of the entire outburst in the 1.5–12 keV energy band. We converted the ASM count rate to flux using 1 Crab 75.5 cts/s (Remillard, 2004). The true flux is certain to be substantially higher since the source is extremely hard, even for X-ray pulsars. The outburst started on November 23, 2004 (MJD 53332) and reached the maximum flux level of 1.2 Crab on December 29, 2004 (MJD 53368.60.4). The flux then decayed with an exponential time-scale, , to quiescence. The first evidence of a new X-ray outburst of this source could be traced back to January 2004 through observed optical brightening (Goranskij & Barsukova, 2005). To analyze the V 0332+53 spectral variability as function of the outburst time, we defined two colors. The soft color is the ratio of the 3.0–5.0 keV band to the 1.5–3.0 keV band and hard color is the ratio of the 5.0–12.0 keV band to the 3.0–5.0 keV band. Colors are built from the one day averaged ASM light curve. From the color ratios it is evident that the source underwent a spectral change during the outburst. We find that the hardness in the soft color increases to a maximum at the outburst peak, and that the transition in hardness occurs at an earlier time for the hard color.
In Fig.2 we show the 0.5 day averaged PCA intensity evolution of the source in the 2.0–16.5 keV energy band. Using the 16 s time-resolution Standard 2 mode PCA data we calculated the color ratios. The PCA soft color (3.2–5.7 keV/0.7–3.2 keV) shows a linear trend consistent with the ASM one in the same time interval. The PCA hard color (9.4–16.5 keV/5.7–9.4 keV) shows a spectral hardening during the outburst flux decay, compared to the little change of the spectral shape in the soft color.
3.2 TIMING ANALYSIS
We searched for QPOs in the 2–60 keV energy band, using binned mode and event mode PCA data. We computed separately for each of the four datasets a Power Density Spectrum (PDS) in the frequency range between 1/256 and 8 Hz from Fast Fourier Transforms. The PDS is normalized using the method described by Miyamoto et al. (1991), and the Poisson white noise is subtracted. In the resulting PDS two evident QPO signals are present at 0.05 and 0.22 Hz. The QPO feature at Hz is newly detected; the low frequency QPO at Hz was previously observed with Ginga (Takeshima et al., 1994). Both QPOs are detected in the dataset III at very high significance and in the dataset IV at lower statistical significance. Outside these two time periods the QPOs are not obvious. The PDS spectrum also shows high significant peaks at the spin frequency, corresponding to a fundamental frequency of 0.228 Hz, and its higher harmonics. The new QPO is very close to the spin frequency of the NS. This provides the first detection of a clear QPO riding on the spin frequency of a neutron star for a HMXB.

The accurate centroid frequency and the quality factor of the QPOs were found by fitting the PDS with two Lorentzian functions. The broad band-limited noise component was fitted using a power-law and a Lorentzian function. The best fit was also found by removing the spikes of the spin frequency and its harmonics (3–5 frequency bins for each spike) from the PDS. For dataset III (January 15–16, 2005), we found the centroid frequency for the new QPO at Hz and the quality factor . The lower frequency QPO was at Hz with a quality factor of . One month later, using the whole dataset IV we found for the higher frequency QPO Hz and .
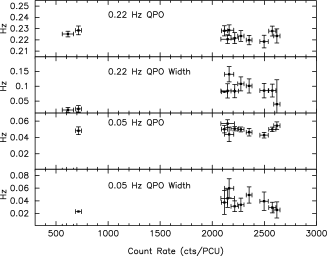
The Fourier transform of the time series resulted in the PDS with best fits shown in Fig.3. In Fig.4 we show the evolution of the QPO centroid frequencies and widths versus the X-ray flux for the datasets III and IV. We found that the centroid frequencies of both QPOs do not change significantly with the flux, while the width of the 0.22 Hz QPO drops with lower flux level.
To investigate the QPO energy dependence, we estimated the fractional root-mean-square (rms) from the PDS. We consider only the dataset III for this analysis, since the two QPOs stand out significantly in this outburst phase. We find for both QPOs that the rms is roughly constant below 10 keV and decreases by a factor of 2 at higher energies (Fig.5). The fact that this trend was not found in the 1989 outburst using Ginga data may be due to the relatively small effective area of the detector (Takeshima et al., 1994).

4 DISCUSSION
We have discovered a new QPO in V 0332+53 at Hz, close to the spin frequency of the neutron star. This new QPO was visible in the PDS at the same time as the well known Hz QPO. The fact that the QPO is found near the spin frequency suggests that it is produced on or near the surface of the NS. QPOs found in HMXB pulsars have a frequency range of about 10 mHz to 400 mHz (Finger, 1998; Ghosh, 1998, for review ) , though none have so far been detected at the NS spin frequency. Broadening features in the PDS at the spin frequency were detected as well in some other HMXB such as Vela X-1, although they were not classified as QPOs (Lazzati & Stella, 1997). The QPOs found in HMXBs are considerably lower compared with those found in low mass X-ray binary (LMXB) systems which lie in a frequency range from to 50 Hz for the low frequency QPO and Hz for the higher frequency QPO (e.g., van der Klis, 2004, for review). In LMXB, one of the QPOs is interpreted as the NS spin frequency; this may imply a similar origin for the newly observed QPO in the HMXB V 0332+53.
The precise nature of the QPO is still unknown. However, a series of models have been proposed to explain the QPO features observed in compact X-ray binary systems (e.g., van der Klis, 2004; Finger, 1998; Ghosh, 1998, for review). Among the most frequently used are the magnetospheric beat frequency model (MBFM) and the Keplerian frequency model (KFM). In the MBFM, the QPO frequency is interpreted as the beat frequency between the stellar rotation, , and the Keplerian rotation, , at the inner edge of the accretion disk, i.e., (Alpar & Shaham, 1985; Shibazaki & Lamb, 1987). The X-ray flux is proportional to the mass accretion rate, i.e., . In the KFM (van der Klis et al., 1987), the QPOs arise from the modulation of the X-rays by inhomogeneities in the inner disk at the Keplerian frequency, i.e., , and the X-ray flux is .
Both models predict a systematic change of the QPO frequency with the mass-accretion rate or with the flux. However, as shown in Fig.4, such a feature is not observed in V 0332+53. From dataset III to IV the X-ray flux changed by a factor of , but the centroid frequencies of both QPOs remain constant within the error bars. This suggests that neither the MBFM nor the KFM can explain the QPO phenomena as observed in V 0332+53. Similar conclusions have been drawn by different authors. For example, the expected luminosity related to the QPO frequency does not always agree with the observed luminosity (Finger, 1998). Other observations have not been supported by the MBFM model, e.g., as found by Takeshima et al. (1994) through the comparison of the estimated Alfvén radius from accretion disk theory (Ghosh & Lamb 1979a,b).
One alternative model to explaining such correlations was given by Lazzati & Stella (1997) and Burderi et al. (1997). They argued that the accretion flow is inhomogeneous near the surface of the neutron star, and random shots are characterized by an arbitrary degree of modulation. The combination of rotation and radiative transfer effects should therefore produce a periodic modulation of the shots similar to that of any continuum X-ray emission from the polar caps. They proposed that a coupling between the periodic and red-noise variability should be frequently present in X-ray pulsars. The discovery of a new QPO with the frequency of the spinning neutron star provides an additional example which could be understood within the scenario of this model.
References
- Alpar & Shaham (1985) Alpar, M. A., & Shaham, J. 1985, Nature, 316, 239
- Burderi et al. (1997) Burderi, L., Robba, N. R., Barbera, N. L., & Guainazzi, M. 1997, ApJ, 481, 943
- Bernacca et al. (1984) Bernacca, P. L., Iijima, T., & Stagni, R. 1984, A&A, 132, L8
- Coburn et al. (2005) Coburn, W., Kretschmar, P., Kreykenbohm, I., et al. 2005, Astron. Telegram, 381
- Finger (1998) Finger, M. H. 1998, Adv. Space Res., 22, 1007
- Ghosh & Lamb (1979a) Ghosh, P., & Lamb, F. K. 1979a, ApJ, 232, 259
- Ghosh & Lamb (1979b) Ghosh, P.,& Lamb, F. K. 1979b, ApJ, 234, 296
- Ghosh (1998) Ghosh, P. 1998, Adv. Space Res., 22, 1017
- Goranskij & Barsukova (2005) Goranskij, V., & Barsukova, E. 2005, Astron. Telegram, 245
- Jahoda et al. (1996) Jahoda, K., Swank, J.H., Giles, A.B., et al., 1996, Proc. SPIE, 2808, 59
- Honeycutt & Schlegel (1985) Honeycutt, R. K. & Schlegel, E.M. 1985, PASP, 97, 300
- Kreykenbohm et al. (2005) Kreykenbohm, I, et al. A&A, 433, L45
- Lazzati & Stella (1997) Lazzati, D., & Stella, L. 1997, ApJ, 476, 267
- Makishima et al. (1990a) Makishima K., Ohashi, T., Kawai, N., et al. 1990a, PASJ, 42, 29
- Makishima et al. (1990b) Makishima K., Mihara, T., Ishida M., et al. 1990b, ApJ, 365, L59
- Miyamoto et al. (1991) Miyamoto, S., Kimura, K., Kitamoto, S., et al. 1991, ApJ, 383, 784
- Negueruela et al. (1999) Negueruela, I,. Roche, P., Fabregat, J., & Coe, M. J. 1999, MNRAS, 307, 7695
- Remillard (2004) Remillard, R. 2004, Astron. Telegram, 371
- Shibazaki & Lamb (1987) Shabazaki, N., & Lamb, F. K. 1987, ApJ, 318, 767
- Soldi et al. (2005) Soldi, S, Produit, N., Belanger, G., et al. 2005, Astron. Telegram, 382
- Stella et al. (1985) Stella, L., White, N. E., Davelaar, J., et al. 1985, ApJ, 288, L45
- Terrell & Priedhorsky (1984) Terrell, J., Predhorsky, W. C. 1984, ApJ, 285, L15
- Takeshima et al. (1994) Takeshima T., Dotani T., Mitsuda K., Nagase F. 1994, ApJ, 436, 871
- Tanaka et al. (1983) Tanaka, Y., & Tenma Team. 1983, IAU Circ., 3891
- Unger et al. (1992) Unger, S. W.; Lewis, J. R.; Pedlar, A.; Axon, D. J. 1992, MNRAS, 256, 725
- e.g., van der Klis (2004) van der Klis, M. 2004, in “Compact stellar X-ray sources”, Lewin & van der Klis (eds.), Cambridge University Press [astro-ph/0410551]
- van der Klis et al. (1987) van der Klis, M., Jansen F., van Paradijs, J. P. 1987, ApJ, L19
- Zhang et al. (2005) Zhang, S., Qu, J.L., Song, L.M., Torres, D. F. 2005, submitted to ApJ