VLA H53 radio recombination line observations of the ultraluminous infrared galaxy Arp 220
Abstract
We present high angular resolution () observations made with the Very Large Array (VLA) of the radio recombination line (RRL) H53 and radio continuum emission at 43 GHz from the ultraluminous infrared galaxy (ULIRG) Arp 220. The 43 GHz continuum emission shows a compact structure () with two peaks separated by , the East (E) and West (W) components, that correspond to each galactic nucleus of the merger. The spectral indices for both the E and W components, using radio continuum images at 8.3 and 43 GHz are typical of synchrotron emission (). Our 43 GHz continuum and H53 line observations confirm the flux densities predicted by the models proposed by Anantharamaiah et al. (2000). This agreement with the models implies the presence of high-density ( cm-3) compact HII regions ( pc) in Arp 220. The integrated H53 line emission is stronger toward the non-thermal radio continuum peaks, which are also coincident with the peaks of molecular emission of the H2CO. The coincidence between the integrated H53 and the H2CO maser line emission suggests that the recent star forming regions, traced by the high density gas, are located mainly in regions that are close to the two radio continuum peaks. A velocity gradient of km s-1 pc-1 in the H53 RRL is observed toward the E component and a second velocity gradient of km s-1 pc-1 is detected toward the W component. The orientations of these velocity gradients are in agreement with previous CO, HI and OH observations. The kinematics of the high-density ionized gas traced by the H53 line are consistent with two counter rotating disks as suggested by the CO and HI observations.
1 INTRODUCTION
Arp 220 (IC 4553/4; UGC 9913; IRAS 15327+2340) has an infrared luminosity of L⊙, as determined from IRAS m observations (Soifer et al. 1984), and therefore is classified as an ULIRG. At a distance of Mpc (H km s-1 Mpc-1), Arp 220 is characterized in the optical by tidal tails interpreted as the signature of a merging process (Surace, Sanders & Evans 2000). The large visual extinction toward Arp 220, which could be A mag (González-Alfonso et al., 2004), precludes the observations of the nuclear regions at optical and even at infrared frequencies. Radio frequency observations do not suffer from dust extinction, providing a powerful tool to investigate the kinematics, morphology and physical properties of the gas in the dust-obscured regions of Arp 220. Radio observations reveal a double-nucleus system separated by 1′′ ( pc) as observed in CO and HI (Mundell et al., 2001; Sakamoto et al., 1999). The existence of multiple luminous radio supernovae (RSN) in the nuclear regions of Arp 220 suggests that it is mainly starburst-powered (Smith et al., 1998). However, compact OH maser and X-rays emission suggest the presence of AGN activity in the W nucleus (Norris et al., 1985; Lonsdale et al., 1998; Clements et al., 2002).
High angular resolution () CO observations carried out by Sakamoto et al. (1999) suggest that the two nuclei are counter-rotating with respect to each other and are embedded in a kiloparsec-size gas disk, which rotates around their dynamical center. The counter-rotation is also observed in higher angular resolution () observations of HI absorption (Mundell et al., 2001), which show that the rotation is not coplanar and proposed a model in which the two nuclei are in the final state of merging. Counter-rotation may provide the mechanism to get rid of angular momentum, a condition for the two nuclei to merge. The senses of the velocity gradients, as determined from OH maser emission observations (Rovilos et al., 2003), are consistent with CO molecular emission and HI absorption observations (Sakamoto et al., 1999; Mundell et al., 2001).
Arp 220 is the most distant system from which radio recombination lines (RRLs) have been observed (Zhao et al., 1996; Anantharamaiah et al., 2000). VLA observations of the centimeter wavelength RRL H92 have been reported by Zhao et al. (1996) and Anantharamaiah et al. (2000) with angular resolutions of 4′′ and 1′′, respectively. Anantharamaiah et al. (2000), using a single dish telescope (IRAM 30m), detected the emission of the millimeter wavelength RRLs H42, H40, and H31 and with the VLA established upper limits for the RRLs H167 and H165. Anantharamaiah et al. (2000) constructed a model using three density components of ionized gas in order to reproduce the observed RRL and radio continuum intensities, obtaining a star formation rate (SFR) in Arp 220 of M⊙ yr-1. The existence of a high-density component of ionized gas, as deduced from these models, has been interpreted as evidence for recent star formation in Arp 220. In particular, the RRL H53 can be used as a tracer of thermal high-density gas ( cm-3). The star formation in this system may be supported by multiple starbursts with a high star formation rate.
In this paper we present VLA observations of Arp 220 in the millimeter regime of the RRL H53 (7 mm) as well as the radio continuum at 43 GHz with subarcsecond () angular resolution. The observations are described in §2. In Section 3 the results obtained from the 43 GHz radio continuum and the RRL H53 are presented. In § 4 the implications of these results are discussed. The conclusions are presented in § 5.
2 VLA Observations of the H53 line.
The RRL H53 (43 GHz) was observed with the VLA in the C configuration on October 13 and 25, 2002. The flux density scales were determined using observations of J1331+305 (1.49 Jy). The fast-switching mode was used in order to track the phase variations induced by the troposphere using cycles of 230 s on Arp 220 and 40 s on the phase reference source J1540+147 ( Jy). The bandpass response of the instrument is frequency dependent and observations of a bandpass calibrator were required for each frequency window. This bandpass response was corrected using observations of J1229+020 ( Jy). Five frequency windows, each of these with 15 spectral channels ( km s-1 each), were used to observe the broad RRL. The total velocity coverage is 1000 km s-1. The different frequency windows were centered at 42114.9, 42135.1, 42164.9, 42185.1 and 42214.9 MHz. The on-source integration time was 2 hrs for each frequency window. To avoid possible phase decorrelation at 7 mm, the calibration of the data was performed correcting for the phases in a first step and subsequently correcting for both amplitude and phase. The spectral line data were further calibrated by applying the solutions obtained from the self-calibration performed on the continuum channel (which contains the average of the central 75% of the bandpass) of each frequency window. The spectral line observations of the second day were not combined with those of the first day since the variable content of water vapor in the troposphere caused decorrelation of phases in the second and third frequency windows. A critical step in the reduction of the data is to determine the bandpass shape by normalizing the bandpass using the channel 0 data. Five line images, one for each frequency window of the first day, were produced using a weighting scheme intermediate between natural and uniform to obtain a circular beam of . The five line cubes were regridded in frequency and combined into a single line cube in the GIPSY environment. The method used to combine different windows is described by Rodríguez-Rico et al. (2004). The data were then Hanning-smoothed to minimize the Gibbs effect and a final velocity resolution of km s-1 was achieved. The parameters of the observations are given in Table 1. The resulting line cube was further processed using IMLIN from AIPS to subtract the continuum emission. A first order polynomial fit was used for the line-free channels, two on the low-velocity edge and five on the high velocity-edge of the bandpass. Previous Arp 220 observations of the RRL H42 (Anantharamaiah et al., 2000), CO(2-1) emission line (Sakamoto et al., 1999) and HI absorption (Mundell et al., 2001), show that the full width at zero intensity expected for the H53 line is in the range from to km s-1. The velocity range covered by the H53 line observations is km s-1, consequently loosing the continuum that corresponds to the blueshifted side of the line. We performed a test using the line-free channels on the blueshifted side of the line as a baseline. We have determined that if weak H53 line emission with intensity mJy () is present in the velocity range of km s-1 the full width at half maximum (FWHM) is not affected. The fit for the H53 line is in agreement with the fit obtained using the continuum for the low velocity edge of the bandpass. The H53 (43 GHz) data have been compared with the RRL H92 (8.3 GHz) observations taken by Anantharamaiah et al. (2000) with the VLA in the B array.
3 RESULTS
3.1 Radio continuum.
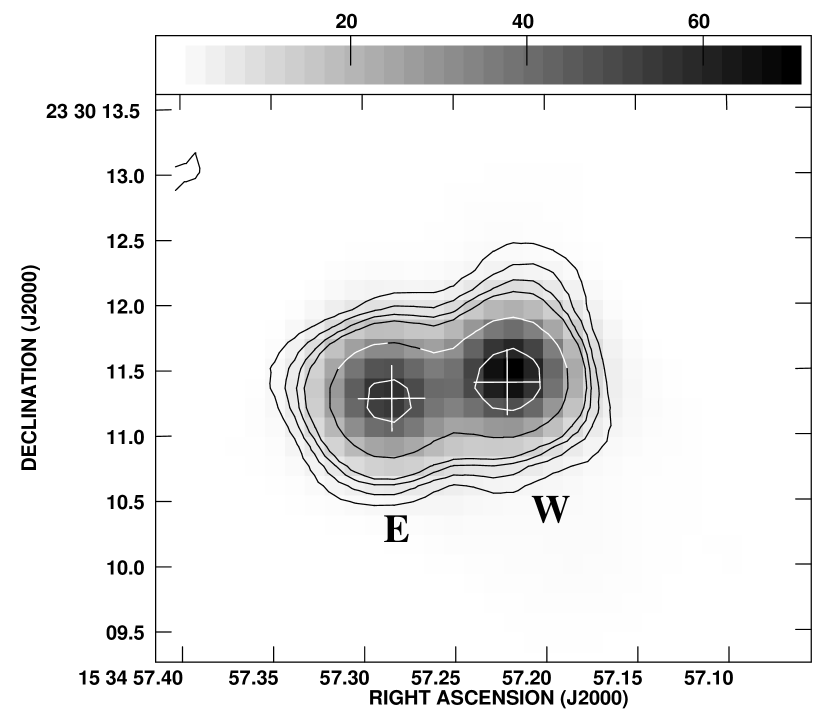
Figure 1 shows the continuum image of Arp 220 at 43 GHz superposed on the continuum image at 8.3 GHz, both images with an angular resolution of . In this image, the two continuum peaks (E and W) are clearly resolved at both frequencies. Using the task IMFIT in AIPS we estimated the properties of these two components. The physical parameters at 8.3 and 43 GHz were obtained integrating over equivalent areas in order to estimate the spectral index (S) of each component.
Table 2 lists the physical parameters of the continuum components E and W determined at 43 GHz. The total measured 43 GHz continuum flux density of Arp 220 is mJy. The E and W components have continuum flux densities of and mJy, respectively. There is also a contribution of mJy to the total flux density from extended emission that was determined using the task IRING in the AIPS environment by integrating the flux density over an angular scale of to . This total continuum flux density at 43 GHz is in agreement with the value obtained by interpolating from previous observations at 32 GHz and 97 GHz (Downes & Solomon 1998, Anantharamaiah et al. 2000). The continuum physical parameters at 8.3 GHz of both the E and W components in Arp 220 are listed in Table 3. The positions of each continuum peak are coincident at 8.3 and 43 GHz. The two radio nuclei of Arp 220 are separated by at a position angle of 95∘ (E with respect to N). The spectral index between these two frequencies for the E component is and for the W component is . These spectral indices are typical of non-thermal emission.
3.2 Radio Recombination Line H53
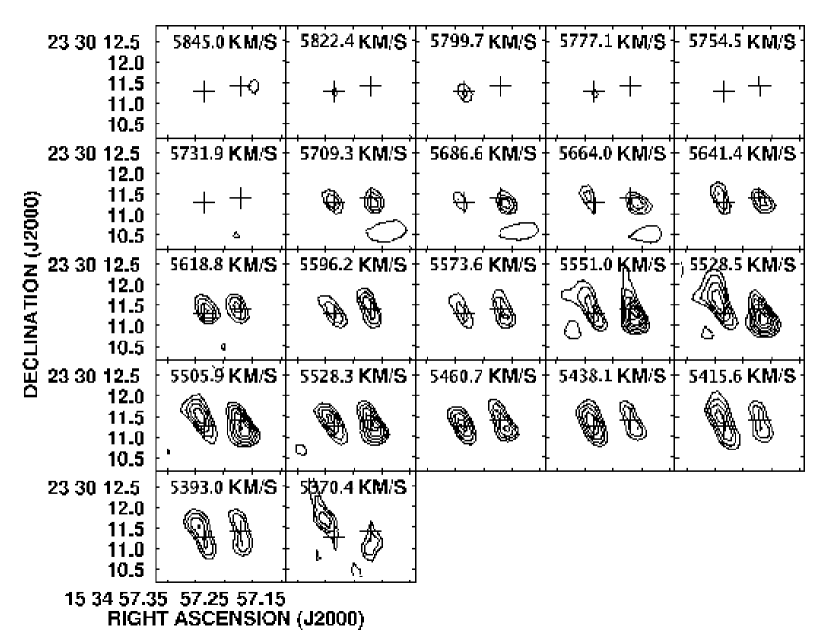
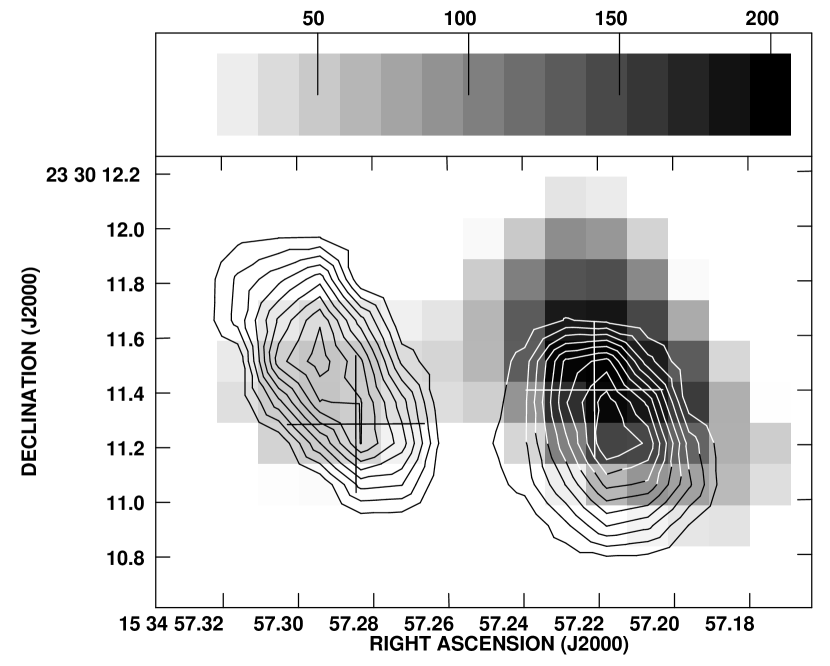
We detected H53 RRL emission ( mJy) toward both components, E and W, of Arp 220 in the velocity range 5370 to 5845 km s-1. The velocity range over which the H53 line emission is observed agrees with observations of the RRLs H40, H42, and H92 (Anantharamaiah et al., 2000) and the CO(2-1) line (Sakamoto et al., 1999). Figure 2 shows the VLA spectral channel images of H53 line emission observed over the central pc of Arp 220. Figure 3 shows the velocity-integrated line emission (moment 0) of the H53 line superposed on the moment 0 of the H92 line. The peaks in the moment 0 of the H53 line emission are nearly coincident () with the two radio continuum nuclei. The moment 0 of the H92 line emission (shown in gray scale) exhibits two peaks that are close to the continuum peaks and are coincident with the H53 peaks within .
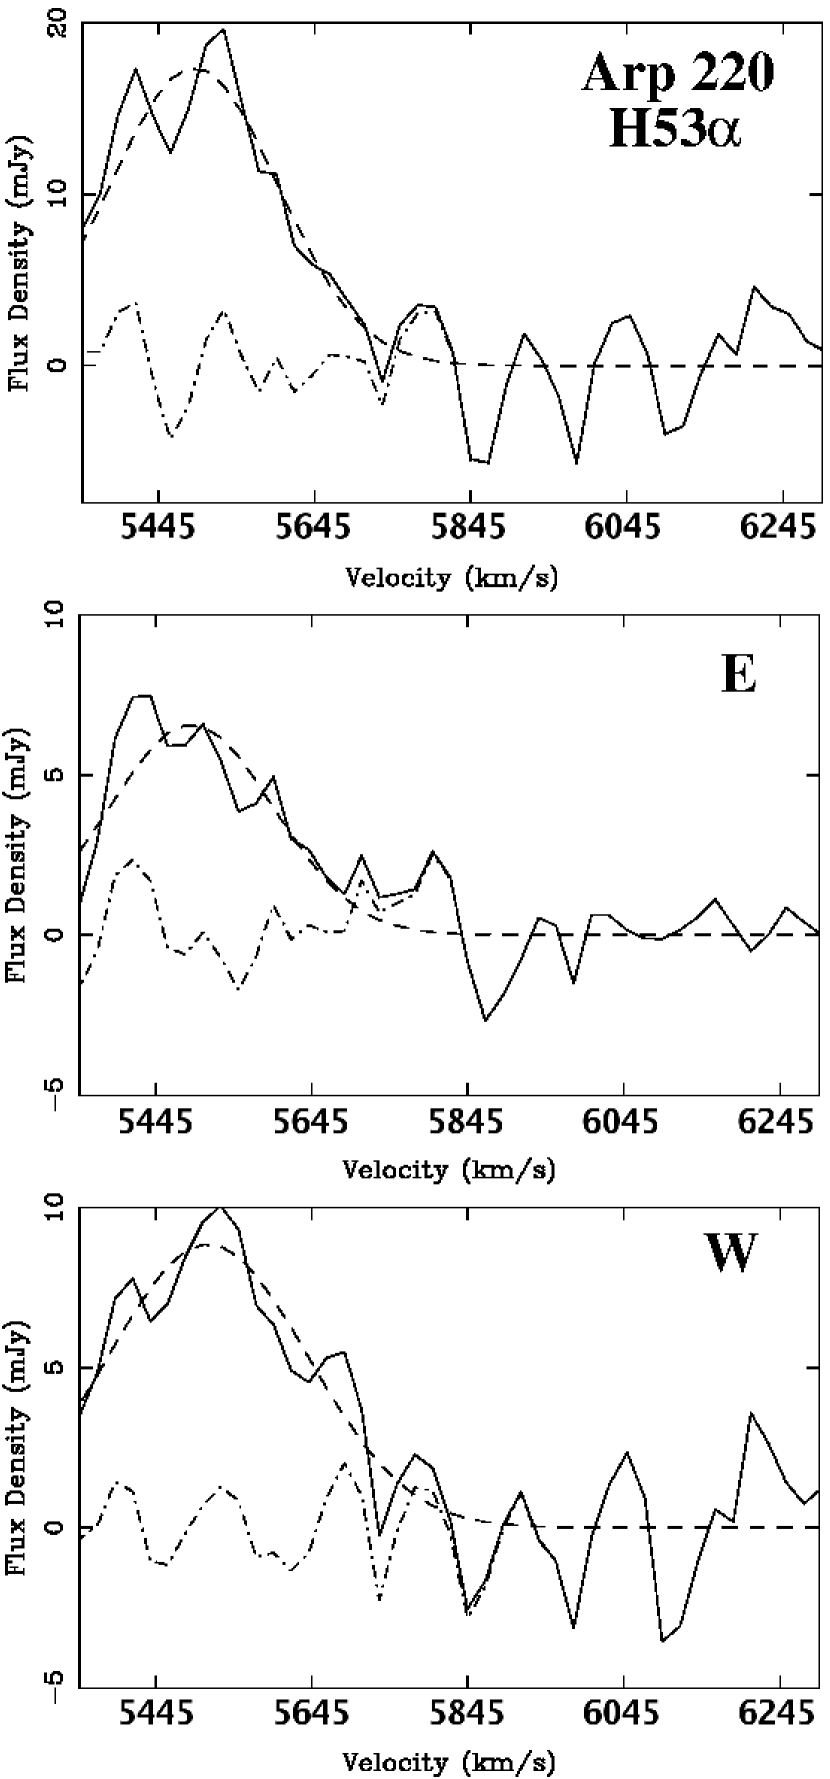
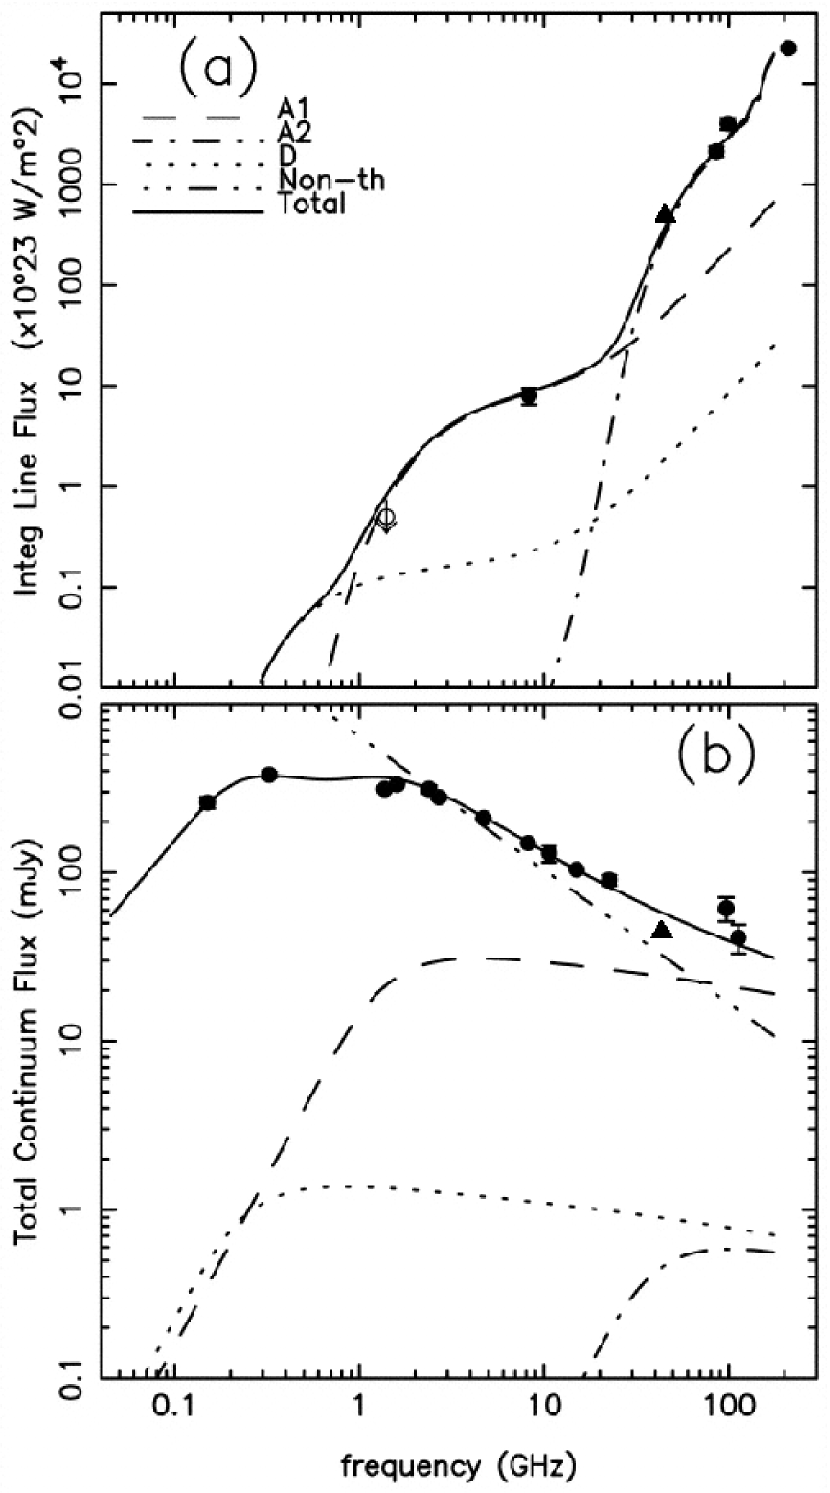
The total integrated spectrum over the region with detectable H53 line emission is shown in Figure 4 along with the E and W spectra obtained by integrating over each of these components. A single Gaussian fit was carried out for each line profile. The results from the H53 line fits are listed in Table 4. The peak line flux density in column (2), The FWHM of the line is given in column (3), the heliocentric velocity of the line center in column (4) and the integrated line emission in column (5). Based on the fit parameters for the E and W components, the peak H53 line flux density for the W component is approximately 30% stronger than the E component. The H53 line widths and central velocities are similar for the E and W components. The H53 and H92 line widths and central velocities determined for the total integrated line emission over Arp 220 are in good agreement with each other. Figure 5 shows the results from radio continuum and RRL emission models taken from Anantharamaiah et al. (2000). The measurements for the total integrated 43 GHz continuum and H53 line emission are shown in Figure 5a and 5b, respectively.
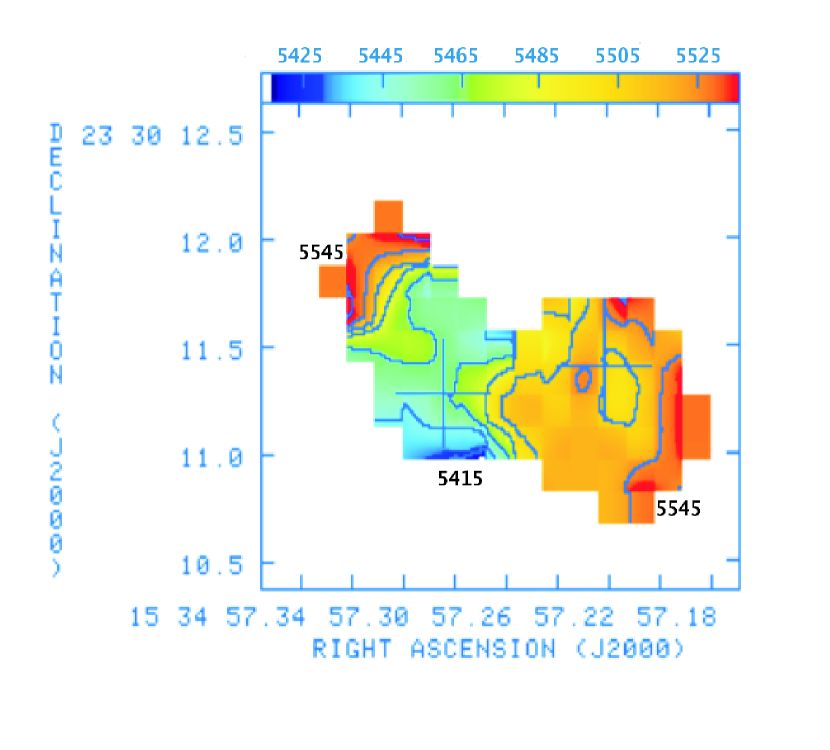
Figure 6 shows the H53 line velocity field (moment 1) for the ionized gas in Arp 220. Based on this H53 velocity field, two velocity gradients are observed toward the E and W components. The velocity gradient on the E component is km s-1 pc-1, oriented along a P.A. of . The velocity gradient on the W component has been marginally detected ( km s-1 pc-1) along a P.A. of . Due to the lower velocity resolution of the H92 line ( km s-1), compared to the velocity resolution of the H53 line ( km s-1), a detailed comparison of the H53 and the H92 velocity fields is not possible.
4 DISCUSSION
The measured separation between the two continuum peaks ( pc) and the P.A. of their separation (95∘) at 43 GHz are in good agreement with previous measurements ( pc) at 5, 15 and 23 GHz (Norris, 1988) and 4.8 GHz (Baan & Haschick, 1995). The peak positions at 8.3 and 43 GHz agree at the level of . The spectral index for Arp 220, determined using the radio continuum flux density of mJy measured at 8.3 GHz and the measurement at 43 GHz of mJy, is . On the other hand, the spectral index determined using the radio continuum flux density of mJy measured at 32 GHz (Baan, Gusten & Haschick 1986) and the measurement at 43 GHz (this work) of mJy, is (). Anantharamaiah et al. (2000) estimated that the thermal radio continuum flux density at 5 GHz is mJy. Using a spectral index value for the thermal free-free emission the expected thermal flux density at 43 GHz is mJy, which is of the total measured continuum flux density at 43 GHz (see Figure 5). The flattening of the spectral index, a value of closer to zero when the 32 and 43 GHz measurements are used, indicates that the ratio between the thermal emission and non-thermal emission is larger at 43 GHz than at 8.3 GHz.
Anantharamaiah et al. (2000) modeled the emission of radio continuum and RRL observations at different frequencies. In these models Anantharamaiah et al. (2000) used three thermally ionized gas components (A1, B1 and D) and non-thermal emission. Components A1 and D are characterized by electron densities of cm-3, while component B1 has a larger electron density of cm-3. All parameters for each of these components are listed in Table 9 of Anantharamaiah et al. (2000). Figure 5 shows the model results from Anantharamaiah et al. (2000) including the measurements of the H53 line ( W m-2 or 3.7 Jy km s-1) and the continuum flux density at 43 GHz ( mJy). The H53 line and 43 GHz continuum flux densities are in agreement with the values predicted in the Anantharamaiah et al. (2000) models, confirming the presence of a high-density ionized gas component ( cm-3) composed of compact HII regions with pc diameter. According to these models the contribution from the dense gas to the H92 line emission is negligible and the contribution from the lower density gas to the H53 line is .
On the other hand, the models of Anantharamaiah et al. (2000) indicate that of the H53 line emission in the high-density ionized gas is due to internal stimulated line emission. The spatial distribution of the H53 and the H92 lines is similar toward the E component as can be seen in Figure 3. However, a remarkable difference is observed toward the W component where the H92 line emission is more extended than the H53 line emission. Near the continuum peaks, the spatial distribution of the H53 and H92 RRLs emission suggests that the recent star formation is taking place mostly in two regions. These two regions of line emission are slightly displaced from the respective continuum peaks: the W line peak is to the S of its associated continuum peak and the E line peak is to the N of its associated continuum peak. According to the integrated H53 line emission (see Figure 3), the bulk of high-density ionized gas is concentrated in these two regions. This result is supported by the spatial correlation between the two velocity-integrated H53 line emission peaks and the peaks of the formaldehyde (H2CO) molecular emission (Baan & Haschick, 1995).
The models of Anantharamaiah et al. (2000) derived a SFR in Arp 220 of 240 M⊙ yr-1, assuming a mass range of M⊙ in the Miller-Scalo initial mass function (IMF). According to these models, the SFR could be as low as 90 M⊙ yr-1 if the upper mass limit in the IMF is reduced to 60 M⊙ and the Salpeter IMF is used. Given that the radio continuum and the velocity-integrated line flux density are in agreement with the values expected from the models of Anantharamaiah et al. (2000), the value for the SFR could be in the range of 90 to M⊙ yr-1 and the mass of high-density ionized gas ( cm-3) is between and M⊙.
The orientations of the H53 velocity gradients in Arp 220, with P.A. in the E component and P.A. in the W component agree with the CO and HI observations (Sakamoto et al., 1999; Mundell et al., 2001). Based on the P.A. of these two velocity gradients, the CO(2-1) line observations were interpreted by Sakamoto et al. (1999) as evidence of two counter-rotating disks in Arp 220. An alternative model that consists of a warped gas disk that resulted from a merger of two spiral galaxies was also proposed by Eckart & Downes (2001). The angular resolution achieved in the H53 line observations () is insufficient to discern between these two models. The velocity structure of the ionized gas based on the H53 data show two velocity gradients in the two components of Arp 220. On the E component the H53 velocity gradient is km s-1 pc-1. The HI velocity gradient on the E component is km s-1 pc-1 (Mundell et al., 2001) and the OH velocity gradient is km s-1 pc-1 (Rovilos et al., 2003).
The velocity gradient on the E component implies a virial mass of M⊙ in a disk of radius 180 pc ( is the inclination). The total mass calculated from OH observations, for a disk of radius pc, is M⊙ (Rovilos et al., 2003). The value derived from the OH observations is consitent with the H53 line observations when the different sizes are taken into account. Based on HI and CO (Sakamoto et al., 1999; Mundell et al., 2001) observations, the estimates of the total mass are M⊙. The total mass estimated using CO and HI observations is two orders of magnitude larger than the total mass calculated from these H53 line observations. The smaller estimates obtained from the H53 line and OH observations are explained if the molecular CO and neutral HI gas are distributed over a larger region compared to the ionized gas. In the direction of the W component, the H53 velocity gradient is a factor of 10 less than observed in HI absorption and OH maser emission (Mundell et al., 2001; Rovilos et al., 2003). However, the orientation and sense of the velocity gradient in H53 are consistent with those determined from the CO, HI and OH observations (Sakamoto et al., 1999; Mundell et al., 2001; Rovilos et al., 2003).
5 CONCLUSIONS.
We have observed the RRL H53 and radio continuum at 43 GHz toward the ULIRG Arp 220 with high angular resolution () using the VLA. The 43 GHz radio continuum and the RRL H53 have been compared with observations of the 8.3 GHz radio continuum and H92 line (Anantharamaiah et al., 2000).
-
•
The total 43 GHz radio continuum flux density of Arp 220 is mJy. The morphological characteristics observed in the radio continuum at 43 GHz agree with previous radio observations made in the range from to GHz. In the radio continuum at 43 GHz, Arp 220 exhibits a double-nucleus system that has been clearly resolved with a separation of the two radio continuum peaks of at P.A. of 95∘.
-
•
We have determined the spectral indices for both the E and W components, using radio continuum flux densities at 8.3 and 43 GHz. Both components have spectral indices typical of synchrotron emission (), as expected from extrapolation from the centimeter wavelength range.
-
•
Based on 43 GHz VLA data, we confirm the predictions of the models made by Anantharamaiah et al. (2000) for RRLs. The integrated H53 line flux density is about a factor of times larger than the integrated H92 line flux density, in agreement with the predictions of Anantharamaiah et al. (2000). Thus, the H53 line traces the high-density ( cm-3) compact HII regions ( pc) in Arp 220.
-
•
The spatial distributions of the H53 and the H92 line emission are similar in the direction of the E component. On the W component the low density ( cm-3) ionized gas component is more extended than the high density ( cm-3) component.
- •
The original version was published in the Astrophysical Journal, volume 633, page 198 in year 2005. This new version is submitted with the corrected velocity scale. In Figures 2, 4 and 6 the values for radial velocities were incorrect. All velocities were increased by 245 km s-1 to correct values to heliocentric values (optical definition). To obtain the velocities using radio definition, add 145 km s-1. Thus the central velocities in Table 4 should be 5495 km s-1 (optical definition) or 5395 km s-1 (radio definition). This velocity shift was introduced in the frequency reprojection process. The velocity definition in Table 4 is the optical heliocentric definition, as is used by K. R. Anantharamaiah et al. (ApJ, 537, 613 [2000]). All other quantities in the paper remain unchanged, e.g. the radio recombination line and radio continuum integrated properties, as well as distributions.
The National Radio Astronomy Observatory is a facility of the National Science Foundation operated under cooperative agreement by Associated Universities, Inc. CR and YG acknowledge the support from UNAM and CONACyT, México. The authors thank the referee for helpful comments.
References
- Anantharamaiah et al. (2000) Anantharamaiah, K. R., Viallefond, F., Mohan, N. R., Goss, W. M., & Zhao, J. H., 2000, ApJ, 537, 613
- Baan (1985) Baan, W. A., 1985, Nature, 315, 26
- Baan, Gusten & Haschick (1986) Baan, W. A., Gusten, R. & Haschick, A. D., 1986, ApJ, 305, 830
- Baan & Haschick (1995) Baan, W. A., & Haschick, A. D., 1995, ApJ, 454, 745
- Baan & Haschick (1984) Baan, W. A., & Haschick, A. D., 1984, ApJ, 279, 541
- Carilli et al. (1992) Carilli, C. L., Holdaway, M. A., Ho, P. T. P., De Pree, C. G., 1992, ApJ, 399, L59
- Clements et al. (2002) Clements, D. L., & Baker, A. C., 1996, A&A, 314, L5
- Downes & Solomon (1998) Downes, D., & Solomon, P. M., 1998, ApJ, 507, 615
- Eckart & Downes (2001) Eckart, A., & Downes, D., 2001, ApJ, 551, 730
- Genzel et al. (1998) Genzel, R., et al. 1998, ApJ, 498, 579
- González-Alfonso et al. (2004) Gonzalez-Alfonso, E., Smith, H. A., Fischer, J., & Cernicharo, J., 2004, ApJ, 613, 247
- Kennicutt et al. (1998) Kennicutt, 1998, ARAA
- Lonsdale et al. (1998) Lonsdale, C. J., Lonsdale, C. J., Diamond, P. J., & Smith, H. E., 1998, ApJ, 493, 13
- Mundell et al. (2001) Mundell, C. G., Ferruit, P., & Pedlar, A., 2001, ApJ, 560, 168
- Norris et al. (1985) Norris, R. P., Baan, W. A., Haschick, A. D., Diamond, P. J., & Booth, R. S., 1985, MNRAS, 213, 821
- Norris (1988) Norris, R. P., 1988, MNRAS, 230, 345
- Rodríguez-Rico et al. (2004) Rodríguez-Rico, C. A., Viallefond, F., Zhao, J.-H., Goss, W. M., & Anantharamaiah, K. R., 2004, ApJ, 616, 783
- Rovilos et al. (2003) Rovilos, E., Diamond, P. J., Lonsdale, C. J., Lonsdale, C. J., Smith, H. E., 2003, MNRAS, 342, 373
- Sakamoto et al. (1999) Sakamoto, K., Scoville, N. Z., Yun, M. S., Crosas, M., Genzel, R., & Tacconi, L. J., 1999, ApJ, 514, 68
- Sanders & Mirabel (1996) Sanders, D. B., & Mirabel, I. F., 1996, ARA&A, 34, 749
- Scoville et al. (1991) Scoville, N. Z., Sargent, A. I., Sanders, D. B., & Soifer, B. T., 1991, ApJL, 366, 5
- Scoville et al. (1998) Scoville, N. Z. et al., 1998, ApJ, 492, 107
- Smith et al. (1998) Smith, H. E., Lonsdale, C. J., Lonsdale, C. J., & Diamond, P. J., 1998, 493, 17
- Soifer et al. (1984) Soifer, B. T., et al. 1984, ApJ, 283, 1
- Solomon et al. (1992) Solomon, P. M., Downes, D., & Radford, S. J. E., 1992, ApJL, 387, 55
- Zhao et al. (1996) Zhao, J. H., Anantharamaiah, K. R., Goss, W. M., & Viallefond, F., 1996, ApJ, 472, 54
| Parameter | H53 Line |
|---|---|
| Right ascension (J2000) | 15 34 57.28 |
| Declination (J2000) | 23 30 11.9 |
| Angular resolution | |
| Total observing duration (hr) | 13 |
| Bandwidth (MHz) | 150 |
| Number of spectral channels | 45 |
| Center VHel (km s-1) | 5500 |
| Velocity coverage (km s-1) | 1000 |
| Velocity resolution (km s-1) | 44 |
| Amplitude calibrator | J1331+305 |
| Phase calibrator | J1540+147 |
| Bandpass calibrator | J1229+020 |
| RMS line noise per channel (mJy/beam) | 1 |
| RMS, continuum (mJy/beam) | 0.3 |
| Feature | RA (J2000) | DEC (J2000) | SizeaaDeconvolved angular size., P.A. | SC (mJy) |
|---|---|---|---|---|
| Arp 220 E | , 89∘ | |||
| Arp 220 W | , 114∘ |
| Feature | RA (J2000) | DEC (J2000) | SizebbDeconvolved angular size., P.A. | SC (mJy)ccContinuum flux densities were measured in the same area as the 43 GHz continuum flux densities listed in Table 2. |
|---|---|---|---|---|
| Arp 220 E | , 88∘ | |||
| Arp 220 W | , 107∘ |
| Feature | SP | VFWHM | VHelio | (SP VFWHM ) |
|---|---|---|---|---|
| (mJy) | (km s-1) | (km s-1) | (W m ) | |
| Arp 220 E | ||||
| Arp 220 W | ||||
| Arp 220 E+W |