An X-ray Galaxy Cluster Survey for Investigations of Dark Energy
a White Paper submitted to the Dark Energy Task Force, 15 June 2005
point of contact: keith.m.jahoda@nasa.gov
Z. Haimanf, S. Allenr, N. Bahcallq, M. Bautzl, H. Boehringern, S. Borganis, G. Bryanf, B. Cabrerar, C. Canizaresl, O. Citteriob, A. Evrardo, A. Finoguenovn, R. Griffithsd, G. Hasinger,n P. Henryi, K. Jahodah, G. Jernigana, S. Kahnr, D. Lambe, S. Majumdarc, J. Mohrj, S. Molendit, R. Mushotzkyh, G. Pareschib, J. Petersonr, R. Petreh, P. Predehln, A. Rasmussenr, G. Rickerl, P. Rickerk, P. Rosatig, A. Sandersonj, A. Stanfordk, M. Voitp, S. Wangf, N. Whiteh, S. Whitem
aBerkeley, bINAF-OAB, cCITA, dCarnegie Mellon, eChicago, fColumbia, gESO, hGSFC, iHawaii, jIllinois, kLivermore, lMIT, mMPA, nMPE, oMichigan, pMichigan State, qPrinceton, rStanford, sTrieste, tIASF-INAF
The amount and nature of dark energy (DE) can be tightly constrained by measuring the spatial correlation features and evolution of a sample of galaxy clusters over the redshift range . Such an X-ray survey will discover all collapsed structures with mass above at redshifts (i.e. the full range where such objects are expected) in the high Galactic latitude sky. Above this mass threshold the tight correlations between X-ray observables and mass allow direct interpretation of the data.
DE affects both the abundance and the spatial distribution of galaxy clusters. Measurements of the number density and the three–dimensional power spectrum of clusters are complementary (have different parameter degeneracies) to other DE probes, such as Type Ia SNe or CMB anisotropies, and precisely constrain cosmological parameters.
The abundance and power spectrum of collapsed dark matter halos are theoretically computable from ab–initio models, with no free parameters (other than cosmology). Uncertainties in the relation between the halo mass and the observable X-ray flux can be overcome through a process of self-calibration, taking advantage of the synergy between the two observables. While clusters are highly biased tracers of the mass distribution, the bias is calculable from the same simulations that derive the mass function. Hence the large bias is a bonus - it increases the signal–to–noise of the measurement by a (mass limit dependent) factor of 10-100.
X-ray emission is an efficient and robust way to identify clusters. Imaging X-ray cluster surveys have high and well understood completeness, low rates of contamination, and the selection function is well understood without complex simulations.
The DE investigations that we describe can be performed with a survey of 20,000 deg2 to a 0.5–2 keV flux limit of . At this flux the X-ray sky is dominated by clusters and AGN, which can be separated with an angular resolution of 15 arsec. The number–flux relationship is well known to the proposed depth (Gioia et al. 2001; Rosati et al. 2002). The proposed survey, consistent in technical scope with a NASA Medium Explorer mission, will identify clusters. Multi-band optical surveys to provide the required photometric redshifts are already in the planning stages, and will be contemporaneous with or precede our X-ray survey.
b. Precursor Observations
We need accurate cluster redshifts () to for 100,000 clusters. Most of these redshifts will be derived from multi-band photometry. Photometric redshifts from recent optical surveys (Csabai et al. 2003; Blindert et al. 2004; Hsieh et al. 2005) have demonstrated this level of statistical precision to redshifts . Deeper surveys (itemized below) will provide photometry of similar accuracy to redshift . With large spectroscopic training sets systematic biases can be controlled at the level of (see the Dark Energy Survey (DES) white paper submitted to this same panel), which is small enough so that it makes no meaningful contribution to the error budget.
There are two key considerations for photometric cluster redshift determination. First, the redshift signal comes from shifting the prominent 4000 Angstrom break in red early-type cluster galaxies through the various bands, thus the optical photometry must extend to a wavelength of 10,000 Angstrom for clusters at z = 1.5. Second, the photometry must be deep enough to obtain redshifts for cluster members in order to reduce the statistical errors on any one galaxy.
Planned surveys meet both requirements. The Sloan Digital Sky Survey (SDSS) exists and provides spectroscopic redshifts of cluster galaxies to over deg2. The photometric redshifts derived from the 5 SDSS bands are accurate to 0.03 for an individual galaxy. The PanSTARRS survey instrument is currently under construction in Hawaii. It will survey 30,000 deg2 in five bands (g, r, i, z, and Y, i.e. to 10,000 Angstrom) to sufficient depth to provide redshifts of the required accuracy to z = 1.5. The DES, under consideration by the DOE and NSF, will survey 5000 deg2 in the south, complementary to PanSTARRS, in four bands (g, r, i, and z) to sufficient depth to provide redshifts of the required accuracy to . The Large Synoptic Survey Telescope (LSST) is currently being designed. It will provide five band data much deeper than the required limit for a solid angle approaching 20,000 deg2. Training sets will be available from public spectroscopic data, such as SDSS, 2dF-SDSS, VIRMOS-VLT Deep Survey and the Keck Deep2 Survey.
The DES survey complements (by design) the CMB mapping experiment by the South Pole Telescope (SPT) which is funded to begin operation in 2007 and which will deliver a sample of more than 20,000 galaxy clusters over 4000 deg2 extending to . Combining mm-wave and X-ray data on clusters enables new science such as direct distance measurements (Molnar et al. 2004). The all-sky, low angular resolution (5-10 arcminute) CMB mapping experiment Planck will deliver interesting SZE observations of many massive and nearby galaxy clusters.
c. Systematic Errors
The primary systematic concerns in a cluster survey fall into four categories: (1) cluster mass uncertainties, (2) cluster sample completeness and contamination, (3) theoretical uncertainities and (4) redshift accuracy (discussed in “Precursor Observations”). In fact, analyses of current cluster samples of a few hundred systems are already systematics limited in their constraints on and because of uncertainties in galaxy cluster masses (e.g. Pierpaoli et al. 2003; Evrard et al. 2002; Schuecker at al. 2003; Henry 2004). Self-calibration (below) and external calibration (e.g. from detailed studies of numerous individual clusters with Constellation–X, see the white paper submitted to this panel) will address these systematics. Below we discuss each systematic in turn.
Cluster masses: During the matter dominated phase that fosters the growth of large-scale structure, clusters lack a clearly defined edge (Lacey & Cole 1993; White 2001; Busha et al 2005). Still, the halo population can be ordered by a mass contained within a characteristic density . Correlations between and bulk observables like X-ray luminosity or temperature are exhibited in both observations (Mohr et al. 1999; Voevodkin & Vikhlinin 2004; Ettori et al 2004; Voit 2005) and hydrodynamical structure formation simulations (Bryan & Norman 1998; Mathiesen & Evrard 2001; Gardini & Ricker 2004; Kravtsov et al. 2005; Motl et al. 2005). The mass-observable correlations possess a known intrinsic scatter that must be included in any cosmological analyses (Levine et al. 2002; Lima & Hu 2005).
In a large cluster survey there are several reservoirs of information about cosmology and cluster structure (including mass). These include the redshift distribution of clusters, their spatial clustering, their intrinsic shapes and alignments, the forms of the luminosity and temperature functions as function of redshift, as well as scaling relations between various bulk cluster properties. In a recent breakthough, it has been shown that the information in deep surveys is rich enough to solve for the unknown mass-observable parameters with only modest degradation of contraints on the nature of dark energy (Majumdar & Mohr 2003, 2004; Hu 2003; Lima & Hu 2004; Wang et al 2004). The bottom line is that self-calibration of a large, clean cluster sample over large, contiguous regions of the sky can overcome the cluster mass uncertainties. We emphasize that our analysis below does not assume that the cluster mass can be computed from any ab–initio model.
The sensitivity of a self-calibrated cluster survey is greatly improved if a small fraction of the clusters have externally derived masses (Majumdar and Mohr 2004). Such external calibration could come from deep imaging and spectroscopic X-ray measurements of selected objects (Chandra and XMM will provide a few hundred objects; Constellation-X will eventually provide a few thousand objects; many of which will be identified by this survey). Additionally, the optical datasets which provide redshifts also provide shear maps that, when appropriately averaged, offer an independent calibration tool for the mass–luminosity and mass–temperature relations. While deep optical maps of the survey region could in principle be used to define a shear selected cluster sample, such samples are expected to have low () completeness and high contamination, with at least as many false detections as real clusters (Hamana et al. 2004; Hennawi & Spergel 2005). These attributes currently limit the value of shear selected surveys for cluster cosmology. However, the statistics of the full shear map, or cosmic shear, offers additional cosmological constraints (Bacon et al. 2001; Jain 2002; Bernstein & Jain 2004; Massey et al. 2005).
Cluster selection: Cluster selection must be well understood to use the full statistical power of a 100,000 cluster sample. Cluster survey completeness and contamination are well understood in the X-ray regime. Because of the high contrast of cluster X-ray emission relative to the background, selecting clusters requires characterizing X-ray sources as extended (clusters or galaxies) or point-like (AGN and stars). Clusters outnumber galaxies by a factor of several hundred; X-ray colors and optical counterparts separate these populations. Mock observations including clusters and AGN indicate that % of clusters at the proposed flux limit (corresponding to 50 photons) are recovered with a 15 arcsec HEW imager. In addition, the contamination of these same samples is less than a few %, consistent with previous X-ray surveys (Vikhlinin et al 1998; Rosati et al. 1998). For instance, the ROSAT-based 160 deg2 survey (Vikhlinin et al 1998) had 223 X-ray extended objects of which 203 were cluster candidates after comparison with optical images. 201 were spectroscopically confirmed as clusters (Mullis et al. 2003) giving a 1% false positive rate for a survey using the much larger PSF (40 arcsec) of the ROSAT PSPC.
To use the statistical power of clusters distributed over a range of redshift, we need to limit the effects of uncertainty in our survey completeness and contamination to the 1% level. Starting from such a high completeness and low contamination this kind of sample control is straightforward. In comparison to other cluster survey methods like the SZE, optical and weak lensing, the X-ray selection is by far the cleanest approach for selecting massive, collapsed halos (e.g. galaxy clusters).
Theoretical Uncertainty: A remaining concern is the level of accuracy in theoretical predictions of the mass function of collapsed objects (e.g. Sheth & Tormen 1999; Jenkins et al 2001; Hu & Kravtsov 2003), currently at the level. Although the very largest simulations (Springel et al. 2005) remain expensive to produce, billion particle models will soon be routine.
Agreement between independent codes with increasing accuracy gives confidence in the reliability of the simulations. The particle Millenium simulation (Springel et al. 2005) which used a Gadget-2 tree code, produced a mass function that agrees to better than with earlier work (Jenkins et al. 2001) employing the Hydra P3M code (Couchman et al. 1995; MacFarland et al 1998). For the virial scaling relation of dark matter halos, agreement among five different N-body simulation codes at the few percent-level is observed (Evrard 2004). We expect space density calibration at the few percent-level or better to be available at the time of survey analysis.
d. Results from an X-ray Cluster Survey - Expected Error Budget
Understanding the dynamical characteristics of dark energy is almost certainly essential to understanding its nature. The survey we discuss will provide remarkably powerful and precise constraints on dark energy dynamics. We have performed detailed forecasts for the uncertainties that will be achieveable on DE parameters, taking into account self–calibration. The cosmological sensitivity is extracted from , the cumulative counts of clusters above a given X–ray flux, and their distribution in redshift (in wide bins), combined with measurements of in wider () bins. Note that represents a unique, exponential sensitivity to DE through a combination of the comoving volume element , and through the growth of fluctuations . The power spectrum contains cosmological information from the intrinsic shape of the transfer function and also from baryon features (Blake & Glazebrook 2003; Seo & Eisenstein 2003, Linder 2003; Hu & Haiman 2003). Baryonic features (“wiggles”) have been included in our analysis using KINKFAST (Corasaniti et al. 2004), a modified version of CMBFAST (Seljak & Zaldarriaga 1996), tailored for time-varying . The wiggles will be detectable at significance in 5 separate redshift bins, varying in width between , each containing clusters. Their use as “standard rods” account for roughly half of the constraints on the DE (Hu & Haiman 2003). The depth of the survey also allows a measurement of the redshift evolution of the normalization, which is an independent, direct assessment of fluctuation growth.
Figure 1 shows the minimum mass of a detectable cluster in the survey, corresponding to the flux limit. At redshifts below , the smallest detectable objects have masses below and we have ignored these objects (small groups, rather than clusters) when deriving our constraints on DE. The X–ray survey will identify all clusters in the high latitude universe with masses above .
The expected redshift distribution (figure 2) has a mean . The survey is shallower than an SZE–selected sample (such as that expected from SPT), and is comparable to a weak–lensing selected sample (such as that expected from LSST). The redshift distribution does have a significant tail out to high redshift, with clusters between . Given precise CMB measurements, the best handle on DE properties is offered by the nearby (indeed, ) clusters. High– clusters, however, significantly improve constraints when CMB data are excluded. This can also be a powerful probe of DE in case its evolution is flatter than expected so that DE already has significant dynamical effects at (to which the CMB data are insensitive). High redshift clusters also allow a measurement of the evolution in the normalization of the power spectrum within a single experiment at the same scale, across the epoch of dark energy domination, thus avoiding any uncertainty in the CMB-normalization and its extrapolation to small scales.
We have utilized the Fisher information matrix to compute expected 1- uncertainties on the DE density (), its present–day equation of state () and its past evolution (). We use (where is the scale factor). Another common convention in the literature is . The uncertainty on would be a factor of two smaller than we quote below111This follows from Taylor-expanding about , the redshift at which cluster survey sensitivity peaks..
We have incorporated 7 additional parameters in our analysis that the cluster data are required to determine simultaneously with the 3 dark energy parameters. These include 4 additional cosmological parameters for the baryon density (), matter density (), and the power spectrum slope () and normalization (). Self–calibration introduces 3 additional non–cosmological parameters, which describe departures from the expected dependence of the X–ray flux on the cluster mass , and redshift . We assume a power–law relation of the form , where is the flux limit, is the luminosity distance, is the virial mass of the cluster, and is the Hubble parameter at redshift .
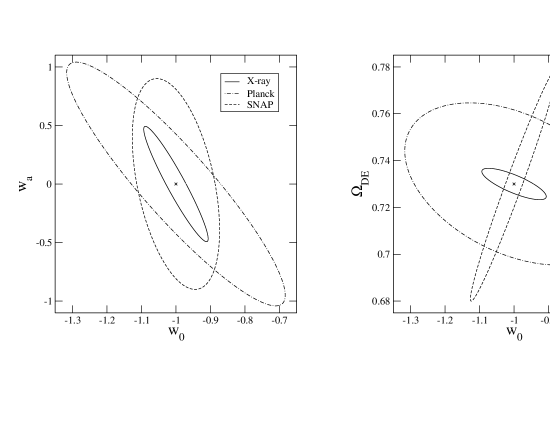
Table 1 summarizes the 1- uncertainties on the dark–energy parameters, marginalized over the uncertainties of all other parameters. The top section summarizes self-calibrated models while the bottom section gives the sensitivity assuming that the mass-observable relationship is reliably known externally. Constraints are evaluated around a spatially flat, vanilla CDM model. The first three rows use the full 10–parameter Fisher matrix, and show that strong constraints can be obtained on the DE properties, including the evolution of the equation of state (1 uncertainty on of 0.49), despite the fact that we are requiring the survey to self–calibrate the mass–flux relation. The 2nd row in the table shows the constraints available by combining the X–ray cluster survey with CMB data. The third row (with ) shows that the X-ray survey is sensitive to models that depart from a pure cosmological constant at the level. We assumed temperature and polarization anisotropy measurements expected to be available from the Planck satellite in three frequency bands (100, 143 and 217 GHz), with fractional sky coverage of (see Rocha et al. 2004 for details). The addition of Planck data pins down the geometry, distances, and power spectrum normalization in the era before the DE dominated, and this further reduces the uncertainty on and by approximately a factor of 2 and 3, respectively. This underscores the complementarity of cluster and CMB data in uncovering the nature of the DE. The parameter degeneracies arising from cluster constraints are highly complementary to those from Type Ia SNe and the CMB (Wang & Steinhardt 1998; Haiman et al. 2001; Holder et al. 2001; Levine et al. 2002), as shown in figure 3.
As mentioned above, our Fisher analysis ignores several other potential cluster observables that contain cosmological information, such as the shape of the X–ray luminosity function, the number-flux relationship, or scaling relations between X–ray and other (SZE, optical) observables. Including this extra information can, in principle, sharply reduce the degradation of the constraints from self-calibration. For reference, the last two rows in Table 1 therefore shows the constraints in a perfect, idealized survey that does not require self–calibration. This corresponds to using a 7–parameter cosmology–only Fisher matrix that assumes that the –mass relation has been calibrated to accuracy (i.e., it assumes the self-calibration parameters are known to precision). The ultimate sensitivity of the X–ray selected cluster sample to the equation of state parameter and its evolution is an impressive 1 uncertainty of 0.01 and 0.066, respectively.
In addition to studying the energy density and equation of state of the DE, the X–ray cluster survey will be the ideal tool to study any clustering of the DE. In any model for the DE other than the cosmological constant, the DE will cluster on large enough scales (approaching the horizon scale). The best hope to detect such clustering is through measuring the integrated Sachs–Wolfe effect in the cross–correlation between CMB anisotropies and the two dimsnsional angular power spectrum of a lower–redshift tracer of the gravitational potential (such as galaxies; Hu & Scranton 2004; Bean & Dore 2004). Note that the effects of the clustering on the CMB power spectrum alone are hidden in cosmic variance. Clusters are as good a tracer as galaxies for this test — the main issues are sky coverage and depth. The number of tracers and their bias is less relevant as long as the cluster power spectrum is also cosmic variance limited. Scaling from the results of Hu & Scranton, we conclude that in the example of a constant =-0.8 model, the clustering of DE (in quintessence, with sound speed =1) is detectable at the 5- level.
Context
e. Risks and Strengths: A large contiguous sample of clusters traces the formation and growth of structure in the universe and is a sensitive probe of DE. An X-ray selected sample of clusters is the most robust way to harvest a cluster sample with high completeness and minimal contamination. An X-ray sample can therefore be expected to reach higher statistical precision before being limited by systematic concerns than other samples. The risk, demonstrated by current small surveys, is that the mass-observable relationship may not be known to sufficient accuracy. However, a proper survey overcomes this limitation by measuring this relationship (self calibration). Our proposal has the very modest risk that the redshifts must be obtained externally. However, the same data required to obtain redshifts will be available for an independent calibration of the mass via weak lensing which is a sensitive probe of total (baryonic plus dark) matter.
f. Technology Readiness: Performing the cluster survey requires no major technology development. A detailed X-ray mirror design (Conconi & Campana 2001) and a prototype mirror shell (Citterio et al. 1999) satisfy the cluster survey mission requirements in table 2. The baseline focal plane is an array of CCD detectors. The underlying technology used for the XMM PN detectors (Meidinger et al. 2002), Chandra ACIS CCDs (Burke et al. 1997; Bautz et al. 2004), or the HETE Soft X-ray Camera (Villasenour et al. 2003) is both flight proven and acceptable. A recent 6 month phase A study for a similar albeit smaller mission (DUO; Griffiths et al. 2004) demonstrated that there are no complicated requirements on the spacecraft or operations. The survey concept is further elaborated in the appendix.
g. Relationship to JDEM and LSST: The X-ray survey is not a precursor to JDEM or LSST. The substantially different parameter degeneracies that result from a cluster survey and the light curves from SNe make these techniques complementary (fig 3).
h. Access to Facilities: The X-ray survey needs access to photometric redshifts which can be determined from observations which are already being planned. Constellation-X observations of high redshift clusters discovered with this mission would provide complementary probes of cosmology and DE (see the Constellation-X white paper submitted to this panel).
i. Timeline: The large contiguous X-ray cluster survey considered here is not currently proposed to NASA. The baseline mission is consistent with the resources (time, mass, volume, and cost) associated with a NASA Medium Explorer mission, and as such could be flown in 2011. Analysis techniques are known and straight-forward.


| Self–Calibrated Experiment(s) | |||
|---|---|---|---|
| X-ray | 0.093 | 0.490 | 0.0067 |
| X-ray + Planck | 0.054 | 0.170 | 0.0052 |
| X-ray + Planckaaassumes constant () | 0.016 | - | 0.0045 |
| Ideal ExperimentbbCorresponds to using a 7–parameter cosmology–only Fisher matrix that assumes that the –mass relation has been calibrated to accuracy (i.e., it effectively assumes the self-calibration parameters are known to precision). | |||
| X-ray | 0.021 | 0.120 | 0.0030 |
| X-ray + Planck | 0.013 | 0.066 | 0.0027 |
| X-ray + Planckaaassumes constant () | 0.0087 | - | 0.0019 |
References
- (1)
- (2) G. Aldering et al. (SNAP collaboration) “Supernova / Acceleration Probe: A Satellite Experiment to Study the Nature of the Dark Energy”, http://arxiv.org/abs/astro-ph/0405232, PASP submitted (2004).
- (3) D. J. Bacon et al., “Numerical simulations of weak lensing measurements”, MNRAS, 325, 1065 (2001).
- (4) M. Bautz et al., “Progress in x-ray CCD sensor performance for the Astro-E2 x-ray imaging spectrometer”, Proc SPIE 5501, 111 (2004).
- (5) R. Bean and O. Dore, “Probing dark energy perturbations: The dark energy equation of state and speed of sound as measured by WMAP”, Phys. Rev. D., 69, 083503 (2004).
- (6) G. M. Bernstein and B. Jain, “Dark Energy Constraints from Weak Lensing Cross-Correlation Cosmography”, ApJ, 600, 17 (2004).
- (7) C. Blake and K. Glazebrook, “Probing Dark Energy Using Baryonic Oscillations in the Galaxy Power Spectrum as a Cosmological Ruler”, ApJ, 594, 665 (2003).
- (8) K. Blindert et al., “Dynamical masses of RCS galaxy clusters”, http://arxiv.org/abs/astro-ph/0404314 (2004).
- (9) G. L. Bryan and M. L. Norman, “Statistical Properties of X-Ray Clusters: Analytic and Numerical Comparisons”, ApJ, 495, 80 (1998).
- (10) B. E. Burke et al., IEEE Trans. Electron Devices, 44, 1633 (1997).
- (11) C. J. Burrows et al., “Optimal grazing incidence optics and its application to wide-field X-ray imaging”, ApJ, 392, 760 (1992).
- (12) M. T. Busha et al., “The Ultimate Halo Mass in a LCDM Universe”, MNRAS submitted, http://arxiv.org/abs/astro-ph/0412161, (2005).
- (13) O. Citterio et al., “X-ray optics for the WFXT telescope”, Proc SPIE 3766, 198 (1999).
- (14) S. Conconi and S. Campana., “Optimization of grazing incidence mirrors and its application to surveying X-ray telescopes”, A&A, 372, 1088 (2001).
- (15) P. S. Corasaniti, M. Kunz, D. Parkinson, E.J. Copeland and B.A. Bassett, “Foundations of observing dark energy dynamics with the Wilkinson Microwave Anisotropy Probe”, Phys. Rev. D 70, 083006 (2004).
- (16) H. M. P. Couchman, P. A. Thomas, and F. R. Pearce, “Hydra: an Adaptive-Mesh Implementation of P 3M-SPH”, ApJ, 452, 797 (1995).
- (17) I. Csabai et al., “The Application of Photometric Redshifts to the SDSS Early Data Release”, AJ, 125, 580 (2003).
- (18) S. Ettori et al., “Scaling laws in X-ray galaxy clusters at redshift between 0.4 and 1.3”, A&A, 417, 13 (2004).
- (19) A. E. Evrard, “An Overview of Growth and Structure”, Carnegie Observatory Astrophysics Series, Vol 3., Clusters of Galaxies: Probes of Cosmological Structure and Galaxy Evolution, http://www.ociw.edu/ociw/symposia/series/symposium3/ms/evrard.ps.gz, (2004).
- (20) A. E. Evrard et al., “Galaxy Clusters in Hubble Volume Simulations: Cosmological Constraints from Sky Survey Populations”, ApJ, 573, 7 (2002).
- (21) A. Gardini and P. M. Ricker, “Simulations of Hot Bubbles in the ICM”, Mod.Phys.Lett. A19, 2317 (2004).
- (22) M. Ghigo et al., “X-ray measurements of a prototype WFXT SiC mirror at the MSFC X-Ray Calibration Facility”, Proc SPIE, 3766, 207 (1999).
- (23) I.M. Gioia, et al., “Cluster Evolution in t he ROSAT North Ecliptic Pole Survey”, ApJL, 553, L105 (2001).
- (24) Z. Haiman, J. J. Mohr and G. P. Holder, “Constraints on Cosmological Parameters from Future Galaxy Cluster Surveys”, ApJ, 553, 545 (2001).
- (25) T. Hamana et al., “Searching for massive clusters in weak lensing surveys”, MNRAS, 350, 893 (2004).
- (26) J. F. Hennawi and D. N. Spergel, “Shear-selected Cluster Cosmology: Tomography and Optimal Filtering”, ApJ, 624, 59 (2005).
- (27) J. P. Henry, “X-Ray Temperatures for the Extended Medium-Sensitivity Survey High-Redshift Cluster Sample: Constraints on Cosmology and the Dark Energy Equation of State”, ApJ, 609, 603 (2004).
- (28) G. P. Holder, Z. Haiman and J. J. Mohr, “Constraints on , , and from Galaxy Cluster Redshift Distributions”, ApJ, 560, L111 (2001).
- (29) B. C. Hsieh et al., “A Photometric Redshift Galaxy Catalog from the Red-Sequence Cluster Survey”, ApJS 158, 161 (2005).
- (30) W. Hu, “Self-consistency and calibration of cluster number count surveys for dark energy”, Phys. Rev. D, 67, 1034 (2003).
- (31) W. Hu and Z. Haiman, “Redshifting rings of power”, Phys. Rev. D, 68, 3004 (2003).
- (32) W. Hu and A. V. Kravtsov, “Sample Variance Considerations for Cluster Surveys”, ApJ, 584, 702 (2003).
- (33) W. Hu and R. Scranton, “Measuring dark energy clustering with CMB-galaxy correlations”, PRD, 70, 123002 (2004).
- (34) R. Griffiths et al. “DUO: the Dark Universe Observatory”, Proc SPIE, 54888, 209 (2004).
- (35) B. Jain, “Magnification Effects as Measures of Large-Scale Structure”, ApJ, 580, 3 (2002).
- (36) A. Jenkins et al., “The mass function of dark matter haloes”, MNRAS, 321, 372 (2001).
- (37) A. D. Kravtsov, D. Nagai, and A. Vikhlinin, “Effects of cooling and star formation on the baryon fractions in clusters”, ApJ, 625, 588 (2005).
- (38) C. Lacey and S. Cole, “Merger rates in hierarchical models of galaxy formation”, MNRAS, 262, 627 (1993).
- (39) E.S. Levine, A.E. Schultz and M. White, “Future Galaxy Cluster Surveys: The Effect of Theory Uncertainty on Constraining Cosmological Parameters”, ApJ, 577, 569 (2002).
- (40) M. Lima and W. Hu, “Self-calibration of cluster dark energy studies: Counts in cells”, Phys. Rev. D, 70, 043504 (2004).
- (41) M. Lima and W. Hu, “Self-Calibration of Cluster Dark Energy Studies: Observable-Mass Distribution”, Phys. Rev. D, submitted, http://arxiv.org/abs/astro-ph/0503363 (2005).
- (42) E. V. Linder, “Cosmic shear with next generation redshift surveys as a cosmological probe”, Phys. Rev. D, 68, 3504 (2003).
- (43) T. MacFarland et al., “A new parallel P3M code for very large-scale cosmological simulations”, New Astronomy, 3, 687, (1998).
- (44) S. Majumdar and J. J. Mohr, “Importance of Cluster Structural Evolution in Using X-Ray and Sunyaev-Zeldovich Effect Galaxy Cluster Surveys to Study Dark Energy”, ApJ, 585, 603 (2003).
- (45) S. Majumdar and J.J. Mohr, “Self-Calibration in Cluster Studies of Dark Energy: Combining the Cluster Redshift Distribution, the Power Spectrum, and Mass Measurements”, ApJ, 613, 41 (2004).
- (46) R. Massey et al., “An enlarged cosmic shear survey with the William Herschel Telescope”, MNRAS, 359, 1277 (2005).
- (47) B. Mathiesen and A. E. Evrard, “Four Measures of the Intracluster Medium Temperature and Their Relation to a Cluster’s Dynamical State”, ApJ, 546, 100 (2001).
- (48) N. Meidinger et al., “Frame store PN-CCD detector for the ROSITA mission”, Proc. SPIE, 4851, 1040 (2002).
- (49) J. J. Mohr, B. Mathiesen, and A. E. Evrard, “Properties of the Intracluster Medium in an Ensemble of Nearby Galaxy Clusters”, ApJ, 517, 627 (1999).
- (50) S.M. Molnar, Z. Haiman, M. Birkinshaw and R.F. Mushotzky, “Constraints on the Energy Content of the Universe from a Combination of Galaxy Cluster Observables”, ApJ, 601, 22 (2004).
- (51) P. M. Motl et al., “The Integrated Sunyaev-Zeldovich Effect as a Superior Method for Measuring the Mass of Clusters of Galaxies”, ApJ, 623, 63 (2005).
- (52) C. Mullis et al., “The 160 Square Degree ROSAT Survey: The Revised Catalog of 201 Clusters with Spectroscopic Redshifts”, ApJ, 594, 154 (2003).
- (53) E. Pierpaoli, S. Borgani, D. Scott, and M. White, “On determining the cluster abundance normalization”, MNRAS, 342, 163 (2003).
- (54) G. Rocha et al., “Measuring alpha in the early Universe: cosmic microwave background polarization, re-ionization and the Fisher matrix analysis”, MNRAS, 352, 20 (2004)
- (55) P. Rosati, S. Borgani, and C. Norman, “The Evolution of X-ray Clusters of Galaxies”, ARAA, 40, 539 (2002).
- (56) P. Rosati et al., “The ROSAT Deep Cluster Survey: The X-Ray Luminosity Function Out to z=0.8”, ApJ, 492, 21 (1998).
- (57) P. Schuecker et al., “The REFLEX galaxy cluster survey. VII. and from cluster abundance and large-scale clustering”, A&A, 402, 53 (2003).
- (58) U. Seljak and M. Zaldarriaga, “A Line-of-Sight Integration Approach to Cosmic Microwave Background Anisotropies”, ApJ, 469, 437 (1996); see also www.cmbfast.org.
- (59) H.-J. Seo and D.J. Eisenstein, “Probing Dark Energy with Baryonic Acoustic Oscillations from Future Large Galaxy Redshift Surveys”, ApJ, 598, 720 (2003).
- (60) R. K. Sheth and G. Tormen, “Large-scale bias and the peak background split”, MNRAS, 308, 119 (1999).
- (61) V. Springel et al., “Simulating the joint evolution of quasars, galaxies and their large-scale distribution”, Nature, in press (2005); http://arxiv.org/abs/astro-ph/0504097
- (62) A. Vikhlinin et al., “A Catalog of 200 Galaxy Clusters Serendipitously Detected in the ROSAT PSPC Pointed Observations”, ApJ, 502, 558 (1998)
- (63) J. Villasenor et al., AIP Conf Proc 662, 33 (2003).
- (64) A. Voevodkin and A. Vikhlinin, “Constraining Amplitude and Slope of the Mass Fluctuation Spectrum Using a Cluster Baryon Mass Function”, ApJ, 601, 610 (2004).
- (65) G. M. Voit, “Tracing cosmic evolution with clusters of galaxies”, Rev. Mod. Phys., 77, 207 (2005).
- (66) S. Wang, J. Khoury, Z. Haiman and M. May, “Constraining the evolution of dark energy with a combination of galaxy cluster observables”, Phys. Rev. D, 70, 123008 (2004).
- (67) L. Wang and P.J. Steinhardt, “Cluster Abundance Constraints for Cosmological Models with a Time-varying, Spatially Inhomogeneous Energy Component with Negative Pressure”, ApJ, 508, 483 (1998).
- (68) M. White, “The redshift-space power spectrum in the halo model”, MNRAS, 321, 1 (2001).
Appendix - Technical Implementation
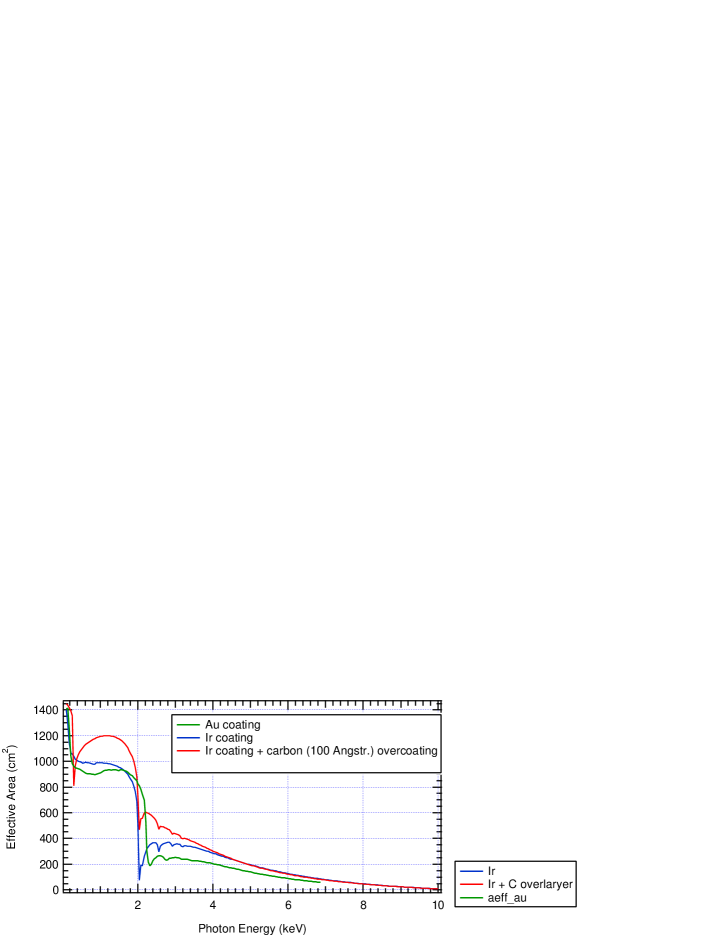
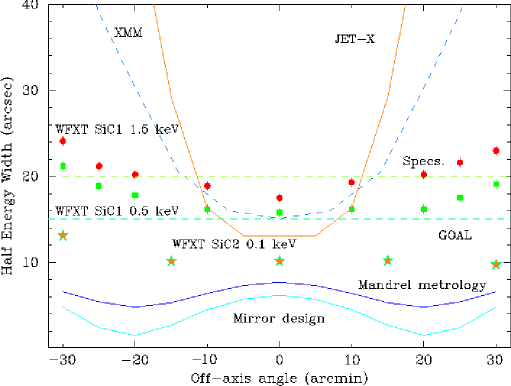
The key technical requirement for our survey is to obtain a sufficiently large grasp with sufficient angular resolution to distinguish clusters from point sources throughout the field of view. The requirements listed in Table 1 are met, for example, by a pair of Wide Field X-ray Telescopes (WFXT) based on a modified Wolter/Giacconi design that provides a high angular resolution of arcsec HEW over a very large field of view of deg2 which could be accomodated in a NASA Medium Explorer mission of 2 year duration. To achieve the best design, we expand the mirror profiles in 2nd order polynomials along the optical axis (Burrows et al. 1992, Conconi & Campana 2000). The X-ray telescopes consist of 50 nested grazing incidence mirror shells each, with diameters ranging from 21 to 70 cm and a focal length of 3.5 m. The total mirror height is 28 cm. The telescopes have effective area for various coatings is shown in figure 4. Possible technologies for high-performance high-throughput wide-field X-ray telescopes are ceramics, i.e. Silicon Carbide (SiC), or thin thermally-formed glass segments. The feasibility of large wide-field SiC mirror shells has already been demonstrated by constructing two ceramic prototype shells of 60 cm diameter at OAB/Zeiss. The mirror shells have already been tested at the MPE/Panter and NASA/Marshall X-ray facilities showing imaging performance around 10-20 arcsec across a 60 arcmin field of view (Citterio et al. 1999; Ghigo et al. 1999) as shown in figure 5. The measured performance is best at the lowest energies; the degraded psf at higher energies is understood, and is a consequence of increased roughness on a replication mandrel which had been used many times. Repolishing the mandrel has resulted in significant improvement, although measurements have only been made on-axis to date. The slumped glass technology is being developed in the US and in Europe in the context of the Con-X/XEUS mission.
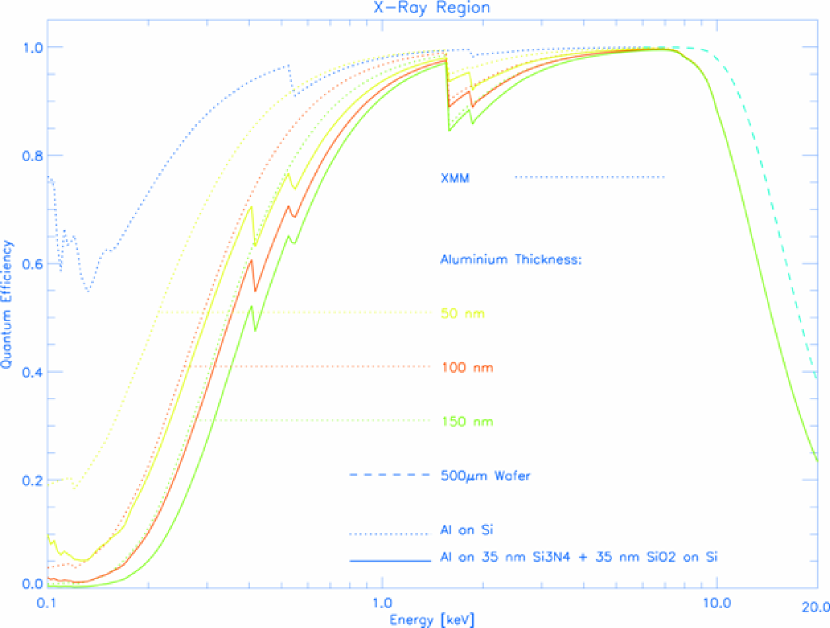
Current state-of-the-art, back-illuminated X-ray CCD technology is fully capable of meeting the focal-plane instrument requirements of our survey. Examples include pn-CCD detectors based on the XMM-Newton and DUO/ROSITA heritage, and back-illuminated Astro-E2 detectors with Chandra/ACIS and HETE II heritage. Individual detectors would be mounted in an inverted pyramid to best conform to the optimal focal surface, as has been done for both Chandra/ACIS and XMM-Newton/EPIC. The energy resolution and readout speed capabilities of the current generation of detectors, which can be operated at -40 to -60 deg C, are significantly better than those flown on Chandra and XMM-Newton. Directly-deposited optical blocking filters have been demonstrated for these detectors, allowing very thin dead layers and unprecedented quantum efficiencies across the 0.1-15 keV band. For example, the quantum efficiency of the 450-m-thick, back-illuminated pn-CCD with a thin, directly deposited aluminum/SiO blocking layer, is shown in figure 6.
For our sensitivity calculations we assume a 5 keV cluster at z=0.5. The energy conversion factor (table 2) assumes net (telescope plus detector) effective area of 670 cm2 and 55 cm2 at 1.5 keV and 8 keV. We propose a wide survey covering the whole extragalactic sky (20,000 deg2) reaching a cluster flux limit of in the 0.5–2 keV band. We expect to detect 100,000 clusters with the redshift distribution shown in figure 2. With 50 or more photons per cluster and a point spread function better than 20 arcsec HEW we are able to separate clusters from point sources out to redshifts of 1.5 finding more than 90% of clusters. Completeness rises rapidly above this threshold while contamination (false clusters due to the superposition of point sources) is estimated to be .
Other focal plane implementations, such as new developments in cryogenic, large format spectroscopic arrays, could broaden the scientific scope of this mission by providing the capability to survey the large scale structure of the universe by tracing the structure of the Warm/Hot Intergalactic Medium, and by providing for many of the brighter clusters, independent X-ray derived redshifts. Such capabilities, which are being independently developed for future observatories, are not required for the baseline mission described here.
| focal length | 350 | cm |
| Number of telescopes | 2 | |
| On-axis effective area (@ 1 keV) | cm2 | |
| Field of view | 1.4 | deg2 |
| Vignetting factor | 0.5 | |
| Grasp (total for 2 telescopes) | 940 | cm2 deg2 |
| PSF HEWaaPoint Spread Function Half Energy Width (current) | 20 | arcsec |
| PSF HEW (goal) | 15 | arcsec |
| ECF bbEnergy Conversion Factor ct s-1(0.5 – 10 keV)/erg (0.5 – 2 keV) cm-2 s-1 per 10-11 (cgs) cluster | 7.9 | ct sec-1 |
| sensitivity | (0.5 – 2 keV) | |
| Cluster surface density | 5.1 | deg-2 |
| Exposure time per pointing | 2700 | sec |
| Number of pointings | 14,000 | |
| Solid angle | 20,000 | deg2 |
| Number of clusters | 100,000 | |
| Mission duration | 2 | year |
| Observing efficiency | 0.60 |