The VLT-UVES survey for molecular hydrogen in high-redshift damped Lyman- systems: Physical conditions in the neutral gas
Abstract
We study the physical conditions in damped Lyman- systems (DLAs), using a sample of 33 systems toward 26 QSOs acquired for a recently completed survey of H2 by Ledoux et al. (2003). We use the column densities of H2 in different rotational levels, together with those of C i, C i∗, C i∗∗, C ii∗ and singly ionized atomic species to discuss the kinetic temperature, the density of hydrogen and the electronic density in the gas together with the ambient UV radiation field. Detailed comparisons are made between the observed properties in DLAs, the interstellar medium (ISM) of the Galaxy, the large and small Magellanic clouds (LMC and SMC).
The mean kinetic temperature of the gas corresponding to DLA subcomponents in which H2 absorption line is detected, derived from the ortho-to-para ratio (15378 K), is higher than that measured in the ISM (77 K) and the Magellanic clouds (8221 K). Typical pressure in these components (corresponding to = 100300 K and = 10200 cm-3), measured using C i fine-structure excitation, are higher than what is measured along ISM sightlines. This is consistent with the corresponding higher values for (H2,J=2)/(H2,J=0) seen in DLAs. From the column densities of the high-J rotational levels, we derive that the typical radiation field in the H2 bearing components is of the order of or slightly higher than the mean UV field in the Galactic ISM. Determination of electron density in the gas with H2 and C i show the ionization rate is similar to that of a cold neutral medium (CNM) in a moderate radiation field. This, together with the fact that we see H2 in 13-20% of the DLAs, can be used to conclude that DLAs at could contribute as much as 50% star formation rate density seen in Lyman break galaxies (LBGs).
C ii∗ absorption line is detected in all the components where H2 absorption line is seen. The excitation of C ii in these systems is consistent with the physical parameters derived from the excitation of H2 and C i. We detect C ii∗ in about 50% of the DLAs and therefore in a considerable fraction of DLAs that do not show H2. In part of the later systems, physical conditions could be similar to that in the CNM gas of the Galaxy. However, the absence of C i absorption line and the presence of Al iii absorption lines with a profile similar to the profiles of singly ionized species suggest an appreciable contribution from warm (WNM) and/or partially ionized gas. The absence of H2, for the level of metallicity and dust depletion seen in these systems, are consistent with low densities (i.e nH 1 cm-3) for a radiation field similar to the mean Galactic UV field.
keywords:
Cosmology: observations – Galaxies: halos – Galaxies: ISM – Quasars: absorption lines1 Introduction
Damped Ly- (DLA) systems seen in QSO spectra are characterized by very large neutral hydrogen column densities: H i cm-2. Such an amount of neutral gas is usually measured through local spiral disks. The case for DLA systems to arise through proto-galactic disks is further supported by the fact that the cosmological density of the absorbing gas at is of the same order of magnitude as the cosmological density of stars at present epochs (Wolfe 1995). Moreover, the presence of heavy elements () suggests that DLAs are located in over-dense regions where star formation activity takes place (Pettini et al. 1997) and at low and intermediate redshifts strong metal line systems and DLAs have been demonstrated to be associated with galaxies (e.g. Bergeron & Boissé, 1991; Le Brun et al. 1997). It has also been shown that the profiles of the lines arising in the neutral gas show evidence for rotation (e.g. Prochaska & Wolfe 1997). However, hydrodynamical simulations have shown that the high redshift progenitors of present-day galactic disks could look like an aggregate of well separated dense clumps. In fact, the kinematics seen in the absorption line profiles of DLAs could be explained by relative motions of the clumps with little rotation (Haehnelt et al. 1998; Ledoux et al. 1998).
Studying the star-formation activities in DLAs is very important for the understanding of galaxy formation in the Universe. Recently, Wolfe et al. (2003a, 2003b, 2004) have shown that, even if DLAs sustain only a moderate star-formation activity, they will contribute appreciably to the global star-formation rate (SFR) density at high redshifts. The SFR in DLAs can be estimated either by detecting the galaxies responsible for DLAs or by inferring the intensity of the UV field in DLAs using the induced excitation of atomic and molecular species. In the latter case, it is important to have a clear understanding of the physical conditions in the gas to derive an accurate estimate of the SFR. In the case of the Galactic ISM, rotational excitations of H2 (see Browning et al. 2002 and references there in) and fine-structure excitations of C i, C ii, O i and Si ii are used to derive the physical state of the absorbing gas (see for example Welty et al. 1999). Detecting and studying these transitions in DLAs is the first step toward understanding the physical conditions and hence the star-formation activity in DLAs.
Molecular hydrogen is ubiquitous in the neutral phase of the interstellar medium (ISM) of galaxies. Formation of H2 is expected on the surface of dust grains, if the gas is cool, dense and mostly neutral, and from the formation of H- ions if the gas is warm and dust-free (see e.g. Jenkins & Peimbert 1997; Cazaux & Tielens 2002). As the former process is most likely dominant in the neutral gas associated with DLA systems, it is possible to obtain an indirect indication of the dust content in DLAs without depending on extinction and/or heavy element depletion effects. Moreover, by determining the populations of different H2 rotational levels, it is possible to constrain kinetic and rotational excitation temperatures and particle densities. Effective photo-dissociation of H2 takes place in the energy range eV through Lyman- and Werner-band absorption lines and the intensity of the local UV radiation field can therefore be derived from the observed molecular fraction. A direct determination of the local radiation field could have important implications in bridging the link between DLA systems and star-formation activity at high redshifts.
We have searched for molecular hydrogen in DLA and sub-DLA systems at high redshift (), using UVES at the VLT down to a detection limit of typically H cm-2 (see Ledoux et al. 2003). Out of the 33 systems in our sample, 8 have firm and 2 have tentative detections of associated H2 absorption lines. In all of the systems, we measured metallicities relative to Solar, [X/H] (with either XZn, or S, or Si), and depletion factors of iron, [X/Fe], supposedly onto dust grains. Although H2 molecules are detected in systems with depletion factor, [Zn/Fe], as low as 0.3, the systems where H2 is detected are usually amongst those with the highest metallicities and depletion factors. In particular, H2 is detected in the three systems with the largest depletion factors. Moreover, in two different systems, one of the H2-detected components has [Zn/Fe. This directly demonstrates that a large amount of dust is present in the components where H2 is detected. The mean H2 molecular fraction, HHH i, in DLA systems is generally small (typically ) and similar to what is observed in the Magellanic Clouds. There is no correlation between the amount of molecules and the neutral hydrogen column density; in particular, two systems where H2 is detected have H i. Approximately 50 percent of the systems have : this is probably a consequence of a reduced formation rate of H2 onto dust grains (probably because the gas is warm, K) and/or of an enhanced ionizing flux relative to what is observed in our Galaxy.
In this work, we present additional high S/N ratio data on three of the DLA systems in which H2 is detected and the results of multi-component Voigt profile fits to neutral and singly ionized species (including C i, C i∗ and C ii∗) in all the DLAs in our sample. We estimate the range of physical conditions in the neutral gas using standard techniques that are used in ISM studies. The paper is organized as follows. In Section 2, we give the details of the additional data and present the new fits to the H2 absorption lines in the corresponding three systems. In Section 3, we discuss the relative populations of different H2 rotational levels deriving information on the physical state of the gas by comparing the DLA observations with Galactic ISM, SMC, and LMC data. In Sections 4 and 5 we discuss, respectively, the fine-structure excitation of C i and the ionization state of Carbon. In Section 6 we study the C ii∗ excitation in detail. Finally, we summarize our results and discuss various implications of the overall study in Section 7.
2 Data sample
| QSO | J | (cm-2) | (km s-1) | |
|---|---|---|---|---|
| Q | 2.59471 | 0 | 17.65 | 1.50.5 |
| 1 | 17.97 | |||
| 2 | 15.93 | |||
| 3 | 14.81 | |||
| 4 | ||||
| 2.59486 | 0 | 15.13 | 1.10.1 | |
| 1 | 15.24 | |||
| 2 | 14.00 | |||
| 3 | 13.93 | |||
| 4 | ||||
| Q | 2.81100 | 0 | 17.29 | 2.80.5 |
| 1 | 17.78 | |||
| 2 | 16.74 | |||
| 3 | 15.68 | |||
| 4 | 14.13 | |||
| 5 | 13.68 | |||
| 2.81112 | 0 | 17.24 | 1.00.3 | |
| 1 | 17.68 | |||
| 2 | 16.98 | |||
| 3 | 16.58 | |||
| 4 | 14.32 | |||
| 5 | 13.58 | |||
| Q | 2.33772 | 0 | 19.34 | 4.50.5 |
| 1 | 19.17 | |||
| 2 | 16.70 | |||
| 3 | 16.90 | |||
| 4 | 14.68 | |||
| 5 | 14.45 |
The Ultraviolet and Visible Echelle Spectrograph (UVES; Dekker et al. 2000), installed at the ESO VLT 8.2-m telescope unit Kueyen on Mount Paranal in Chile was used to search for H2 in a large sample of DLAs. The sample and data reduction procedure are described in detail in Ledoux et al. (2003). Observations and details of Voigt profile analysis of H2 and metal line absorption lines toward Q 0013004, Q 0551366 and Q 1232082, along the lines of sight of which H2 is detected, are described in, respectively, Petitjean et al. (2002), Ledoux et al. (2002) and Srianand et al. (2000). The Voigt profile fits to H2 and other metal lines at = 3.024 toward Q , = 2.595 toward Q and = 2.0868 toward Q are discussed in Ledoux et al. (2003). For systems in which H2 is not detected, Ledoux et al. (2003) have provided upper limits on (H2) together with mean metallicities and depletion factors.
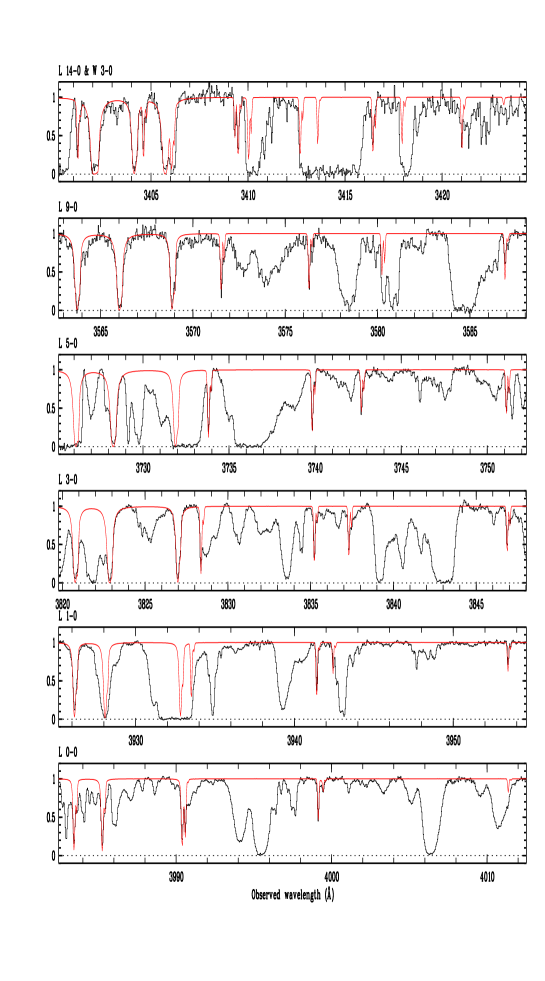
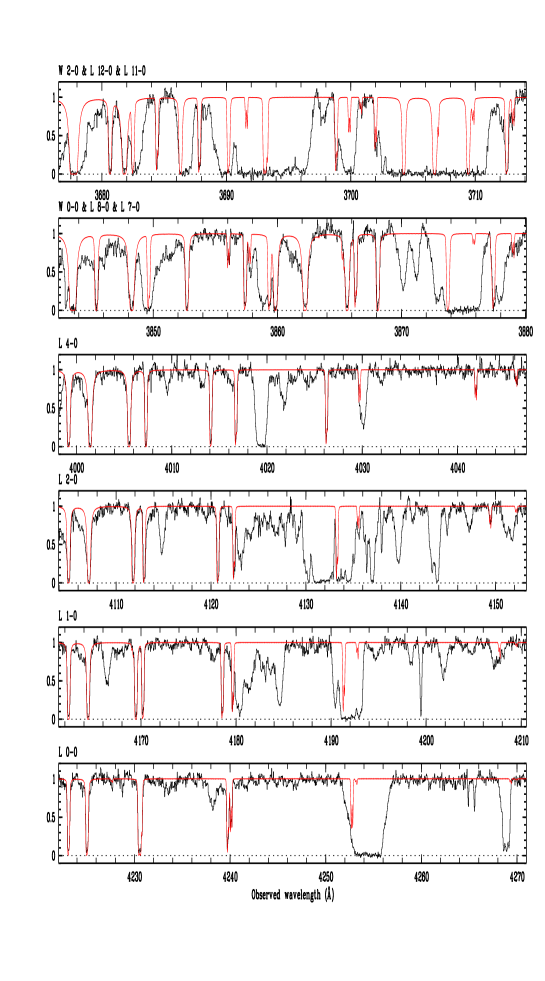
Recently, we have obtained additional higher spectral resolution spectra ( 55,000) of Q 0347383 and Q as a part of our ongoing programme on cosmic variation of the electron-to-proton mass ratio (Petitjean et al. 2004). Nine exposures of 1.5 h each were taken for each of the quasars over six nights under sub-arcsec seeing conditions in January 2002 and 2003 for Q 0347383 and Q , respectively. We have also obtained additional data of Q 1232082 to study the HD lines that are detected in the DLA (Varshalovich et al. 2002). Spectra were reduced using the UVES pipeline and addition of individual exposures were performed using a sliding window and weighting the signal by the errors in each pixel. We detect a new H2 component at = 2.59486 toward Q 0405443 in addition to the strong component reported in Ledoux et al. (2003). We also present Voigt profile fits to the H2 lines in the = 2.811 system toward Q . The single H2 component seen in the lower spectral resolution CASPEC spectrum (Srianand & Petitjean 1998) is resolved into two distinct components in our new UVES spectra. For both these systems the Voigt profile fits to the H2 Lyman and Werner band absorption lines are shown in Fig. 1 and resulting parameters are summarised in Table 1. This Table also gives the results of Voigt profile fits to H2 for the = 2.33772 toward Q 1232082.
The main purpose of this paper is to provide a detail account of C i, C ii∗ and other metal lines in DLAs of our sample and extract physical conditions in conjunction with the H2 content reported in Ledoux et al. (2003). For the = 2.139 system toward Tol 1037014 and the = 3.350 system toward Q , we use the results presented in Srianand & Petitjean (2001) and Péroux et al. (2002) respectively. For the rest of the systems we give here the results of the multicomponent Voigt profile fits. For this we use a Voigt-profile fitting code that determines the best fitting parameters (column density, velocity dispersion and redshift) using minimization techniques (Chand et al. 2004). We use the oscillator strengths compiled in Table 1 of Ledoux et al. (2003) for metal ions and those given by Morton & Dinerstein (1976) for H2. In this article, we measure metallicities relative to Solar, [X/HXHXH, with either XZn, or S, or Si, and depletion factors of iron, [X/FeXFeXFe, adopting the Solar abundances from Savage & Sembach (1996).
| QSO | log (H i)a | log (H2) | (K) | (K) | (K) | OPR | (OPR) (K) | |
|---|---|---|---|---|---|---|---|---|
| Q | 1.96685 | 20.83(0.05) | 16.38 | 300 | 766 | 395 | 1.850.28 | 114 |
| 1.96822 | 16.54 | 73 | 302 | 519 | 0.640.09 | 66 | ||
| Q | 3.02489 | 20.73(0.05) | 14.55 | … | 740 | 558 | 3.450.47 | |
| Q | 2.59471 | 21.05(0.10) | 18.14 | 121 | 101 | 104 | 2.100.30 | 127 |
| 2.59486 | 15.51 | 91 | 118 | 219 | 1.340.17 | 93 | ||
| Q | 2.81100 | 21.35(0.07) | 17.93 | 167 | 190 | 156 | 2.470.36 | 152 |
| 2.81112 | 17.90 | 138 | 238 | 278 | 1.830.33 | |||
| Q | 1.96168 | 20.70(0.08) | 15.64 | 76 | 248 | 401 | 0.900.16 | 76 |
| 1.96214 | 17.40 | 175 | 326 | 446 | 1.740.72 | 108 | ||
| 1.96221 | 15.58 | 154 | 415 | 593 | 1.860.23 | 115 | ||
| Q | 2.33772 | 20.90(0.08) | 19.57 | 67 | 67 | 148 | ||
| Q | 2.08680 | 20.25(0.07) | 16.49 | 285 | 205 | 196 | 3.590.42 | |
| 2.08696 | 18.15 | 193 | 148 | 120 | 3.200.28 | |||
| Note: The = 1.97296 and 1.97380 components toward Q 0013004 are not considered here as the H2 column densities | ||||||||
| of the J = 0 and J = 1 levels are not known accurately due to saturation effects (see Petitjean et al. 2002) | ||||||||
| a Integrated H i column density in all the components (with and without H2). | ||||||||
3 Determination of physical parameters using H2 level population
In this section, we estimate different physical parameters from the column densities of H2 in different J rotational levels.
3.1 Kinetic temperature of the gas
It is a standard procedure, in ISM studies, to use the ortho-to-para ratio (OPR) to infer the kinetic temperature of the gas assuming local thermodynamic equilibrium, LTE (Tumlinson et al. 2002, and references there in). Indeed, recent numerical investigations suggest that the OPR is a good tracer of the kinetic temperature over large regions of the parameter space (Shaw et al. 2004). For completeness, we first review our understanding of the OPR and outline the method for deriving the kinetic temperature before applying the method to the data.
3.1.1 General outline
As the interconversion between para and ortho states involves a spin flip, it is not allowed for processes involving an isolated molecule (i.e., radiative processes cannot induce interconversion). Ortho/para interconversion is only possible through (i) spin exchange induced by collisions with protons (with a rate coefficient in the range ; see Dalgarno, Black & Weisheit 1973; Flower & Watt 1984 and Gerlich 1990) or with hydrogen atoms (with a rate coefficient an order of magnitude less than that of protons; Mandy & Martin 1993; Tiné et al. 1997) and (ii) reactions on the surface of dust grains (Le Bourlot 2000). In the case of local thermodynamic equilibrium (LTE),
| (1) |
where, J, is the rotational quantum number, is the rotational constant of H2 ( = 85.3 K), and is either the kinetic temperature of the gas (when OPR is governed by spin-exchange collisions) or the formation temperature (when OPR is governed by H2 formation on the surface of dust grains with LTE distribution characterized by the formation temperature ; see Sternberg & Neufeld 1999; Takahashi 2001). The equilibrium temperature, T(OPR), can be obtained using the observed value of OPR and Eq. 1. This will trace the kinetic temperature of the gas if spin-exchange collisions are mainly responsible for the observed OPR.
If the gas is dense and cold and if most of the H2 molecules are in the J = 0 and J = 1 levels then,
| (2) |
In the case of very optically thick molecular gas for which there is enough self-shielding, the (J=1)/(J=0) ratio can be maintained at its Boltzmann value and the excitation temperature, , equals the kinetic temperature. Savage et al. (1977) measured a mean excitation temperature, T01 = 7717 K, for the galactic ISM. This is consistent with the mean temperature of the ISM measured using 21 cm absorption lines. Thus it is widely believed that when there is sufficient shielding (i.e log (H2) cm-2 16.5), is a reasonably good tracer of the kinetic temperature. This is because in the shielded region, H2 photodissociation time-scale can be larger than the time-scale for charge exchange collision (Flower & Watt, 1984). Also a recent multi-wavelength study of Galactic sightlines show the T01 measured in optically think cases closely follow the spin temperature measured from 21 cm observations (see Roy et al 2005).
The excitation temperature, , between different rotational levels (say J= i and j) of a given species (either ortho or para H2) can be obtained using,
| (3) |
Unlike OPR, this ratio can be altered by radiation pumping and formation pumping in addition to collisions. If collisions dominate the rotational excitation then will be equal to T(OPR). Presence of formation pumping and/or UV pumping will make . In the following section we discuss various temperature estimates from the DLA sample.
3.1.2 Kinetic temperature of the H2 components
In our sample, H2 is only detected in J levels of the vibrational ground state. Thus we compute the OPR by summing the H2 column densities for levels with J 5. The observed value of the OPR for each DLA is given in column #8 of Table 2. We calculate T(OPR) from the measured OPR for individual systems using Eq. 1(see column #9 of Table 2). When the kinetic temperature (or formation temperature) is high (i.e., K) the OPR reaches 3, the value expected based on spin statistics. For a kinetic temperature similar to that seen in the cold neutral medium of our Galaxy ( 80 K) the expected OPR under LTE assumption is less than 1. From Table 2, it is clear that the LTE temperatures measured from the OPR for DLAs are most of the times higher than 80 K (the mean found in the Galactic ISM.)
In Fig. LABEL:fig2 we plot the observed values of the OPR against the total H2 column density in the ISM (triangles), LMC (squares), SMC (asterisks) and DLAs (circles with error-bars). It is apparent that most of the OPR values in DLAs are significantly different from 3 (see also column #8 of Table 2). The distribution of the OPR as a function of (H2) in DLAs is consistent with that observed along Galaxy, LMC and SMC sightlines (see Fig. LABEL:fig2) when N(H2)16 and for rest of the components OPR in DLAs are systematically higher than that measured in the Galaxy, LMC and SMC. For example, OPR 3 is seen only along sightlines with low H2 optical depth (i.e (H2) ) in the Galaxy, LMC and SMC (see Fig. LABEL:fig2). On the contrary, out of the three DLA components with OPR , two, at = 2.08680 and = 2.08692 toward Q 1444+014, are optically thick in the Lyman band absorption lines.
We next investigate the dependence of (measured using Eq. 2) on the total H2 column density (see Fig LABEL:figext). Individual values measured in DLAs are listed in Table 2 (see column #5). The large errors on both (H2) and are mostly a consequence of the difficulty to measure the Doppler parameter when the lines are saturated. In the case of the = 1.96685 component toward Q the uncertainty is a consequence of line blending (see Petitjean et al. 2002). The vertical dotted lines show the mean and 1 range of measured by Savage et al. (1977). The data points from the Magellanic clouds (Tumlinson et al. 2002) are consistent with this range (mean K). As in the case of the OPR, most of the measurements from DLAs with optically thick H2 (i.e log N(H2)) are well separated from that of the ISM and Magellanic clouds (Fig. LABEL:figext) and the spread seen in the optically thin case is consistent with that seen in local ISM. Note that the system with lowest molecular content (= 3.02489 toward ) has (J=0) an order of magnitude lower than (J =1). can not be computed in this case as the maximum expected column density ratio, (J=1)/(J=2), is 9 under LTE conditions (see Eq. 2). For the high optical depth clouds (i.e, log (H2) cm-2 16.5) in DLAs the mean is 15378 K. In most of the components the two temperatures and (OPR) are consistent within errors. This is mainly because most of the H2 molecules reside in the ground states.
In summary, if we assume LTE then (OPR) and measured in DLAs (with log N(H2)16.5) at high redshift are on an average higher than that measured in the ISM, LMC and SMC sightlines. In this high N(H2) range is expected to trace the kinetic temperature. However, in the case of optically thin systems the (OPR) (or ) measured in DLAs are consistent with that measured in LMC, SMC and Galactic sightlines. Under the LTE assumption we find that H2 components in DLAs have kinetic temperatures in the range 100200 K.
3.2 Rotational excitation
The rotational level populations are affected by particle collisions, UV pumping, and formation pumping. While the collisional excitation plays a significant role in populating the low-J levels, those with J3 are usually populated by formation processes and UV pumping. In what follows, we discuss the excitation of H2 as seen in DLAs and compare with ISM, LMC and SMC sightlines.
3.2.1 Low-J excitation
The collisional contribution to the excitation of H2 can be investigated by studying the (J=2)/(J=0) and (J=3)/(J=1) ratios. In general J = 2 and J = 3 levels can also be populated by deexcitation of H2 formed in the high-J states (usually referred to as formation pumping) or through UV pumping. The collisional excitation rate for the J=02 transition is about an order of magnitude higher than that of the J=13 transition for kinetic temperatures in the range 100 to 300 K (Forrey et al. 1997). The spontaneous decay rate from J = 3 is an order of magnitude smaller that from J = 2. This means that the ground and first excited states of para-H2 can be thermalised at lower densities compared to that of ortho-H2. In Fig. LABEL:h2col, we plot as a function of temperature the critical hydrogen density for which the collisional deexcitation rate becomes equal to the spontaneous decay rate for the J=2J=0 transition. It is clear from this figure that the hydrogen density has to be high (in the range 60175 cm-3) in order for the (J=2)/(J=0) ratio to be equal to the LTE value corresponding to typical kinetic temperatures inferred from the OPR (i.e 100 to 300 K).
In Fig. LABEL:fig3 we plot the ratio, (J=2)/(J=0), observed in DLAs, the Galaxy, LMC and SMC as a function of the total H2 column density. The vertical dotted lines in the figure shows the expected values of the ratio for four different excitation temperatures assuming LTE. Values of the excitation temperature for individual DLA H2 components obtained using Eq. 3 are given in Table 2. The observed excitation temperatures are in the range 100 to 600 K with most of them at K. If the level populations are in LTE then the required hydrogen density to maintain the equilibrium is cm-3 (see Fig. LABEL:h2col). We can see from Fig. LABEL:fig3 that in DLAs where H2 is optically thick, the (J=2)/(J=0) ratio is larger than that seen in similar gas of the Galactic ISM, LMC and SMC. It can be seen from Table 2 that, in most of the DLAs, is lower than or equal to (see Table 2). This is very much the case as well in most of the sightlines through the ISM and Magellanic clouds. It is well known that, due to a lower value of the Einstein coefficient of the J = 2 level compared to those of higher J levels, the UV and formation pumping processes can lead to enhancing the J = 2 level compared to the J = 0 level. Thus the higher values of (J=2)/(J=0) seen in DLAs can be explained by higher pressure in the gas and/or higher radiation field.
Fig. LABEL:fig4 gives the (J=3)/(J=1) ratio as a function of (H2). The vertical dotted lines in the figure shows the expected value of the ratio for four different excitation temperatures under the LTE assumption. The measurements in DLAs are consistent with local measurements and the excitation temperature is in the range 100680 K (see Table 2).
In Fig. LABEL:fig4a we plot the (J=3)/(J=1) ratio versus the (J=2)/(J=0) ratio. If formation and UV pumping contribute appreciably to populate the J = 2 and J = 3 levels then we expect a tight relationship between the two quantities. The dotted line in the figure gives the expected relationship between the ratios under LTE. In the case of sightlines through the Galactic ISM, the LMC or SMC, the (J=3)/(J=1) ratio is higher than what is expected from the (J=2)/(J=0) value under LTE (or, is higher than ). In the case of DLAs, most of the components have close to (points are on top of the dotted line). Note that these excitation temperatures are different from . This clearly means that UV pumping and formation pumping are not negligible even for the excitation of the low J levels. The nature of the local radiation field can be probed using excitations of J 3 levels. This is what we do in the following Section.
3.2.2 UV radiation field: High-J excitation
It is known that in the photodissociation regions (PDRs) the J = 4 and J = 5 rotational levels are populated predominantly by cascades following the formation of excited molecules and UV pumping from the low-J states. As radiative decay time-scales for these levels are very short compared to the collisional time-scales, spontaneous decay is the main deexitation process. Among the two populating processes the UV pumping is an optical depth dependent process while the formation pumping is independent of optical depth. In an optically thick cloud, UV pumping is efficient in a thin shell surrounding the cloud. In the interior of the cloud, UV pumping becomes important only when the column density becomes very large (i.e. through absorption in the damping wings).
In Fig. LABEL:fig6 we plot log (H2) as a function of log (J=4)/(J=0) as measured in DLAs and along the ISM, LMC and SMC sightlines. As expected, a strong anti-correlation is present in the data, including DLAs. H2 absorption lines in DLA systems have no strong overlapping wings. Therefore the high-J excitation is mostly due to photo-absorption in the systems with log (H2) 16.5 and to H2 formation in the systems with higher column densities. Following analytic prescription by Jura (1975) we can write,
| (4) |
Here, , are, respectively, the photo-absorption rate in the Lyman and Werner bands and the pumping efficiency from J = 0 to J = 4; is the spontaneous transition probability between J = 4 and J = 2 and is the formation rate of H2. Neglecting the second term in the left hand side of Eq. 4 leads to a conservative upper limit on the UV radiation field. The vertical dashed lines in Fig. LABEL:fig6 represent the corresponding predicted values of the (J=4)/(J=1) ratio for s-1 (that is, approximatively the mean radiation field in the ISM) and s-1. It can be seen from Fig. LABEL:fig6 that for log (H2) less than 16.5 the (J=4)/(J=0) ratio in DLAs is of the order of or slightly higher than that seen in the ISM of our Galaxy. Quantitatively the upper limits in most of the systems are consistent with s-1. This probably means the optically thin H2 components without detectable H2 absorption lines from the J = 4 state arise in gas embedded in a UV field with intensity similar to (or slightly higher than) that of the mean ISM field.
There are two optically thin components in our sample (= 1.96822 toward Q 0013004 and 3.02489 toward Q 0347383) that show detectable J = 4 H2 absorption lines. Detailed analysis of these component suggests an ambient field intensity consistent with few times the mean ISM field intensity (Petitjean et al. 2002; Levshakov et al. 2002). The same conclusion was derived by Reimers et al. (2003) for the optically thin H2 component at = 1.15 system toward HE .
The above ratio has similar values at high log (H2) in DLAs and in our Galaxy. This is a hint for the formation pumping in DLAs with high (H2) being similar to the local one. There are two optically thick components (at = 2.59471 toward Q 0405443 and = 2.08696 toward Q 1444014) that do not show detectable absorption lines from the J = 4 state. In the latter system the ratio (J=4)/(J=0). This is much lower than the values seen in the ISM at similar total (H2) and could be a consequence of lower H2 formation rate in this system. High values of the radiation field intensity were inferred for some of the optically thick components when the contribution of the second term in Eq. 4 is estimated using the average metallicity and dust depletion (Ge & Bechtold 1997; Petitjean et al. 2000; Ge, Bechtold & Kulkarni 2001).
4 Analysis of Carbon absorption lines
As the ionization potential of C i is 11.2 eV, the ionization state of Carbon is sensitive to the same photons that destroy H2. Therefore, C i is usually a good tracer of the physical conditions in the molecular gas (see however Srianand & Petitjean 1998). In what follows we investigate the relationship between the detectability of C i absorption line and other measurable quantities in our spectra. We derive additional constraints on the physical conditions in DLAs using C i fine-structure absorption lines.
4.1 Detectability of C i absorption lines
The results of simultaneous Voigt profile fitting to C i, C i∗ and C i∗∗ absorption lines in our sample are summarised in Table 3.
In the interstellar medium of our Galaxy, all clouds with log (H i) have log (H2) and log (C i) (Jenkins & Shaya 1979; Jenkins, Jura & Loewenstein 1983). In our sample, C i absorption lines are detected in most of the DLAs that show H2 absorption lines(see also Ge & Bechtold 1999). There are three exceptions: the components at = 2.59471 and 2.59486 toward Q 0405443 and at = 2.81100 toward PKS 0528250. These C i non-detections are surprising as the H2 absorption lines from these components are optically thick so that C i is expected to be conspicuous.
Usually, DLAs in which no H2 is detected through the whole profile do not show any detectable C i absorption line (with a typical upper limit of 1012 cm-2). The only exception is the high-metallicity sub-DLA at = 2.139 toward Tol 1037270 (see Srianand & Petitjean 2001). On the contrary, in DLAs where H2 is detected, some components show detectable C i absorption line without detectable molecular absorption ((H2)cm-2). This is the case in Q 0013004 (Petitjean et al. 2002) and Q 0551366 (Ledoux et al. 2002).
Note that C i is also detected at = 2.28749 toward Q 2332094 but the presence of H2 molecules can not be probed in this system due to the presence of an intervening Lyman limit system. The sub-DLA at = 1.15 toward HE 05154414 shows C i and H2 absorption lines (Quast et al. 2002; Reimers et al. 2003). C i absorption lines have also been detected at = 1.776 system toward Q 1331+170 (Chaffee et al. 1988). Presence of H2 in this system is recently reported (Cui et al., 2004).
| Quasar/ | C i | C i | C i | (km s-1) | TCMB(K) | nH(cm-3) | P/k (cm-3 K) | ||
| log N(H i) | |||||||||
| Q 0013004 | 1.96679 | a16.38 | …. | 3.10.6 | 20007000 | ||||
| 20.83(0.05) | 1.96691 | …. | …. | 3.00.2 | 20008000 | ||||
| 1.96706 | …. | …. | 4.931.44 | …. | …. | …. | |||
| 1.96822 | 4.30.2 | ||||||||
| 1.97280 | b17.4819.78 | …. | 6.00.3 | 40006000 | |||||
| 1.97296 | 6.20.2 | ||||||||
| 1.97316 | …. | 7.00.8 | 10008500 | ||||||
| 1.97365 | c17.3019.60 | …. | 5.70.4 | ||||||
| 1.97382 | …. | …. | 4.50.4 | ||||||
| 1.97399 | …. | …. | …. | 7.31.0 | …. | …. | …. | ||
| 1.97417 | …. | …. | …. | 0.40.3 | …. | …. | …. | ||
| 1.96737 | …. | 14.41.1 | 400013500 | ||||||
| 1.96763 | …. | 27.13.4 | 200018000 | ||||||
| 1.97109 | …. | 10.00.9 | |||||||
| 1.97144 | …. | 13.40.9 | 650016000 | ||||||
| Q 0347383 | 3.02485 | 14.55 | |||||||
| 20.73(0.05) | |||||||||
| Q 0405443 | 2.59474 | 18.14 | …. | …. | …. | …. | …. | …. | |
| 21.05(0.10) | 2.59485 | 15.51 | …. | …. | …. | …. | …. | …. | |
| Q 0528250 | 2.81100 | 17.93 | …. | …. | …. | …. | …. | …. | |
| 21.35(0.10) | 2.81112 | 17.90 | ….. | 0.60.1 | |||||
| Q 0551366 | 1.96152 | ||||||||
| 20.70(0.10) | 1.96168 | 15.80 | |||||||
| 1.96180 | |||||||||
| 1.96214 | |||||||||
| 1.96221 | |||||||||
| 1.96268 | |||||||||
| Q 1037270 | 2.13900 | …. | 15.50.6 | ||||||
| 19.70(0.05) | 2.13940 | …. | 4.51.2 | ||||||
| Q 1232082 | 2.33771 | 19.57 | |||||||
| 20.90(0.08) | |||||||||
| Q 1444014 | 2.08679 | 16.60 | …. | ||||||
| 20.25(0.07) | 2.08692 | 18.15 | …. | ||||||
| Q 2332094 | 2.28749 | …. | |||||||
| 20.25(0.07) | |||||||||
| a total H2 column density in three components at = 1.96679, 1.96691 and 1.96706 is quoted. | |||||||||
| b total H2 column density in three components at = 1.97280, 1.97296 and 1.97316. | |||||||||
| c total H2 column density in four components at = 1.97365, 1.97382, 1.97399 and 1.97417 is quoted. | |||||||||
4.1.1 Dependence on H2 column density
Jenkins & Shaya (1979) found (C i) does not scale linearly with either of (H i), (H2) or (Htotal) in the Galactic ISM. They explained this behavior as a result of strong differences in the response of C i, H i and H2 to physical conditions (electron density, temperature etc…), coupled with marked variations of these conditions from one cloud to the other. In Fig. LABEL:c1fig1, we plot the C i column density as a function of H2 column density in individual components. Among the systems that show H2 absorption lines(filled circles with error-bars) there is no clear trend between (H2) and (C i) even though the presence of C i absorption lines usually indicate the presence of H2 (see discussion above).
4.1.2 The Carbon ionization state
The probability of detecting C i is expected to be higher in systems with higher (H i) and/or metallicity. Ideally, we would like therefore to know (H i) for each individual C i components. This is not possible as all components are definitely blended in one strong H i DLA absorption line. Estimation of N(H i) is possible when the H2 component is well separated from the rest of the components (as in = 1.96822 toward Q 0013004) or when 21 cm observations are available (as in the case of H2 components toward Q 0528250). Note that the presence of very strong C i absorption line in the component at = 1.96822 toward Q 0013004 (that has log N(H i)19.4) is mainly due to high metallicity (Petitjean et al. 2002). Whereas the absence of C i in the component at = 2.81100 and the weakness of C i line of the component at = 2.81112 component toward Q 0528250 are probably due to excess radiation field from the QSO.
The ionization state of Carbon is difficult to determine as the C ii absorption line is usually highly saturated. We can however partly overcome this difficulty assuming that conditions are fairly homogeneous in the DLA system. Under the assumptions that the enrichment of Carbon follows that of elements and that the relative depletion between Sulfur and Carbon is negligible, we can use the well determined (S ii) as an indicator of (C ii) (see Fig. LABEL:c1fig2). In the sun, the Carbon abundance is 1.28 dex higher than that of Sulfur and typical depletion of Carbon relative to Sulfur in the Cold ISM is 0.4 dex (see Table 5 of Welty et al. 1999). The two dotted lines in Fig. LABEL:c1fig2 give the expected correlation for log (C i)/(C ii) = (lower line) and (upper line) respectively, when relative solar abundances are used and it is assumed that there is no depletion of Carbon relative to Sulfur. The short-dashed lines give the same correlations when a depletion of Carbon relative to Sulfur of 0.4 dex is further assumed. If the absorbing gas originates from the CNM then log (C i)/(C ii) is expected to be more than (see Fig. 3 of Liszt 2002). Therefore, within uncertainties due to depletion, it is apparent from Fig. LABEL:c1fig2 that the DLA components with C i detections have a ionization state consistent with them originating from the CNM.
It is interesting to note that the distribution of (S ii) is somewhat similar for components with both H2 and C i absorption lines (filled circles), and for components with C i but no H2 absorption lines (open circles). However C i column densities are typically lower in the components without H2 suggesting, as expected, that when H2 is seen, the C i/C ii ratio is larger.
Most of the upper limits on C i are consistent with (C i)/(C ii) (see Fig. LABEL:c1fig2). This can mean either that the relative depletion of Carbon compared to Sulfur is larger than 0.4 dex in the CNM, which is unlikely, or that most of the DLA systems originate from the warm neutral medium (WNM) or warm ionized medium (WIM) where the above ratio can be as low as .

4.1.3 The effect of dust
In Fig. 11 we plot log (C i) against the depletion factor defined as log ((Fe ii)/(X ii))[Fe/X]⊙ with either X = Zn, S or Si. C i absorption line is not detected in systems with low depletion factors (i.e., [Fe/Zn] less than 0.5 dex) whereas components with higher depletion factors readily show detectable C i absorption lines. This trend is not surprising as there is a 4 correlation between the depletion factor and the metallicity of the gas in our sample (see Figure 12 of Ledoux et al. 2003). Depletion factors lower than 0.5 dex are usually seen in systems with [Zn/H] . High depletion factor in high metallicity gas implies high dust content and hence high dust optical depth to the UV radiation. The absence of C i in components with low dust depletion is a combination of low metallicity and low dust optical depth to the UV radiation. It is worth remembering that similar relation exists between the detectability of H2 and depletion (Fig. 14 of Ledoux et al. 2003).
4.2 C i fine-structure excitation
| QSO | log (S ii) | log (C ii∗) | (cm-3)a | (cm-3) | |
|---|---|---|---|---|---|
| Q | 1.96679+ | …. | …. | ||
| 1.96822+ | …. | …. | |||
| 1.97280+ | …. | …. | |||
| 1.97296+ | …. | …. | |||
| 1.97316+ | …. | …. | |||
| 1.97365+ | …. | …. | |||
| 1.97382+ | …. | …. | |||
| 1.97399+ | …. | …. | |||
| 1.96737 | …. | …. | |||
| 1.96763 | …. | …. | |||
| 1.97109 | …. | …. | |||
| 1.97144 | …. | …. | |||
| Q | 3.02463 | ||||
| 3.02485+ | |||||
| 3.02501 | |||||
| Q | 2.59440 | ||||
| 2.59464 | |||||
| 2.59474+ | |||||
| 2.59485+ | |||||
| Q | 1.96152 | ||||
| 1.96168+ | |||||
| 1.96180 | |||||
| 1.96214+ | |||||
| 1.96221+ | |||||
| 1.96268 | |||||
| Q | 2.13900 | ||||
| 2.13940 | |||||
| Q | 2.33771+ | ||||
| Q | 2.08679+ | ||||
| 2.08692+ | |||||
| A label “” indicates a component in which H2 is detected | |||||
| a Derived from the Carbon ionization equilibrium | |||||
| b column density of Si II is given. | |||||
In most of the DLAs with C i detections we also detect absorption lines from the excited fine-structure levels. It is therefore possible to use the relative populations of the C i ground state levels to discuss the particle density, the ambient UV radiation field and the temperature of the cosmic-microwave background radiation (see Bahcall et al., 1973; Meyer et al., 1986; Songaila et al. 1994; Ge, Bechtold & Black, 1997; Roth & Bauer, 1999; Srianand et al. 2000; Silva & Viegas, 2002; Quast et al. 2002). In the Galactic ISM, fine-structure excitation of C i has been used to study the distribution of thermal pressure (see Jenkins & Tripp 2001).
In Fig. LABEL:figc1 we plot the ratio (C i∗)/(C i) as a function of (C i). It is clear that the C i column densities in DLAs (filled circles with error-bars) are at least an order of magnitude less than that measured in the ISM (stars). This is probably a consequence of lower metallicities and/or low H i content in DLA components. The important point is that the (C i∗)/(C i) ratio measured in DLAs is remarkably larger than in the Galaxy. However, while comparing the ISM and DLAs, it is important to remember that most of the sightlines used by Jenkins & Tripp (2001) have H2 fraction orders of magnitude higher than what we measure in DLA components. As H2 collisions are less efficient in populating the excited fine-structure state of C i we expect that for a given total hydrogen density (and a given kinetic temperature) (C i∗)/(C i) be higher in DLAs.
The horizontal dotted line in Fig. LABEL:figc1 indicates the expected value of the ratio if it is assumed that the excitation is due to the CMBR only with a temperature = 8.1 K as expected at = 2, the typical redshift of our sample. It is clear that the CMBR field expected from the Big-Bang is not sufficient to explain the observed ratios and an extra contribution is required from collisional processes and/or the UV flux.
Collisions with H, He, e, p and H2 can populate the excited state of C i. As H i is the dominant form of hydrogen in the gas, the contribution to the fine-structure excitation by H2 collisions can be neglected. The electron and proton densities are expected to be very small, at least smaller by two orders of magnitude than the hydrogen density, and their contribution is also negligible (Keenan et al. 1986). The He i collisional rates are much less than that of H i and the He i/H i ratio is small which makes collisions with He i unimportant (see Fig. 1 of Silva & Viegas 2002). Thus in our analysis of the C i excitation we consider only collisions by neutral hydrogen. The rates are taken from Launay & Roueff (1977). The spontaneous decay rates are and (Bahcall & Wolf 1968). The corresponding CMBR excitation rate is derived from these values. The UV pumping rate in the cloud depends on the nature and strength of the UV radiation field. We assume that the UV intensity is the same as in the ISM of our Galaxy as suggested by the high excitation of H2.
The dashed lines in Fig. LABEL:figc1 give the expected ratio for, = 8 K, a UV radiation field like in the Galaxy (with an excitation rate of ), hydrogen density in the range = 20250 cm-3, versus the kinetic temperature, , in the range K (consistent with measured in DLAs). It can be seen that a typical density range consistent with most of the observed point is, 20150. The density () and pressure () derived for individual components are summarized in column 9 and 10 respectively in Table. 3. Here, we assume = 2.7(1+) and = in the case of H2 detection and = 100 K otherwise. The derived pressure range in DLA components are higher than that typically measured in the galactic ISM (see Jenkins & Tripp 2001) and consistent with what is expected in a the cold neutral medium (CNM) with lower metallicity (Z0.1 Z⊙) and dust depletion (see Wolfire et al. (1995, 2001), Wolfe et al., (2003a, b) Srianand et al. 2005). Interestingly the derived density range in most of the components is close to the critical density for thermalising the H2 (J=2)/(J=0) ratio (see Fig. LABEL:h2col).
5 Carbon ionization state
In the ISM, when hydrogen is neutral, most of the carbon is in the form of C ii so that we can use the C i/C ii ratio to derive the physical conditions in the gas. As already mentioned, the C ii absorption features are always badly saturated and we rely on the realistic assumption that C ii in the neutral phase can be traced by S ii and/or Si ii so that we can use the weak lines of these species to derive the C ii column densities in the components of interest.
Assuming photoionization equilibrium between C i and C ii and using the atomic data from Shull & Van Steenberg (1982) and Péquignot et al. (1991), we can write,
| (5) |
Here, is the photoionization rate for C i. In the local ISM, s-1 (Péquignot & Aldrovandi 1986). Here, we neglect the ion-molecular interaction and charge exchange reactions that may produce C i. Thus can be constrained once the temperature of the gas is known. Application of Eq. 5 to the cold Galactic ISM (with = 100 K) has resulted in cm-3 (Welty et al. 2002 and references there in). In the stable CNM considered by Wolfire et al. (1995) the electron density is expected to be in the range 0.010.02 for = 0.1 and dust abundance one tenth of the Galactic ISM.
5.1 Systems with C i detections
First we concentrate on the systems with C i detections. We estimate the electron density assuming a UV field similar to the Galactic mean field (i.e., s-1), for the H2 components and =100 K otherwise. Individual values of derived for these systems are given in Table 4. The electron density is in the range 0.7. Together with nH given in Table 3, this suggests that for most of the systems. Therefore, the ionization state of the gas with H2 and C i is similar to that in the CNM in a moderate radiation field.
5.2 Systems without H2 and C i
In the case of systems in which neither H2 nor C i are detected, we assume = 100 K and s-1 and obtain upper limits on the electron density. The results are plotted in Fig. LABEL:eden. We notice that the inferred electron densities are much smaller than in systems in which C i (and H2) are detected. The difference is even larger if we use only the systems with log (C ii)15. For this gas the inferred electron densities are less than 10-2 cm-3 (with a median of 10-3 cm-3). This may indicate that the absorption originates from warm neutral medium (say = 8000 K). If the average radiation field in DLAs is similar to that in the Galactic ISM then the absence of C i in most of the DLAs could just be a consequence of lower densities (and/or higher ) in these systems. One can derive an independent estimate of the particle density using the excitation of C ii fine structure levels. This is what we do in the following Section.
6 Excited fine-structure line of C ii
| Quasar | log (H i) | C i | Si ii | S ii | [Fe/X] | C ii | (km s-1) | X | ||
|---|---|---|---|---|---|---|---|---|---|---|
| Q 0000263 | 21.40(0.08) | (0.09) | 3.39013 | …. | 15.06(0.02) | 14.70(0.03) | (0.06) | …. | 10.0(0.3) | Zn |
| Q 0010002 | 20.95(0.10) | (0.11) | 2.02471 | 14.90(0.05) | 14.50(0.05) | (0.08) | 5.5(0.4) | Zn | ||
| 2.02484 | 15.09(0.03) | 14.77(0.03) | (0.07) | 8.4(0.5) | Zn | |||||
| Q 0058292 | 21.10(0.10) | (0.10) | 2.67123 | 14.87(0.07) | 14.61(0.03) | (0.05) | 12.82(0.04) | 8.7(0.7) | Zn | |
| 2.67142 | 14.98(0.05) | 14.63(0.03) | (0.04) | 12.79(0.04) | 8.2(0.2) | Zn | ||||
| Q 0102190 | 21.00(0.08) | (0.09) | 2.36958 | …. | 13.93(0.04) | (0.06) | 2.0(0.2) | S | ||
| 2.36966 | …. | 14.06(0.03) | (0.04) | 3.5(0.2) | S | |||||
| Q 0112306 | 20.50(0.08) | (0.09) | 2.41844 | 13.31(0.02) | (0.04) | 3.5(0.2) | Si | |||
| 2.41861 | 13.33(0.02) | (0.09) | 6.9(0.4) | Si | ||||||
| 2.41869 | 5.6(1.1) | Si | ||||||||
| 20.30(0.10) | (0.15) | 2.70111 | …. | 7.2(0.8) | Si | |||||
| 2.70163 | 14.75(0.05) | …. | (0.06) | 27.4(2.2) | Si | |||||
| 2.70217 | 14.76(0.10) | …. | (0.15) | 14.9(3.1) | Si | |||||
| 2.70233 | 14.29(0.18) | …. | (0.22) | 3.6(1.2) | Si | |||||
| 2.70257 | 14.58(0.05) | …. | (0.06) | 11.0(1.2) | Si | |||||
| 2.70276 | …. | 3.8(0.7) | Si | |||||||
| 2.70316 | …. | 12.750.06 | 7.2(1.0) | Si | ||||||
| 2.70332 | 14.18(0.03) | …. | (0.10) | 13.200.04 | 4.6(0.5) | Si | ||||
| 2.70334 | 14.21(0.01) | 13.710.02 | 11.8(1.1) | Si | ||||||
| Q 0112029 | 20.90(0.10) | 1.32(0.15) | 2.42234 | 13.92(0.13) | …. | 0.18(0.13) | 12.56(0.24) | 4.7(0.3) | S | |
| 2.42248 | 14.04(0.11) | …. | 0.35(0.12) | 12.14(0.72) | 6.8(0.8) | S | ||||
| 2.42266 | 14.02(0.10) | …. | 0.58(0.11) | 12.21(0.59) | 6.1(0.9) | S | ||||
| 2.42277 | 14.16(0.08) | …. | 0.37(0.09) | 12.70(0.17) | 3.7(0.3) | S | ||||
| 2.42298 | 14.77(0.04) | …. | 0.40(0.05) | 13.66(0.06) | 10.5(0.5) | S | ||||
| 2.42323 | 14.65(0.04) | …. | 0.38(0.05) | 13.26(0.07) | 6.3(0.3) | S | ||||
| 2.42338 | 14.04(0.14) | …. | 0.33(0.15) | 13.20(0.08) | 9.5(1.3) | S | ||||
| 2.42353 | 13.97(0.06) | …. | 1.13(0.09) | 12.61(0.20) | 2.5(0.6) | S | ||||
| Q 0135273 | 21.00(0.10) | 1.40(0.10) | 2.79948 | 12.00 | 13.91(0.05) | …. | 0.27(0.07) | 12.78(0.25) | 7.4(1.1) | S |
| 2.79960 | 12.00 | 14.14(0.10) | …. | 0.33(0.12) | 13.50(0.09) | 0.1(0.1) | S | |||
| 2.79972 | 12.00 | 14.14(0.31) | …. | 0.24(0.32) | 13.39(0.12) | 8.4(1.4) | S | |||
| 2.79982 | 12.00 | 14.08(0.30) | …. | 0.24(0.32) | 13.38(0.12) | 5.5(1.0) | S | |||
| 2.79998 | 12.00 | 13.85(0.10)∗ | …. | 0.39(0.11) | 13.69(0.06) | 6.2(0.8) | S | |||
| 2.80010 | 12.00 | 14.05(0.38)∗ | …. | 0.08(0.38) | 13.26(0.10) | 3.9(0.4) | S | |||
| 2.80025 | 12.00 | 14.71(0.08) | …. | 0.53(0.08) | 13.85(0.07) | 5.1(0.2) | S | |||
| Q 0405443 | 21.15(0.15) | 1.41(0.15) | 2.54967 | 12.99(0.27) | …. | 0.84(0.82) | 11.83(0.29) | 0.3(0.1) | S | |
| 2.54973 | 13.23(0.03) | …. | 0.19(0.04) | 12.75(0.05) | 9.8(0.9) | S | ||||
| 2.54992 | 14.56(0.02) | …. | 0.23(0.02) | 13.12(0.03) | 5.3(0.2) | S | ||||
| 2.55011 | 14.41(0.05) | …. | 0.19(0.05) | 13.21(0.04) | 18.5(2.1) | S | ||||
| 2.55049 | 13.76(0.11) | …. | 0.09(0.12) | 12.45(0.12) | 9.4(2.2) | S | ||||
| 2.55060 | 13.87(0.05) | …. | 0.31(0.06) | 12.38(0.07) | 3.8(0.6) | S | ||||
| 2.55078 | 14.10(0.05) | …. | 0.48(0.06) | 12.96(0.09) | 7.8(1.3) | S | ||||
| 2.55087 | 14.18(0.12) | …. | 0.26(0.12) | 13.16(0.12) | 6.2(1.4) | S | ||||
| 2.55097 | 14.30(0.06) | …. | 0.31(0.06) | 13.08(0.09) | 4.5(0.4) | S | ||||
| 2.55105 | 13.69(0.05) | …. | 0.19(0.07) | 12.75(0.03) | 5.1(0.5) | S | ||||
| 2.55124 | 13.86(0.03) | …. | 0.29(0.04) | 12.55(0.03) | 5.9(0.5) | S | ||||
| 20.45(0.10) | (0.11) | 2.62101 | 12.92(0.02) | (0.04) | 7.5(0.2) | Si | ||||
| 2.62140 | 13.20(0.03) | (0.04) | 5.4(0.2) | Si | ||||||
| 2.62158 | 13.47(0.02) | (0.03) | 16.0(0.6) | Si | ||||||
| 2.62178 | 12.92(0.02) | (0.04) | 4.4(0.2) | Si | ||||||
| 2.62219 | 12.02(0.05) | 5.7(1.3) | Si | |||||||
| 2.62235 | 11.87(0.06) | 2.0(1.3) | Si | |||||||
| 2.62287 | 12.98(0.02) | (0.06) | 10.9(0.5) | Si | ||||||
| 2.62311 | 13.03(0.08) | (0.12) | 6.9(0.9) | Si | ||||||
| 2.62320 | 12.96(0.08) | (0.13) | 3.6(0.3) | Si | ||||||
| Q 0841129 | 21.05(0.10) | 1.59(0.10) | 2.37439 | …. | 14.26(0.18) | 1.14(0.20) | 12.91(0.14) | 9.0(2.3) | S | |
| 2.37455 | …. | 14.43(0.12) | 0.60(0.23) | 13.01(0.11) | 7.2(1.3) | S | ||||
| 20.80(0.10) | 1.60(0.10) | 2.47604 | …. | 13.47(0.27) | 0.51(0.34) | 5.1(2.4) | S | |||
| 2.47621 | …. | 14.42(0.05) | 0.26(0.07) | 9.1(1.1) | S | |||||
| 2.47642 | …. | 13.35(0.27) | 0.40(0.30) | 2.2(2.5) | S | |||||
| Q 1037270 | 19.70(0.05) | (0.06) | 2.13910 | 12.51(0.02) | 15.10(0.02) | 14.65(0.01) | (0.03) | 15.6(0.2) | Zn | |
| 2.13951 | 12.46(0.02) | 14.70(0.02) | 14.23(0.01) | (0.04) | 8.8(0.2) | Zn | ||||
| Q 1101264 | 19.50(0.04) | (0.06) | 1.83817 | 12.29(0.09) | (0.18) | 4.5(0.4) | Si | |||
| 1.83831 | 12.68(0.05) | (0.09) | 10.3(0.3) | Si | ||||||
| 1.83854 | 13.33(0.02) | 13.19(0.26) | (0.02) | 5.8(0.1) | Si | |||||
| 1.83871 | 13.21(0.02) | 13.12(0.36) | (0.03) | 9.4(0.2) | Si | |||||
| 1.83890 | 13.61(0.02) | 13.32(0.19) | (0.02) | 5.4(0.1) | Si | |||||
| 1.83915 | 12.77(0.05) | (0.05) | b | 5.6(0.2) | Si | |||||
| 1.83925 | 12.50(0.28) | (0.28) | b | 2.0(0.2) | Si | |||||
| 1.83933 | 12.44(0.26) | (0.26) | b | 5.0(0.5) | Si | |||||
| Q 1117134 | 20.95(0.10) | (0.14) | 3.35027 | 14.78(0.03) | b | (0.06) | 6.9(0.4) | Zn | ||
| 3.35046 | 14.68(0.05) | b | (0.06) | 6.5(0.6) | Zn | |||||
| 3.35067 | 14.26(0.05) | b | 6.2(0.3) | Zn | ||||||
| Q 1157014 | 21.80(0.10) | 1.40(0.10) | 1.94311 | 14.13(0.08) | …. | 1.40(0.30) | 12.36(0.14) | 3.9(1.3) | Si | |
| 1.94318 | 14.22(0.08) | …. | 0.96(0.13) | 12.21(0.23) | 3.6(1.1) | Si | ||||
| 1.94354 | 15.32(0.04) | …. | 0.67(0.05) | 13.91(0.04) | 28.9(1.4) | Si | ||||
| 1.94346 | 15.09(0.03) | …. | 1.16(0.06) | 13.74(0.04) | 6.0(0.4) | Si | ||||
| 1.94361 | 14.75(0.23) | …. | 1.10(0.31) | 13.00(1.37) | 6.1(1.5) | Si | ||||
| 1.94375 | 15.39(0.03) | …. | 1.21(0.04) | 14.08(0.18) | 5.6(0.0) | Si | ||||
| 1.94403 | 15.26(0.01) | …. | 1.07(0.02) | 13.87(0.02) | 7.2(0.0) | Si | ||||
| 1.94385 | 14.89(0.03) | …. | 0.92(0.05) | 13.96(0.03) | 8.1(0.5) | Si | ||||
| 1.94426 | 14.07(0.69) | …. | …. | 13.14(0.06) | 10.3(0.0) | Si | ||||
| Q 1223178 | 21.40(0.10) | (0.11) | 2.46530 | 14.90(0.02) | 14.56(0.03) | (0.04) | 13.63(0.02) | 10.3(0.3) | Zn | |
| 2.46559 | 14.78(0.03) | 14.54(0.04) | (0.06) | 14.0(0.8) | Zn | |||||
| 2.46607 | 15.22(0.02) | 14.82(0.02) | (0.03) | 14.7(0.3) | Zn | |||||
| 2.46628 | 14.13(0.09) | …. | 4.3(0.7) | Zn | ||||||
| Q 1337113 | 20.12(0.05) | (0.07) | 2.50766 | 12.93(0.06) | b | (0.09) | 5.0(1.3) | Si | ||
| 2.50792 | 13.82(0.04) | b | (0.04) | 6.5(0.2) | Si | |||||
| 21.00(0.08) | (0.10) | 2.79557 | 13.90(0.16) | …. | (0.17) | b | 12.8(1.6) | Si | ||
| 2.79584 | 14.63(0.04) | …. | (0.04) | b | 6.6(0.3) | Si | ||||
| Q 1451123 | 20.40(0.10) | (0.14) | 2.46897 | 13.23(0.09) | (0.09) | b | 6.7(0.8) | Si | ||
| 2.46921 | 13.50(0.11) | (0.11) | b | 5.7(0.5) | Si | |||||
| 20.20(0.20) | (0.21) | 3.17081 | 13.31(0.06) | …. | (0.14) | 9.9(1.8) | Si | |||
| 3.17112 | 13.31(0.07) | …. | (0.13) | 7.3(1.5) | Si | |||||
| 3.17142 | 12.72(0.18) | …. | 9.6(4.9) | Si | ||||||
| Q 2059360 | 20.29(0.07) | (0.08) | 2.50734 | 13.85(0.03) | 13.49(0.23) | (0.04) | 4.5(0.3) | Si | ||
| 2.50753 | 12.99(0.10) | (0.13) | 5.8(6.1) | Si | ||||||
| 20.98(0.08) | (0.11) | 3.08261 | 14.36(0.05) | 13.97(0.05) | (0.05) | 5.7(0.3) | S | |||
| 3.08291 | 14.61(0.05) | 14.16(0.05) | (0.05) | 8.7(0.6) | S | |||||
| 3.08314 | 7.2(0.9) | S | ||||||||
| Q 2138444 | 20.98(0.05) | (0.05) | 2.85234 | 14.86(0.02) | 14.50(0.02) | (0.03) | 8.5(0.2) | Zn | ||
| Q 2332094 | 20.50(0.07) | (0.11) | 3.05632 | sat/bld | 13.76(0.05) | (0.05) | 9.8(0.3) | S | ||
| 3.05657 | sat/bld | 13.49(0.07) | (0.08) | 5.1(0.5) | S | |||||
| 3.05676 | sat/bld | 3.2(0.4) | S | |||||||
| 3.05690 | sat/bld | 13.48(0.11) | (0.11) | 12.9(0.6) | S | |||||
| 3.05722 | sat/bld | 13.85(0.04) | (0.04) | 4.9(0.2) | S | |||||
| 3.05738 | sat/bld | 13.50(0.09) | (0.10) | 6.6(0.7) | S | |||||
| The numbers in parentheses are standard deviations. Strict upper limits are detection limits;“….”: no transition line from this ion has been observed | ||||||||||
| “b”: blended; “sat/bld”: most or all of the components in the observed transition lines from this ion are either saturated or blended, or both. | ||||||||||
6.1 Method to derive physical parameters
Under LTE, the column density ratio (C ii∗)/(C ii), can be written as,
| (6) |
where, cm-3 s-1 and cm-3 s-1 are the collisional excitation rates per unit volume for electrons and hydrogen atoms (Bahcall & Wolf 1968) with being the kinetic temperature of the gas. The Einstein’s coefficient is s-1. The CMB pumping rate, , equals 6.6 s-1 and 1.1 s-1 for, respectively, redshifts 2 and 3 (Silva & Viegas 2002). For a given temperature, the collisional excitation rate for electrons is orders of magnitude larger than that for hydrogen atoms. For example, when = 1000 K, whenever is larger than 5, collisions with electrons is the dominant process. UV pumping is an additional possible excitation mechanism. For the mean radiation field in our Galaxy, the UV pumping rate is 9.3 s-1 (Silva & Viegas 2002). This is similar to or slightly lower than the CMB pumping rate for the range of redshift we consider in this study.
We compute the expected value of log (C ii∗)/(C ii) ratio under different situations and in particular the WNM and CNM solutions given in Table 3 of Wolfire et al. (1995). Note that if CMBR pumping alone is responsible for the excitation, the expected ratios are and for, respectively, = 2 and 3. For the standard ISM (with stable pressure in the range 9903600 cm-3 K), we derive log (C ii∗)/(C ii) for the CNM and log (C ii∗)/(C ii) for the WNM. As the DLA gas has low metallicity and low dust content, the expected pressure should be higher in the two DLA phases (see Liszt 2002 and Wolfe et al. 2003). If we assume and dust to gas ratio one tenth of the ISM value (which is typical of DLAs) then we expect log (C ii∗)/(C ii) for the CNM and log (C ii∗)/(C ii) for the WNM in DLAs. Thus if DLAs originate from H i gas in a two-phase equilibrium, we expect the CMBR pumping to be sub-dominant compared to collisional excitation. In fact if the gas is completely neutral then from Eqs. (5) and (6) we derive,
| (7) | |||||
This gives an independent estimate of nH which, by comparison with the estimate derived from the C i excitation, can lead to constraints on the radiation field. However, the ionization fraction (i.e ) and the temperature of the neutral absorbing gas must be accurately determined before densities can be derived using the (C ii∗)/(C ii) ratio. Indeed, the fact that, in DLAs, the Al iii absorption profile is very similar to that of neutral or singly ionized species has been used as evidence for the presence of ionized gas being mixed with the neutral gas in DLAs (Lu et al. 1996; Prochaska & Wolfe 1999; Howk & Sembach 1999; Wolfe & Prochaska 2000; Vladilo et al. 2001; Izotov et al. 2001). In the ionized gas (i) as well as will be higher than what is expected in the warm or cold neutral gas and (ii) (Si ii) will under-predict (C ii) as the ionization corrections are different for the two species (see Fig. 1 of Izotov et al. 2001). Neglecting the presence of ionized gas can artificially enhance the derived nH values.
6.2 Frequency of C ii∗ detection
In our sample, all the systems that show H2 also show detectable C ii∗ absorption line. The details of the fits to the C ii∗ absorption line for these systems are summarized in Table 5 and shown in Fig. LABEL:vpc2star. The components toward Q and Q are badly blended and it is therefore not possible to fit (C ii∗). We detect C ii∗ in seven out of the 21 DLAs that do not show H2 absorption lines. If we also include the 8 DLAs that show H2, about 50% (15 out of 29) of the DLAs in our sample show detectable C ii∗ absorption line which is consistent with the finding by Wolfe et al. (2003).
In Fig. LABEL:c2sdet we plot the average (over the whole profile) (C ii∗)/(C ii) ratio measured in DLAs in our sample together with the measurements by Wolfe et al. (2003a, 2003b) against the total H i column density and the silicon metallicity. Here we use the total column density summed over all the components. (C ii) is computed from (Si ii) assuming solar abundance ratio without any ionization correction. From the upper panel in Fig. LABEL:c2sdet it can be seen that C ii∗ is detected in all the systems with log (H i) 21.0. Interestingly no such relationship exists between C i (or H2) and H i. Most the systems with log (H i) 21.0 have (C ii∗)/(C ii) consistent with what is expected in CNM. On the contrary, the measured values of (C ii∗)/(C ii) in systems with lower (H i) spread over more than an order of magnitude covering the expected ranges for WNM and CNM.
From the bottom panel, it can be seen that C ii∗ is frequently detected in gas with high metallicity as already noticed by Wolfe et al. (2003a). Most of the systems that show C ii∗ absorption line with lower (H i) do have statistically higher metallicity. In the whole sample the number of systems with C ii∗ detections that are consistent with CNM and WNM are approximately equal. Most of the upper limits on the ratio, measured in the metallicity range , are lower than what would be expected from CNM gas and are consistent with WNM (or low density) gas. Interestingly these upper limits are lower than that seen in high latitude Galactic sightlines that are believed to be predominantly WNM gas. This means that the electron density (and therefore probably the total particle density) in these DLAs is probably quite small.
6.3 Systems with H2 detection
Systems with H2 detections (marked as filled circles in Fig. LABEL:c2sdet) have (C ii∗)/(C ii) consistent with CNM. We compute the allowed range of nH in these components using (C ii∗), (S ii), from the C i excitation and if available or = 100 K (see Eq.7). The results are summarised in Column 6 of Table 4. This Table also gives upper limits on nH for components without H2 in systems that show H2. It is to be remembered that we assume [C/S] in DLAs is [C/S]⊙. Realistically Carbon can be under-abundant by up to a factor of 2. In that case the density will be higher than what we quote in the table. From Table 3 and 4 it is clear that for the H2 components toward Q 0347383, Q 0551366 and Q 1232082 the value of nH derived from both methods agree well. Such a comparison is not possible for the components toward Q 0013004 and Q 0405383 as C ii∗ is blended in the former case and C i is not detected in the latter case. In the case of Q 1444+014 the derived hydrogen density based on C ii∗ is lower than that derived using C i fine-structure excitation. However, in this system, Ledoux et al. (2003) have found a 5 km/s shift between the C i absorption line and that of singly ionized species. In addition these components showing relative depletion of Si with respect to S, it is possible that we have over estimated (C ii). In summary, the estimates based on the two methods are approximately consistent with one another. The excitation of the fine-structure levels of C i and C ii in the components with H2 detection are consistent with high density and low temperature CNM gas.
6.4 Systems without H2 detection
| QSO | log x(Al iii) | nH (cm-3) | ||||
| CNM1 | WMN2 | Ionized3 | Max4 | |||
| Q | 2.671 | …. | 3.1 | 1.2 | 0.3 | 3 |
| Q | 2.422 | 24.4 | 9.6 | 2.3 | 15 | |
| Q | 2.799 | 60.0 | 23.4 | 5.6 | 5 | |
| Q | 2.550 | 7.3 | 1.8 | 0.4 | 4 | |
| Q | 2.374 | 11.3 | 2.8 | 0.7 | 22 | |
| Q | 1.944 | 16.3 | 4.0 | 1.0 | 3 | |
| Q | 2.465 | 9.4 | 2.3 | 0.6 | 2 | |
| 1 = 100 K and = 0.001; 2 = 8000 K and =0.01 | ||||||
| 3 = 104 K and = 0.1; 4 from H2 equilibrium formation | ||||||
In this Section we focus our attention on the 7 systems in our sample that show C ii∗ without H2. These systems do not show detectable C i absorption lines except the high-metallicity system at = 2.1391 toward Tol 1037270. Apart from the = 1.943 system toward Q 1157+014 that show 21 cm absorption line (Wolfe et al. 1981) there is no independent constraint on and . The identification of C ii∗ at = 2.422 toward Q and = 2.799 toward Q is based on C ii∗ absorption line. These lines are well inside the Lyman- forest and possible contamination by intervening H i absorption cannot be ruled out. For the rest of the systems, the identification and estimation of the C ii∗ column density are secure.
We detect Al iii absorption lines in the 6 (out of 7) systems for which our spectra cover the expected wavelength range of the redshifted Al iii transitions. We estimate the fraction of Al in Al iii using the observed metallicity and the observed (Al iii), assuming no depletion and solar relative abundances. Results are summarised in Table 6. From the Table, it can be seen that 17 % of Al is twice ionized. Using photoionization models from “CLOUDY” we derive a typical ionization parameter log if the gas originates from a single slab irradiated by stellar spectrum with an effective black-body temperature of 30,00040,000 K (also see Fig. 1 in Izotov et al. 2001). This implies that the average ratio along the line of sight is typically in the range 0.3 to 0.9. Thus there are enough electrons in the cloud so that collisions with electrons are dominant in the excitation of C ii∗.
The average density, , is derived using Eq. 7 and assuming three possible combinations of and . The results are summarised in Table 6. When we use no additional constraints, the C ii∗ observations alone are consistent with the gas having high density and low temperature (see Column 4 of Table 6).
The last column in the table gives the upper limit on that will
keep the equilibrium abundance of H2 below our detection limit
(i.e (H2) cm-2).
This value is computed using simple formation equilibrium of
optically thin H2 (Jura 1975)
| (8) |
with, and , respectively, the formation and photo-destruction rates of H2. In the case of the ISM, 3 s-1 cm-3 and s-1. We use the ISM value of scaled by the dust content measured in the systems. It can be seen from Table 6 that for a moderate radiation field (like the ISM mean field) derived using C ii∗ for the CNM like parameters is usually higher than the upper limit obtained based on the H2 equilibrium formation. In addition, the expected electron density for the = 100 K gas (assuming a ratio as seen in CNM) is higher than 10-2 cm-3. At such electron densities, C i should be detectable. This is inconsistent with the non-detection of C i in these systems. This problem of CNM gas producing very small amount of C i is already recognized in the literature (Liszt et al. 2002; Wolfe et al. 2003).
We notice that the absence of C i and H2 in these systems is consistent with the gas originating either from the WNM gas or from the ionized gas. As pointed out above, the strength of the Al iii absorption lines seen in these systemsare consistent with the gas density being less than the one expected for the CNM.
Thus, if one uses only C ii∗ absorption line then the results are consistent with these systems originating from CNM gas. However the absence of H2 and C i absorption lines together with the presence of Al iii following the profiles of singly ionized gas is inconsistent with standard CNM solutions. Thus most of the DLAs without H2 are consistent with them originating from low density, high temperature and partially ionized gas.
6.5 = 1.944 toward Q
Some of our conclusions of the previous Section can be ascertained in the case of the = 1.944 system toward Q as we have additional information on the kinetic temperature based on 21 cm absorption (Wolfe et al. 1981). The estimated spin temperature based on the recent measurement of (H i) is = 865190 K (Kanekar & Chengalur 2003). Fig. LABEL:vp1157 shows the velocity plot of selected absorption lines in this system. The distribution of neutral, singly ionized and doubly ionized species in velocity space can be visualized easily. Using a Gaussian profile, we also show, in the bottom panel, the velocity range over which 21 cm absorption is seen. Whereas the UV absorption lines spread over more than 100 km s-1, the 21 cm absorption originates from only a few of the components. There are components that do not possess 21cm absorption but show absorption due to UV transitions including that of C ii∗. As expected, C ii∗ traces a wide range of physical conditions. Assuming the temperature of the gas that is producing the 21 cm absorption feature to be 100 K (or 200 K), we can derive from the 21 cm observation the H i column density in the component lying along the line of sight: cm-2 (or 1.4 cm-2). This is approximately 15% (30%) of the total (H i) measured from the damped Lyman- line. This means that 85% (70%) of (H i) along the line of sight is either warm or hot. From the Si ii1808 profile, we notice that 60% of (Si ii) originate in the velocity space covered by the 21cm profile. We also notice that considerable fraction of Al iii absorption originate from the velocity range covered by 21 cm absorption. Thus warm and ionized components seem to be co-spacial with the cold gas responsible for the 21 cm absorption. In addition we also notice Al iii components with Si ii and C ii∗ absorption well separated from the 21 cm component. Thus part of the C ii∗ absorption seen here originate from the WNM or WIM. Therefore, the non-detection of H2 in this system can be easily explained as a consequence of most of the gas being at high temperature (and hence low density). The absence of H2 from the cold 21 cm absorbing component could just be due to the low (H i) associated with this component and the relatively low dust depletion.
7 Discussion and conclusions
We have studied the physical conditions in damped Lyman- systems (DLAs) using a sample of 33 systems toward 26 QSOs acquired for a recently completed survey of H2 in DLAs by Ledoux et al. (2003). We use standard techniques to estimate the physical conditions prevailing in the gas. In this Section, we discuss some of the results and related issues.
7.1 High pressure of the H2 gas
Our study shows that the H2 components in DLAs trace Cold gas (153 K) with relatively high pressure. The pressure in individual components (measured assuming a radiation field similar to our Galaxy) is in the range 82430,000 cm-3 K, a large fraction of the components being at high pressure. 42%, 20%, and 8% of the components have pressure in excess of 3000 cm-3 K, 5000 cm-3 K and 104 cm-3 K, respectively. Based on the profiles of singly ionized species we note the H2 components arise in gas with a wide range of molecular content and ionization state much like what we see in the Galactic ISM.
This is not unexpected. Indeed, in the framework of a galactic two-phase medium, the stable pressure range for the gas is 460 1750 (Wolfe et al. 2003). Clearly the pressure we derive in the H2 components are much higher than this. From Table 3 of Wolfire et al. (1995) it can be seen that for a given metallicity an increase in the dust-to-gas ratio can lead to an increase in the allowed range of pressure, whereas an increase in the metallicity reduces the allowed range of pressure due to enhanced cooling. For conditions typical of DLAs, that is for metallicities of Z = and a dust-to-gas ratio ten times smaller than in the Galaxy, the stable pressure range is 1800-13000 cm-3 s-1 (Wolfire et al. 1995). Note that in the absence of any confining medium (or pressure equilibrium between different components) we expect such a high pressure gas to survive only for a short period of time (with a typical hydrodynamical time-scale of 106 years).
The pressure we infer depends very much on the intensity of the radiation field. A larger intensity implies and excess of UV pumping (on top of what we assume in our analysis) which, if taken into account, should reduce the hydrogen density derived using the C i fine-structure lines. At the same time, the temperature of the gas will increase due to photo-heating.
7.2 H2 content
Ledoux et al. (2003) found that approximately 1320% of DLAs show H2 absorption lines with most of the H2 components having column densities in the range log (H2)(cm-2) . In the case of the Galactic ISM, only a minor fraction of the clouds fall in this range. This is expected because, above log (H2) 16.0, self-shielding drastically decreases the photo-dissociation rate. On the contrary, in the LMC and SMC, a large fraction of lines of sight have log (H2) (see Tumlinson et al., 2002). Thus the trend noticed in DLAs could just be a generic feature of gas with low dust content and metallicity. It is however important to remember that the molecular fraction given in Ledoux et al. (2003) is an average over the whole line of sight. The actual molecular fraction in individual components may be much larger. Thus the low values of (H2) that are observed could just be a consequence of low (H i) in the corresponding individual components. Indeed, consistent models of DLAs (Srianand et al. 2005) require H i column densities much less than the total (H i) measured in DLAs with H2. In addition, the absence of 21 cm absorption can be reconciled if the H2 components have only part of the total H i (see below).
7.3 21 cm absorption
We have shown that detecting H2 and C i absorption lines is an efficient way to trace the cold neutral gas in DLAs. H i 21 cm absorption line provides an independent way of detecting the CNM gas in DLAs. The detectability of 21 cm absorption line depends only on the amount of cold gas along the line of sight and the covering factor of the radio source. Thus, for a compact background source one can detect CNM gas with 21 cm without any bias from dust content or metallicity. At 2, seven systems have been searched for 21 cm absorption and none have been detected (Kanekar & Chengalur 2003). Assuming = 200 K for the CNM gas, these authors estimated the filling factor of the CNM gas to be . This is consistent with what we derive from our H2 survey. Over the redshift range covered by our survey there are three cases for which information on 21 cm absorption and H2 content are available. To our surprise there seems to be no correlation between 21 cm absorption and H2 absorption.
The = 2.811 system toward PKS 0528255 show H2 absorption in two distinct components without any corresponding 21 cm absorption (Carilli et al. 1996). The upper limit on (21cm) gives (H i) cm-2 if the kinetic temperature is similar to (OPR) we measure. Thus H2 and 21 cm observations can be consistent with one another if no more than 20% of the total H i column density is associated with the H2 component. The = 1.944 system toward Q 1157014 (Wolfe, Briggs & Jauncy, 1981; and discussion above) and = 2.04 towards PKS 0458-020 (Briggs et al., 1989; Ge & Bechtold, 1999) show strong 21 cm absorption but no C i or H2 absorption. In these systems the absence of H2 and C i absorption could be either due to low density in the cold H i component or to the presence of higher ambient radiation field.
7.4 C ii∗ absorption
As pointed out before, C ii∗ is detected in all the systems in which H2 is seen. In fact, C ii∗ is also detected in the three systems that show 21 cm absorption discussed in the previous Section. C ii being the dominant ion of Carbon in the neutral gas, it is natural to expect C ii∗ associated with both 21 cm and H2 absorption. However, C ii∗ is readily detected in warm neutral gas and even in ionized gas. The interpretation of the origin of the C ii∗ absorption is not as straightforward as in the case of H2 and C i. Thus, the nature of systems that do not show 21 cm absorption and/or H2 absorption is a matter of debate. The systems that show C ii∗ in our sample are consistent with them originating from the CNM gas. However, the absence of C i and H2 (if we take the depletion as an indicator of the presence of dust) and the presence of Al iii are also consistent with C ii∗ absorption originating from the warm/partially ionized gas. Thus the frequency of occurrence of C ii∗ provides a liberal upper limit on the CNM covering factor. A detailed investigation taking into account the constraints on the ionization state of the gas based on N ii, Fe iii or Al iii will be important to derive the exact covering factor of CNM gas.
7.5 Star-Formation Rate
One of the main driver for the study of DLAs is to find out a way to recover the global star-formation history in a typical, moderately star-forming environment. The importance of DLAs in the paradigm of hierarchical structure formation can be appreciated from the fact that the mass density of baryonic matter in DLAs at is similar to that of stars at present epochs (Wolfe, 1995). Studies of Lyman- and UV continuum emission from galaxies associated with DLAs usually result in star formation rates (or upper limits) of a few M⊙ yr-1 (Fynbo et al., 1999; Bunker et al., 1999; Kulkarni et al., 2001).
Wolfe et al. (2003a, 2003b) have proposed a novel idea of using the C ii∗ cooling rate to infer the SFR in DLA galaxies. The idea is that if one assumes thermal equilibrium then the cooling rate inferred from C ii∗ should be equal to the heating rate (through UV photons, Cosmic rays etc.,) driven by the local star-formation activity. Their detailed study suggests the star formation rate density of DLAs at high- could be as high as that inferred based on Lyman break Galaxies. We confirm the presence of C ii∗ in 50% of the DLAs in our sample. However, it is clear from the above discussion that one needs to unveil the nature of the partially ionized gas in order to have a handle on the heating rates.
In the local universe, star-formation is always related to molecular clouds. If DLAs are star-forming regions then the local star-formation has to be related to the mass of the molecular gas. Our survey shows that 1320% of DLAs are associated with H2 in absorption. We have not detected CO in any of these systems and HD is detected in only one system (Varshalavich et al., 2000). Clearly the dark molecular clouds where stars form in our Galaxy are not seen along QSO lines of sight. The UV radiation field inferred from the H2 high-J excitation is similar to the Galactic mean field. Following Wolfe et al. (2003a,2003b) the SFR per unit comoving volume for DLAs is,
| (9) | |||||
where, is the average SFR per unit area at redshift and and are average physical cross-sectional, respectively, area, average projected area and number density of absorbers per unit absorption distance interval. is the fraction of DLAs in which the UV radiation field is similar to the Galactic UV background (i.e., 0.130.20). Here we use the fact that our H2 sample is a randomly chosen sub-sample of the whole population of DLAs and the presence of H2 is independent of (H i).
For an Einstein-de Sitter cosmology, for the mean redshift of our sample (Storrie-Lombardi & Wolfe, 2000). Assuming = 75 km s-1Mpc-1, and M⊙ yr-1 kpc-2 (typical for our Galaxy, see Kennicutt, 1998) we derive at = 2.5. This crude estimate already gives half the star formation rate density measured in Lyman break galaxies (Steidel et al., 1999). Recently, Hirashita & Ferrera (2005) have also arrived at similar conclusion. Thus it is of the utmost importance to understand the physics of the ISM in high- DLAs in order to derive the cosmic star-formation budget correctly.
acknowledgements
Results presented in this work are based on observations carried out at the European Southern Observatory (ESO) under prog. ID No. 65.P-0038, 65.O-0063, 66.A-0624, 67.A-0078, 68.A-0600 68.A-0106 and 70.A-0017 with the UVES spectrograph installed on the Very Large Telescope (VLT) at Cerro Paranal Observatory in Chile. RS and PPJ gratefully acknowledge support from the Indo-French Centre for the Promotion of Advanced Research (Centre Franco-Indien pour la Promotion de la Recherche Avancée) under contract No. 3004-3. GJF acknowledges the support of the NSF through AST 00-71180 and NASA with grant NAG5-12020. GJF and RS acknowledge the support from the DST/INT/US(NSF-RP0-115)/2002. GS would like to thank CCS, University of Kentucky for their two years of support. The hospitality of IUCAA is gratefully acknowledged.
References
- [1] Aracil, B., Petitjean, P., Pichon, C. & Bergeron, J. 2004, A&A, 419, 811
- [2] Bahcall, J. N., Joss, P. C., Lynds, R., 1973, ApJ, 182, 95
- [3] Bahcall, J. N., & Wolf, R. A. 1968, ApJ, 152, 701
- [4] Bergeron, J., & Boissé, P. 1991, A&A, 243, 344
- [5] Black, J. H., & van Dishoeck, E. F. 1987, ApJ, 322, 412
- [6] Briggs, F. H., Wolfe, A. M., Liszt, H. S., Davis, M. M., & Turner, K. L. 1989, ApJ, 341, 650
- [7] Browning M. K., Tumlinson J., & Shull J. M. 2003, ApJ, 582, 810
- [] Bunker, A. J., Warren, S. J., Clements, D.L., Williger, G.M., & Hewet, P. C. 1999, MNRAS, 309, 875
- [] Carilli C.L., Lane W., de Bruyn A.G., Braun R., & Miley G.K. 1996, AJ, 111, 1830
- [8] Cazaux, S., & Tielens, A. G. G. M. 2002, ApJ, 575, L29
- [9] Chaffee, F. H., Foltz, C. B., & Black, J. H. 1988, ApJ, 355, 584.
- [10] Chand, H., Srianand, R., Petitjean, P., & Aracil, B. 2004, A&A, 417, 853
- [11] Cui, J., Bechtold, J., Ge, J., Meyer, D. M., 2004, AAS, 20514501
- [12] Dalgarno, A., Black, J. H., & Weisheit, J. C. 1973, Astrophys. Lett., 14, 77
- [13] Dekker H., D’Odorico S., Kaufer A., Delabre B., & Kotzlowski H. 2000, in Iye M., Moorwood A. F., eds, Proc. SPIE Vol. 4008, Optical and IR telescope instrumentation and detectors, p. 534
- [14] Flower, D.R., & Watt, G. D. 1984, MNRAS, 209,25
- [15] Forrey, R.C., Balakrishnan, N., Dalgarno, Alex, & Lepp, S. 1997, ApJ, 489, 1000
- [] Fynbo, J. U., Moller, P., & Warren, S. J. 1999, MNRAS, 305, 849
- [16] Ge, J., & Bechtold, J. 1999, in Carilli C. L., Radford S. J. E., Menten K. M., & Langston G. I., eds., Highly redshifted Radio Lines, ASP Conf. Series, Vol. 156, p. 121
- [17] Ge, J., & Bechtold, J. 1997, ApJ, 477, 73.
- [18] Ge, J., Bechtold, J. & Black, J. H. A. 1997, ApJ, 434, 67
- [19] Ge, J., Bechtold, J., & Kulkarni, V. P. 2001, ApJ, 547, 1
- [20] Gerlich, G. 1990, JChPh, 92, 2377
- [21] Hirashita, H., Ferrera, A., 2005, MNRAS, 356, 1529
- [22] Haehnelt, M. G., Steinmetz, M., & Rauch, M. 1998, ApJ, 495,647
- [] Howk, J. C & Sembach, K. R. 1999, ApJ, 523, 141
- [23] Heiles, C. 2001, ApJ, 551, L105
- [] Izotov, Y, I., Schaerer, D., & Charbonnel, C. 2001, ApJ, 549, 878.
- [24] Jenkins, E. B., Jura, M., & Loewenstein, M. 1983, ApJ, 270, 1
- [25] Jenkins, E. B., & Peimbert, A. 1997, ApJ, 477, 265
- [26] Jenkins, E. B., & Shaya, E. J. 1979, ApJ, 231, 55
- [27] Jenkins, E. B., & Tripp, T. M. 2001, ApJ, 137, 297
- [28] Jura, M. 1975, ApJ, 197, 581
- [29] Kanekar, N., Chengalur, J., 2003, A&A, 399, 857
- [30] Keenan, F. P., Lennon, D. J., Johnson, C. R., & Kingston, A. E., 1986, MNRAS, 220, 571
- [31] Kennicutt, R. C. 1998, ApJ, 498, 541
- [32] Kulkarni, V. P. et al. 2001, ApJ, 551, 37
- [33] Le Bourlot, J., 2000, A&A, 360, 656
- [34] Le Brun, V., Bergeron, J., Boisse, P., & Deharveng, J. M. 1997, A&A, 321, 733
- [35] Launay, J. M. & Roueff, E. 1977, A&A, 56, 289
- [36] Lehner, N., Wakker, B. P., & Savage, B. D. 2004, Astro-ph/0407363
- [37] Ledoux, C., Petitjean, P., Bergeron, J., Wampler, E., & Srianand, R. 1998, A&A, 337, 51
- [38] Ledoux, C., Petitjean, P., & Srianand, R. 2003, MNRAS, 346,209
- [39] Ledoux, C., Srianand, R., & Petitjean, P. 2002, A&A 392, 781
- [40] Levshakov, S. A., Dessauges-Zavadsky, M., D’Odorico, S., & Molaro, P. 2002, ApJ, 565, 696
- [41] Liszt, H. 2002, A&A, 389, 393
- [] Lu, L., Sargent, W. L. W., Barlow, T. A., Churchill, C. W., & Vogt, S. S. 1996, ApJ, 107, 475
- [42] Mandy, M. E., & Martin, P. G. 1993, ApJS, 86, 199
- [43] Morton D. C., & Dinerstein H. L. 1976, ApJ, 204, 1
- [44] Meyer, D. M., Black, J. H., Chaffee, F. H., Foltz, G., York, D., 1986, ApJ, 308, 37
- [45] Péquignot, D., & Aldrovandi, S. M. V. 1986, A&A, 161, 169
- [46] Péquignot, D., Petitjean, P., & Boisson, C. 1991, A&A, 251, 680
- [47] Péroux, C., Petitjean, P., Aracil, B., & Srianand, R. 2002, New Astronomy, 7, 577
- [48] Petitjean, P., Ivanchik, A., Srianand, R., Aracil, B., Varshalovich, D., Chand, H., Rodrigues, E., Ledoux, C., & Boissé, P. 2004, C. R. Physique, 5(2004), 411-415.
- [49] Petitjean, P., Srianand, R., & Ledoux, C. 2000, A&A, 364, L26
- [50] Petitjean, P., Srianand, R., & Ledoux, C. 2002, MNRAS, 332, 383
- [51] Pettini, M., Smith, L. J., King, D. L. & Hunstead, R. W. 1997, 486, 665
- [52] Prochaska, J., & Wolfe, A. 1997, ApJ, 487, 73
- [] Prochaska, J., Wolfe, A. M., 1999 ApJS, 121, 369
- [53] Quast, R., Baade, R., & Reimers, D. 2002, A&A, 386, 796
- [54] Reimers D., Baade, R., Quast, R., & Levshakov, S.A. 2003, A&A, 410,785
- [55] Roth, K. C., Bauer, J., 1999, ApJ, 515, 57
- [56] Roy, N., Chengalur, J. N., Srianand, R., 2005, preprint
- [57] Savage, B. D., Drake, J. F., Budich, W., & Bohlin, R. C. 1977, ApJ, 216, 291
- [58] Savage B. D., Sembach K. R., 1996, ARA&A, 34, 279 J. Phys. B, 24, 2487
- [59] Shaw, G., Ferland, G., Stancil, P., Srianand, R., 2004, AAS, 204.6120
- [60] Shull, J. M., & van Steenberg, M. 1982, ApJS, 48, 95
- [61] Silva, A. I., & Viegas, S. M. 2002, MNRAS, 329, 135
- [62] Songaila, A et al., 1994, Nature, 371, 43
- [63] Spitzer, L. Jr., Cochran, W. D., & Hirshfeld, A. 1974, ApJS, 28, 373
- [64] Srianand, R., & Petitjean, P. 1998, A&A, 335, 33
- [65] Srianand, R., Petitjean, P. 2001, A&A, 373, 816
- [66] Srianand, R., Petitjean, P., & Ledoux, C. 2000, Nature, 408, 931
- [67] Srianand, R., Shaw, G., Ferland, G., Petitjean, P., Ledoux, C., 2005, MNRAS submitted
- [68] Sternberg, A., & Neufeld, D. A. 1999, ApJ, 516, 371
- [69] Steidel, C. C. et al., 1999, ApJ, 519, 1
- [70] Storrie-Lombardi, L. J., & Wolfe, A. M. 2000, ApJ, 543, 552
- [71] Takahashi, J. 2001, ApJ, 561, 254
- [72] Tiné, S., Lepp, S., Gredel, R., & Dalgarno, A. 1997, ApJ, 481, 282
- [73] Tumlinson, J., Shull, J. M., Rachford, B. L., et al. 2002, ApJ, 566, 857
- [74] Turnner, J., Kirby-Docken K., & Dalgarno A. 1977, ApJS, 35, 281
- [75] Varshalovich, D. A., Ivanchik, A. V., Petitjean, P., Srianand, R., & Ledoux, C. 2001, AstL. 27, 683
- [76] Vladilo, G., Centurión, M., Bonifacio, P., & Howk, J. C. 2001, ApJ, 557, 1007
- [77] Welty D. E., Hobbs, L. M., Lauroesch, J. T., Morton, D. C., Spitzer, L., & York, D. J. 1999, ApJS, 124, 465
- [78] Welty, D. E., Hobbs, L. M., & Morton, D. C. 2002, ApJS, 147, 61.
- [] Wolfe A. M., 1995. in QSO Absorption Lines, Proc. ESO Workshop, ed. G. Meylan (Berlin:Springer), 13
- [79] Wolfe, A. M., Briggs, F. H., & Jauncey, D. L. 1981, ApJ, 248, 460.
- [] Wolfe, A, M. & Prochaska, J, X. 2000, ApJ, 545, 603
- [] Wolfe, A. M. Prochaska, J. X., & Gawiser, E. 2003, ApJ, 593,215
- [] Wolfe, A. M., Gawiser, E., & Prochaska, J. X. 2003, ApJ, 593,235
- [] Wolfe, A. M., Howk, J. C., Gawiser, E., Prochaska, J. X., Lopez, S. 2004, ApJ, 615, 525
- [] Wolfire, M. G., Hollenbach, D., McKee, C. F., & Tielens, A. G. G. M. 1995, ApJ, 443, 152
- [] Wolfire, M. G., McKee, C. F., Hollenbach, D., & Tielens, A. G. G. M. 2003, ApJ, 587, 278