Molecular hydrogen in the diffuse interstellar medium at high redshift
Abstract
The physical conditions within damped Ly systems (DLAs) can reveal the star formation history, determine the chemical composition of the associated ISM, and hence document the first steps in the formation of present day galaxies. Here we present calculations that self-consistently determine the gas ionization, level populations (atomic fine-structure levels and rotational levels of H2), grain physics, and chemistry. We show that for a low-density gas ( 0.1 cm-3) the meta-galactic UV background due to quasars is sufficient to maintain H2 column densities below the detection limit (i.e N(H2) cm-2) irrespective of the metallicity and dust content in the gas. Such a gas will have a 21 cm spin temperature in excess of 7000 K and very low C i and C ii∗ column densities for H i column densities typically observed 50 per cent in DLAs.
We show that the observed properties of the per cent of the DLAs that do show detectable H2 absorption cannot be reproduced with only the quasar dominated meta-galactic UV radiation field. Gas with higher densities ( cm-3), a moderate radiation field (flux density one to ten times that of the background radiation of the Galactic ISM), the observed range of metallicity and dust-to-gas ratio reproduce all the observed properties of the DLAs that show H2 absorption lines. This favors the presence of ongoing star formation in DLAs with H2.
The absence of detectable H2 and C i absorption in a large fraction of DLAs can be explained if they originate either in a low-density gas or in a high-density gas with a large ambient radiation field. The absence of 21 cm absorption and C ii∗ absorption will be consistent with the first possibility. The presence of 21 cm absorption and strong C ii∗ without H2 and C i absorption will suggest the second alternative. The N(Al ii)/N(Al iii) ratio can be used to understand the physical properties when only C ii∗ absorption is present. We find in components that show C ii∗ (without H2) is less than that typically inferred from the components with H2 absorption. We also calculate the column density of various atoms in the excited fine-structure levels. The expected column densities of O i∗, O i∗∗, and Si ii∗ in a high-density cold gas is in the range of 10 cm-2 for log N(H i) and the observed range of metallicities. It will be possible to confirm whether DLAs that do not show H2 originate predominantly in a high-density gas by detecting these lines in very high S/N ratio spectra.
keywords:
Quasars: absorption lines-ISM: molecules-Intergalactic medium-Galaxies: formation1 Introduction
Damped Ly systems seen in QSO spectra are characterized by very large H i column densities, N(H i) cm-2, that are similar to those observed through gas-rich spiral galaxies. The importance of DLAs in the paradigm of hierarchical structure formation can be assessed from the fact that the mass density of baryonic matter in DLAs at zabs is similar to that of stars at present epochs (Wolfe 1995). Studies of Ly and UV continuum emission from galaxies associated with DLAs usually reveal star formation rates(SFR) (or upper limits) of a few M⊙ yr-1 (Fynbo et al. 1999; Bunker et al. 1999; Kulkarni et al. 2001; Möller et al. 2002 and 2004; Weatherley et al. 2005). The metallicity and depletion factor in DLAs are usually estimated from N(Zn ii)/N(H i) and N(Fe ii)/N(Zn ii) respectively (Lu et al. 1996; Pettini et al. 1997; Prochaska & Wolfe 2002; Ledoux et al. 2002a and Khare et al 2005). The inferred metallicities typically vary between log Z = 2.5 to 0 for zabs with a median of (Ledoux et al. 2003). The measured depletions range between 0 to with a median value of . If dust content is defined as , then the median dust content in a typical DLA is . This is less than 10 per cent of what is seen in the Galactic ISM for a similar neutral hydrogen column density. If the physical conditions in DLAs are similar to those in our Galaxy or the Magellanic clouds then H2 molecules should be detectable. There have been very few detections of H2 in DLAs (with ) despite extensive searches (Ge & Bechtold 1999; Srianand, Petitjean & Ledoux 2000; Petitjean, Srianand & Ledoux 2000; Ledoux, Srianand & Petitjean 2002b; Levshakov et al. 2002; Ledoux, Petitjean, & Srianand 2003; Reimers et al. 2003). Roughly 80 per cent of DLAs do not have detectable H2 (with cm-2).
The physical conditions in the H i gas can be probed by using the fine-structure absorption lines produced by the excited atomic species and the 21 cm transition. Apart from a few rare cases (for example Srianand & Petitjean 2001), C i is detected only in systems that show H2. The derived total hydrogen density () based on the fine-structure level populations of the heavy elements are usually large ( cm-3) (Ledoux et al. 2002b; Srianand et al. 2005; Wolfe et al. 2004). Like C i, C ii∗ absorption is detected in every case where one detects H2. However, it has also been seen with lower column densities in a considerable fraction of DLAs without H2 (Wolfe et al. 2003a; Srianand et al. 2005, Wolfe et al. 2004).
The search for 21 cm absorption in DLAs at zabs have mostly resulted in null detections with typical spin temperatures K (Table 3 of Kanekar & Chengalur (2003) and Table 1 of Curran et al. (2005) for a summary of all the available observations). There are 8 DLAs at zabs 1.9 for which redshifted 21 cm observations are available. Redshifted 21 cm absorption is detected for only two systems (zabs= 1.944 toward PKS 1157014 (Wolfe et al. 1981) and zabs= 2.0394 toward PKS 045802 (Briggs et al. 1989)). The measured spin temperatures are 865190 K and 384100 K. However, none of these systems show detectable H2 (Ledoux et al. 2003; Ge & Bechtold 1997). The DLA toward PKS 1157014 is special as the QSO shows broad absorption lines and the zabs of the DLA is close to the zem of the QSO. The physical conditions in this system may not be a good representative of the general DLA populations. Interestingly, H2 is seen at zabs= 2.8110 toward PKS 0528-2505, while no 21 cm absorption is detected in this system (Carilli et al. 1996; Srianand & Petitjean 1998). The lower limit on the spin temperature derived for this system is 710 K. However, the excitation temperature derived from H2 rotational levels is K (Srianand & Petitjean 1998; Srianand et al. 2005). This system is also special since zabszem . The radiation field of the QSO has a much stronger influence on the physical conditions in this DLA (Srianand & Petitjean 1998). The upper limits on the spin temperature derived for the rest of the systems are higher than 1000 K. The H2 content of these systems is not known.
Even though various properties of DLAs, listed above, have been investigated in detail (Matteucci et al. 1997; Prantzos & Boissier 2000; Howk & Sembach 1999; Izotov et al. 2001; Vladilo, 2001; Liszt 2002; Hirashita et al. 2003; Wolfe et al. 2003a,b; Calura et al. 2003; Wolfe et al. 2004), very few attempts have been made to investigate all of them in a single unified calculation. That is the main motivation of this paper.
2 Calculations
The main aim of our study is to investigate the physical conditions in high-z DLAs. In particular, our goal is to understand the equilibrium abundance of H2, the excitations of H2 and atomic fine-structure levels, the ionization state of the gas, and the 21 cm optical depth, self-consistently. In the Galactic interstellar medium (ISM) H2 is usually detected either in a diffuse medium irradiated by the UV background radiation field or in high-density photo-dissociation regions (PDRs) near OB stars. One can anticipate this to also be the case in DLAs. At high redshift the diffuse UV background from QSOs will be an additional source of UV radiation.
Recently there have been three attempts to model H2 in DLAs. Liszt (2002) uses two phase models similar to Wolfire et al. (1995) for this purpose. The models consider dust-free gas, so only the slow gas-phase H- + H H2 + e formation process is important. The second attempt by Hirashita et al. (2003) models DLAs as large protogalactic disks. The density and temperature in the gas are determined by ”non-linear hydrodynamic” effects. The radiation field is assumed to have a negligible contribution to the temperature of the gas and is used only for destroying the H2 molecules. Their model provides insight into the spatial distribution of H2. The third attempt by Hirashita & Ferrara (2005) uses simple H2 equilibrium formation models to study H2 in DLAs. Unlike Liszt (2002), no attempt is made to model ionization conditions of the gas and excitations of the fine-structure lines in the later two studies. The main aim of our paper is to use full self-consistent numerical calculations to understand (i) physical conditions in DLAs with H2 detections, (ii) the reason for the lack of H2 in most of the DLAs (iii) the origin of C ii∗ absorption frequently seen in DLAs and (iii) the absence of detectable 21 cm absorption at high redshifts (i.e z).
The availability of good quality observational data allows us to estimate the metallicity, depletion, H2 abundance, H2 excitation, and populations of fine-structure levels in C i and C ii (Ledoux et al. 2003; Srianand et al. 2005). One can hope to build more realistic models with all these in hand. This forms the prime motivation of this work. We study the ionization state, chemical history, and temperature of the gas using version 96 of Cloudy, last described by Ferland et al.(1998), and available at http://www.nublado.org. The details of the new H2 model are given in Shaw et al. (2005; hereafter S05). A comparison between predictions of our code and several independent calculations of PDRs can be found at http://hera.ph1.uni-koeln.de/roellig. A direct application of a PDR is given in Abel et al. (2004; hereafter A04). The calculations presented here take into account various heating (e.g. dust photo-electric heating cosmic ray heating etc) and cooling processes (for details see Ferland et al. 1998 and S05).
2.1 The micro-physics of grains :
We use the improved grain physics and molecular network as described in van Hoof et al. (2004), Ferland et al. (1994; 2002), and A04. The grain size distribution is resolved, and the formalism described by Weingartner & Draine (2001a; van Hoof et al. 2004) is used to determine the grain charge, temperature, photoelectric heating, and drift velocity self-consistently with the local radiation field and gas temperature. The extinction curves of grains in DLAs are not well known. We use a grain size distribution that fits the extinction curve of the diffuse interstellar medium with RV = 3.1 (Table 1 of Weingartner & Draine (2001b)). We emphasize that the physical treatment of grains, and their effects on the surrounding gas, is fully self-consistent, and does not rely on general fitting formulae, such as those in Bakes & Tielens (1994). The grain charge and temperature are determined by the local gas conditions (mainly the electron density and temperature) and radiation field (including the attenuated incident continuum and emission by the surrounding gas, mainly Ly ). The result is a grain temperature and charge that depends on grain size and material. The temperature then determines the rate of H2 formation on grain surfaces - we adopt the temperature-material-dependent rates given by Cazaux & Tielens (2002). The charge establishes the floating potential of the grain, which then sets the grain photoelectric heating rate.
2.2 Molecular hydrogen :
The detailed treatment of the micro-physics of H2 is described in S05. Here we will briefly mention some of those processes.
Generally, H2 forms via grain catalysis in a dusty cold-neutral gas. We use the total formation rate given by Cazaux & Tielens (2002) along with the size and temperature resolved grain distribution described in van Hoof et al.(2004). This is an exothermic process and H2 is formed in exited vibrotational levels, a process referred to as formation pumping. The results presented below use the state-specific formation distribution function given by Takahashi (2001) and Takahashi & Uehara (2001). By contrast, in an equipartition distribution function 1/3 of the binding energy is statistically distributed as internal excitation (Black & van Dishoeck 1987). Both produce an ortho-para-ratio (OPR) that is nearly 3.
H2 is formed by associative detachment from H- in a dust-free gas. This process is important in the clouds with lower dust content considered below. This is also an exothermic process and we use the state-specific formation distribution function given by Launay et al. (1991).
H2 is destroyed mainly via the Solomon process, in which the H2 molecule is irradiated by far UV (912Å 1200Å) radiation and is excited to higher electronic states. Approximately 10 per cent of these electronically excited H2 decay to the ground state continuum and are dissociated. The other 90 per cent populate the higher vibrotational levels of the ground electronic state. These cascade to lower vibrotational levels producing infrared emission lines, referred to as Solomon pumping. Formation pumping on grains is only 10 percent as effective as Solomon pumping when Solomon destruction is balanced by grain formation. Thus, the H2 populations are non-thermal if the electronic lines are optically thin and the Solomon process is dominant (hereafter referred to as the optically thin case), while the H2 level populations may be in LTE at the local gas kinetic temperature if the electronic lines are optically thick and the Solomon process is slow (hereafter referred to as the optically thick case).
Radiative decays between ortho and para states are not possible because of the different nuclear spin. However, exchange collisions with H, H+, H3+, and interactions on grain surfaces (below a certain critical temperature) can cause an ortho-para conversion. The column density ratio of J=1 and J=0 traces the kinetic temperature in a collisionally dominated gas but may fail to do so in a Solomon-process dominated region (Abgrall et al. 1992; Sternberg & Neufeld 1999; Roy, Chengalur & Srianand (2005)).
The formation rate on dust has the largest uncertainty among the many processes considered in our calculations. There are significant variations in this rate even in the case of the Galactic ISM (Browning et al. 2003). There are also substantial differences between collisional rates of H2 computed by different groups at low temperatures (S05). These uncertainties should be kept in mind while comparing our results with observations.
2.3 H i spin temperature:
It is commonly assumed that the N(H i) spin temperature, Ts, is equal to the gas kinetic temperature. The optical depth of the 21 cm transition is proportional to N(H0) / Ts, so is sensitive to the inverse of the gas kinetic temperature. The mean value of Ts we report here is TK with weighting by N(H0) / T. A separate paper (Shaw et al. 2005) discusses our treatment of Ts, and relationships between T, Ts, and H2 temperature indicators, in detail. In DLAs, Ts is usually estimated using the integrated optical depth in the 21 cm absorption line and N(H i) measured from Ly using
| (1) |
Here, is the fraction of the background radio source covered by the absorbing gas. Thus, low 21 cm optical depths could either mean high Ts or low . Even for , the derived temperature will be high if the mean N(H i) covering the extended radio source is lower than the measured one along the line-of-sight toward the optical point source (Wolfe et al. 2003a). Thus, observations will constrain either the physical conditions or the projected H i surface density distribution of the absorbing gas.
2.4 Fine-structure level population:
The ionization potential of C0 is close to the energy of the photons responsible for the H2 electronic band transitions. So, C i lines may be sensitive to the conditions in the H i H2 transition region. The fine-structure level populations of C i are sensitive to the gas pressure and the IR radiation field. Thus, populations of the excited fine-structure levels of C i allow an independent probe of quantities that control the physical conditions in the H i H2 transition region and the temperature of the cosmic microwave background (CMBR) (Srianand et al. 2000; Silva & Viegus 2002). The column densities of excited levels within the ground term of C i, C ii , Si ii, and O i are all calculated as part of the gas cooling function. All excitation and deexcitation processes, collisions, line trapping, destruction by background opacities, and pumping by the external continuum, are included. At high z the IR pumping is predominantly by CMBR pumping, although the diffuse IR radiation from grains also contributes.
2.5 Cloud geometry:

We envision the region where the absorption lines form as a layer or cloud of ISM gas exposed to several radiation fields. In keeping with much of the PDR literature, we assume a plane parallel geometry (Tielens & Hollenbach 1985; Draine & Bertoldi 1996; Wolfire et al. 1995, 2003; Wolfe et al. 2003a,b). We further assume that the gas has constant density for simplicity.
In the absence of ongoing star formation, the meta-galactic background UV radiation field, dominated by QSOs (Haardt & Madau 1996), will determine the physical conditions and abundance of H2. If there is ongoing star formation then a locally-produced stellar radiation field will also contribute. OB stars are very short lived, and so do not move far from their birthplace before dying. So, newly formed OB stars will be close to their parent molecular cloud throughout most of their lives. This geometry is assumed in the PDR references cited above.
Our main goal is to understand the physical conditions in the components with H2 and C i. Only the total H i column density is measurable in DLAs and the H i column density in the H2 component is generally unknown. So, we consider clouds with three values of N(H i); 1019, 1020, and 1021 cm-2. We assume the gas metallicity to be 0.1 Z⊙ and vary the dust-to-metal ratio in the range 0.001 to 0.1 (this corresponds to a range in (as defined in Section 1) of to ) of the galactic ISM.
We consider three ionizing continua; the meta-galactic radiation field at z = 2, the direct radiation field from an O star, and an O star continuum that has been attenuated by intervening absorption. The first mimics the case in which there is no in situ star formation. The second is observed in galactic star-forming regions - the OB stars are close to the molecular cloud and an H II region lies between them. This will be called the stellar case below. The third would be similar to a diffuse ISM exposed to the galactic background starlight, and will be called the diffuse case from now on.
Following the general practice in the PDR literature, we define the intensity of the incident UV radiation field using a dimensionless constant (as defined by Draine & Bertoldi 1996),
| (2) |
Here, is the energy density (ergs cm-3) of photons and = 1 for the Galactic UV field defined by Habing (1968). Thus provides the UV field strength in the units of Galactic mean UV field.
We use the observed metallicity, depletion, H2 abundance, and fine-structure excitations of C i, C ii, and N(C i)/N(C ii) to constrain either the particle density or the intensity of the radiation field. The 21 cm spin-temperature and the level populations of H2 are used for consistency checks.
2.5.1 Ionization and thermal structure :
In this sub-section we demonstrate the need for a composite self-consistent simulation of the gas in order to deduce the correct physical conditions using a pedagogical example. In Fig. 1 we show the ionization and thermal structure of a cloud irradiated by stellar and diffuse continua.
Panel (a) plots the temperature of graphite and silicate grains (for the range of sizes considered in our calculations) as a function of depth from the illuminated side. All the calculations we present in this work use the self-consistently estimated grain temperature for a range of grain sizes which are important for different processes such as photoelectric heating and formation of H2 on the grain surfaces.
The kinetic () and the electron density () are plotted in panel (b). In this work we present the H i weighted harmonic mean kinetic temperature as spin temperature (). Detail investigations of relationship between and under different physical conditions is described in Shaw et al.(2005).
Panel (c) plots the densities of H2, C0, C+, and C++ as a function of cloud depth. The ratio of carbon fine-structure levels are shown in panel (d). The electron temperature is high (104 K) and the electron density is nearly equal to the H+ density at the illuminated side of the gas for the stellar continua (panel b, solid line). A hydrogen ionization front occurs at a depth of 2.51018 cm, where T and ne fall. Across the PDR, T ranges between 300 800K and electrons are mainly donated by C+. The short-dashed lines show the results for the diffuse case. There is no H ii region, and so the entire cloud is a PDR. The physical conditions are nearly constant across the cloud, which does not have enough grain opacity to attenuate the incident continuum significantly.
The behavior of C0 in the case of the stellar case is as follows. In photoionization equilibrium, n(C0) is n(C+) n(C+) where is the recombination co-efficient. Here decreases by three dex across the ionization front, however the electron temperature changes by less than two dex. This leads to two orders of magnitude decrease in n(C0) across the ionization front (see upper panel). As the ionization potential of C0 is very close to the energy of photons that are responsible for the excitations of electronic states in H2, one expects both C i and H2 to originate from the same part of the cloud. This happens for the diffuse case. But in the case of the stellar case, a considerable fraction of C i originates in warmer gas that does not possess H2.
The predicted ratio of fine-structure level populations depends on the nature of the radiation field. The ratios are constant across the cloud in the case of the diffuse case. However, they strongly depend on the radiation field for the stellar case.
3 Ionization by the meta-galactic UV background:
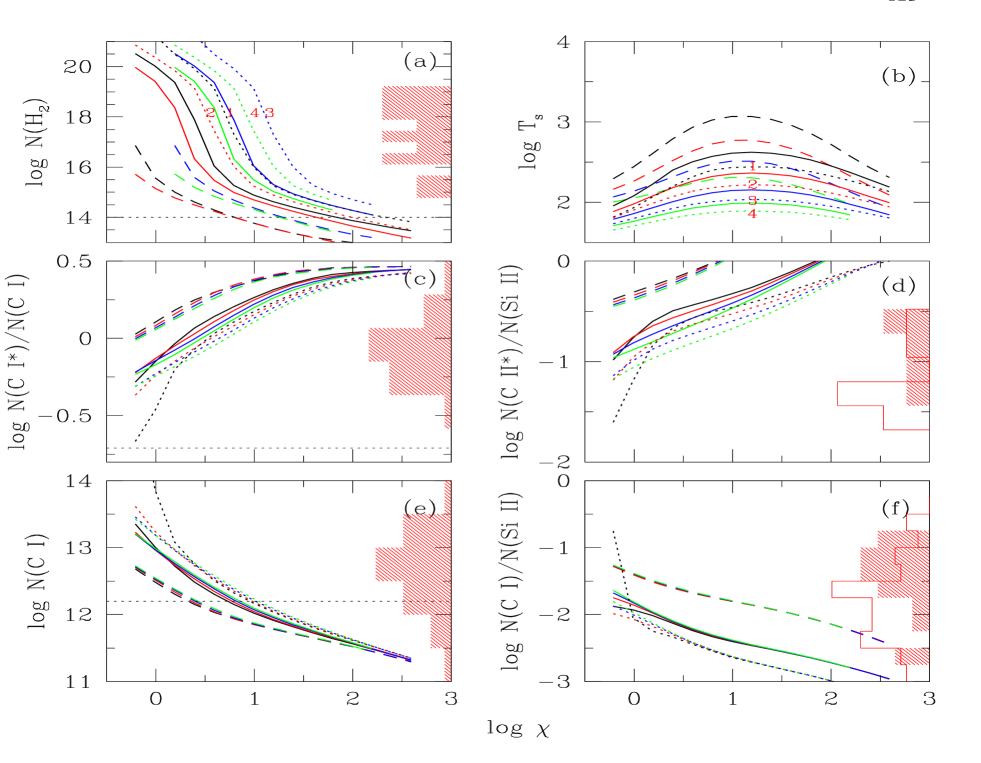
First we consider the case in which the only available radiation field is the meta-galactic UV background. We use the QSO dominated meta-galactic UV radiation field (Bgr) computed by Haardt & Madau (1996) and the cosmic microwave background radiation (CMBR) at z = 2 (assumed to be a black body with T = 8.1 K). The UV flux density in the Bgr at energies below 1 Ryd at z = 2 is roughly two orders of magnitude lower than the current mean Galactic UV field (i.e for the Bgr at z = 2). Some of the results from our calculations are presented in Figs. 2 and 3.
3.1 Gas pressure:
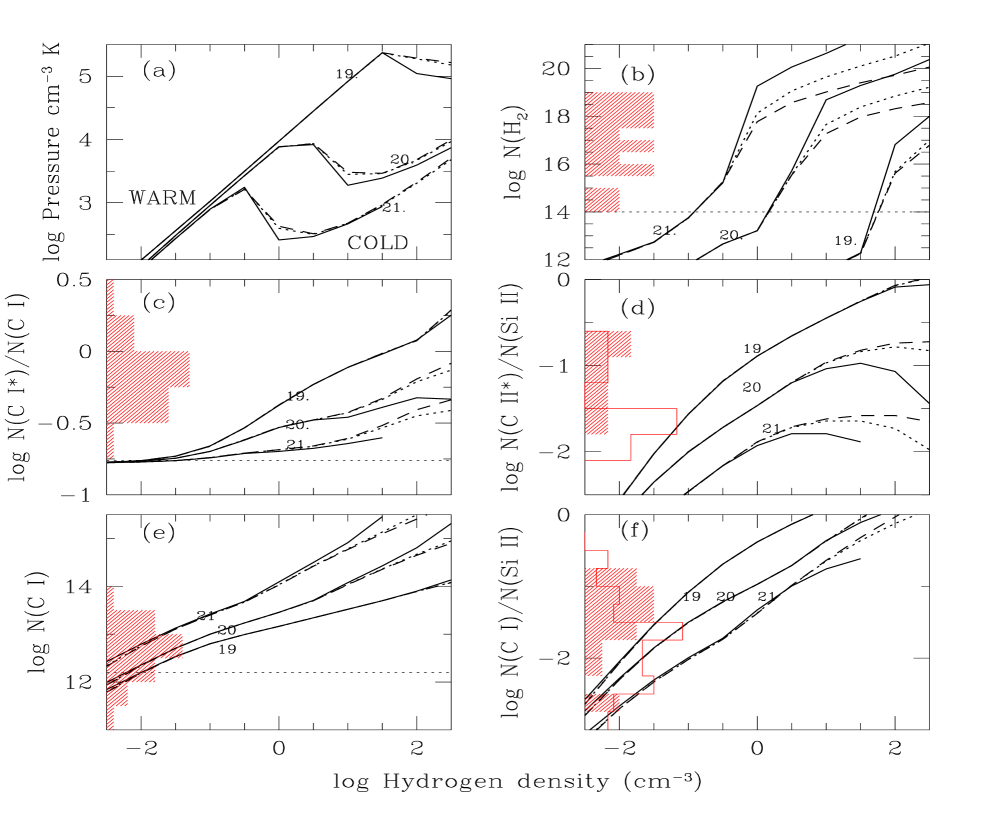
Panel (a) of Fig. 2 plots the mean pressure of the H i gas as a function of the total hydrogen density () for three different values of N(H i). Although ionization and thermal gradients exist between the H ii and H i regions, the H i gas is fairly isothermal. Thus, we use the neutral hydrogen weighted mean temperature to estimate the pressure. The continuous, short-dashed and long-dashed curves in all these panels are for dust to metallicity 0.1, 0.01, and 0.001 (i.e = 0.01, 0.001 and 0.0001) respectively . The regions of thermal stability occur for . The warm neutral medium (WNM) and cold neutral medium (CNM) of the two-phase medium are shown for reference. As an example, gas with 0.3 is thermally unstable for N(H i). The gas will be in the stable WNM phase for 0.03 and in the stable CNM phase for 1 . For reference, Fig. 6 of Wolfire et al. (1995) shows a similar phase diagram for various metallicities and dust content. The allowed minimum and maximum pressure in the two-phase medium are higher in our case than in the typical galactic ISM for a given column density, mainly because of the low metallicity and low dust-to-gas ratio (see also Petitjean et al. (1992), Lizst (2002), Wolfe et al. (2003a,b); Wolfe et al. (2004)). The main motivation for plotting the phase diagram from our calculations is to have a rough idea of the nature of the gas at different densities and to compare our work with published models. It is worth keeping in mind the fact that ISM is more complex than different phases in pressure equilibrium with one another. For example magnetic field, if present in DLAs, can provide confinement even if there is no thermal pressure equilibrium between different phases. Thus, we do not make any serious attempt to model the DLAs as two-phase systems.
3.2 H2 abundance:
In this section, we compare the predicted and measured N(H2) values (Ledoux et al. 2003) to determine the physical conditions in clouds both with and without observed H2.
3.2.1 Systems without H2 detections:
First we consider the cases where H2 is not detected. The predicted H2 column densities as a function of hydrogen density () are shown in panel (b) in Fig. 2. The horizontal short-dashed line gives the typical detection limit achieved in H2 surveys (i.e., N(H2)). The observed N(H2) is distributed uniformly between 1014 and 1019 cm-2 (The histogram in the left hand side in panel (b)).
From this figure it is clear that for a given N(H i), the column density of H2 is independent of when the density is low and the gas is mainly the WNM. This is mainly because in the low-density, high-temperature gas, H2 is formed predominantly through the H- process due to the low dust-to-gas ratio. It is also clear that the hydrogen density has to be higher than 0.1, 1.0, 30 cm-3 for N(H i) = 1021, 1020, and 1019 cm-2 respectively in order to detect H2. In the presence of an additional local radiation field (perhaps generated due to in situ star formation) these critical densities will be larger. Thus, if the gas in DLAs is mainly a stable WNM in ionization equilibrium with the Bgr, then the equilibrium H2 column density will be below the detection limit. This inference is independent of since the H- process dominates the H2 formation at low densities.
Fig. 2 suggests that if DLAs have a thermally stable CNM then the equilibrium abundance of H2 is high enough for the molecule to be easily detectable whenever is greater than 0.0001 or dust to metal ratio grater than 0.001 (The long-dashed curves in panel (b)). The H2 formation time-scale, which can be long, does not affect this result. A typical time-scale for forming H2 with molecular fraction is /2(H0). Here n(H0) denotes the atomic hydrogen density. According to Jura (1975) R cm+3 s-1 in the Galactic interstellar medium. Scaling this value by we have,
| (3) |
Assuming that all the hydrogen is H0, we find a typical H2 formation time-scale of yrs with = 0.0001 and for =10 cm-3. The age of the cloud has to be less than 105 yrs for us not to detect H2 with N(H2) cm-2 and . The hydrodynamical time-scales or pressure readjustment time-scales in the cold gas are usually larger than this value (Hirashita et al. 2003) due to the low sound speeds. Hence the typical age of the clouds is expected to be larger. Thus H2 should be detectable in a CNM with more than 0.0001 in the absence of any additional local radiation field.
3.2.2 Systems with H2 detections:
Now we focus on the systems with detectable H2. Ledoux et al. (2003) have shown that these systems usually have a high metallicity and dust content, i.e; ZZ⊙ and log . If the gas originates from a stable CNM, our calculations predict cm-2 (Panel (b) of Fig. 2) for N(H i) cm-2. The observed N(H2) is always smaller. Interestingly, the observed N(H2) values with are only reproduced in a very narrow density range, one that is usually thermally unstable in the standard two-phase models. This signifies that, for a uniformly distributed range of densities, a cloud with a random choice of , with N(H i) in the range of 1020 to 1021 cm-2, and with , will have either no detectable H2 or N(H2) cm-2. The probability of detecting H2 in the observed column density range of 1016 to 1019 cm-2 is very low. Thus, in order to understand the relatively low column densities of H2 in DLAs with clear detections, we need either the presence of an additional radiation field or for the cloud to be too young to produce H2. The existence of a local radiation field with intensity of the order or higher then the Galactic mean field has been suggested by various authors while discussing H2 in individual DLAs (Black et al. 1987; Ge & Bechtold 1997; Srianand & Petitjean 1998; Petitjean et al. (2000;2002); Ge, Bechtold & Kulkarni 2001; Ledoux et al. 2002b, Levshakov et al. 2002; Reimers et al. 2003).
3.3 Fine-structure excitations of C i and C ii:
In this section, we compare the column densities predicted for C i and C ii fine-structure excitations with the observations. Many of these results will not agree leading us to conclude that an additional source of radiation must exist in these systems. The time-scales to establish the ionization and populations within the fine-structure levels of neutral atoms are faster than the H2 formation time-scale, so this provides an indicator which should be in steady state.
3.3.1 C i absorption: detectability and degree of ionization
The N(C i)/N(C ii) ratio is a good tracer of the flux of photons driving the Solomon process in the cold neutral gas where H2 forms since the ionization potential of C0 overlaps with the H2 electronic bands. However, N(C ii) cannot be accurately determined in DLAs since the C ii line is usually saturated. Unlike C ii, the column densities of Si ii and S ii (which usually trace the same region as C ii (see Fig. 1)) are accurately measured using transitions with low oscillator strengths. Si and S are usually not highly depleted in DLAs (but see Petitjean et al. 2002 for a unique counter example). N(Si ii) can be used as a proxy to estimate N(C ii) (Srianand et al. 2000) by assuming the solar abundance of Si/C. Now we compare the predicted N(C i) and N(C i)/N(Si ii) with the observations. We plot N(C i) and N(C i)/N(Si ii) as a function of respectively in panels (e) and (f) of Fig. 2. The predicted values of N(C i) are much closer to the detection limit in a very low-density gas ( cm-3). As previously noted, our calculations are performed with Z = 0.1Z⊙, and the systems that do not show C i absorption tend to have metallicity in the range of (Srianand et al. 2005). Thus, the absence of C i is consistent with a cloud having cm-3, for the metallicity and N(H i) typically measured in these systems. Such a cloud will have log N(C i)/N(Si ii) (Panel (f) of Fig. 2). This is consistent with the measured upper limits, shown as the non-shaded histogram in panel (f), in most of the systems without detected H2. But N(C i) is more than an order of magnitude larger than the typical detection limit for cm-3. Thus, C i should be detectable in a high-density gas, even for low metallicity, in the absence of any internal radiation field. The predicted values of N(C i)/N(Si ii) in the high-density gas is usually higher than the observed upper limits (see Liszt 2002 and Wolfe et al. 2003a).
Next we concentrate on systems with detectable C i absorption. As noted in section 1, apart from only one case (zabs= 2.139 toward Tol 1037270), all the C i detections are from DLAs that also have H2. These systems have metallicities higher than we assume. Based on the detection of H2, we expect these systems to also have a higher density. Dense clouds ( cm-3) produce a higher value of N(C i) than observed. The measured ratio of N(C i)/N(Si ii) in these components is much less than our predictions for a high-density gas. Clearly higher radiation field is needed to produce N(C i)/N(Si ii) as measured in these systems.
The fine-structure populations of C i and C ii can also test the high density requirement for components with H2 detections. This will be discussed in the next subsection.
3.3.2 C i fine-structure excitation:
Here we use the observed N(C i∗)/N(C i) ratio to constrain in the components with H2. This ratio is regularly used to trace the pressure in a neutral gas (Jenkins & Tripp 2001; Srianand et al. 2005). We plot N(C i∗)/N(C i) as a function of hydrogen density in panel (c) of Fig. 2. The dotted line gives the expected value of the ratio if CMBR pumping at z = 2 is the only source of C i fine-structure excitation. The observed values of N(C i∗)/N(C i) (the histogram in the left hand side) are much higher than this, suggesting that collisions and UV pumping also contribute to the excitation. Most of the observed ratios are consistent with the predictions for for the considered range of N(H i) and . As noted above, for such a high-density gas, our calculations predict N(H2) and N(C i)/N(Si ii) higher than observed. We show below that the presence of an additional radiation field can reduce both of these.
3.3.3 Excitations of C ii fine-structure level:
Like C i, C ii∗ is always detected whenever H2 is present in DLAs. However, it is also seen in a considerable fraction of DLAs without C i and H2 (Wolfe et al. 2003a; Srianand et al. 2005). The observed column density of C ii∗ can directly give cooling rate (when the optical depth of [C ii] line is negligible) which can be used to constrain the star-formation rate once the physical conditions in th gas is known (Wolfe et al. 2003a; 2003b; 2004). C ii can originate from the CNM, WNM, and an ionized gas (i.e., H ii regions). Collisions with atoms are important for exciting C i∗, while electron collisions are important for the excitation of C ii∗. Thus, C ii∗ is expected to be detectable in systems with a warm and/or ionized gas even if the high-density CNM is absent (see Lehner et al (2004) and Srianand et al. (2005)).
C ii∗ is invariably detected in all the systems with log N(H i) and log ZZ⊙ irrespective of the absorption redshift. The observed column density is in the range 12.7log N(C ii∗)14.0 for systems at 1.5zabs2.5. The typical upper limit is N(C ii) 1013 cm-2 (Srianand et al. 2005). The calculated N(C ii∗)/N(Si ii) ratio is shown in panels (d) of Fig. 2. The shaded and non-shaded observed histograms in these panels are for the systems with and without H2 detection respectively. The observed range of N(C ii∗)/N(Si ii) in systems with H2 detections suggests they originate in a high-density gas. This is consistent with our conclusion based on H2 and N(C i∗)/N(C i).
The observed N(C ii∗)/N(Si ii) ratio tends to be smaller in systems without H2. As we have mentioned above, most of these systems have total N(H i) higher than 1021 cm-2. Thus, the systems that show C ii∗ will originate in clouds with 0.1 cm-3. Thus, we will require a radiation field in excess of the Bgr to suppress C i and H2 in a high-density gas.
3.4 H i spin temperature:

The thermal state of H i gas can be probed with the 21 cm spin-temperature (). The harmonic weighted mean temperature, a proxy for , is shown in panel (a) of Fig. 3. It is clear that if DLAs originate in a low-density WNM gas, then the spin temperature will be K. Thus, systems with no H2, C i, C ii∗, and 21 cm absorption are consistent with a low-density WNM in radiative equilibrium with the Bgr. The predicted spin temperatures are usually less than 100 K for clouds with N(H i) cm-2 in the CNM. Thus, we expect all DLAs to show detectable 21 cm absorption if they originate in a high-density CNM gas which covers the background radio source. Unlike C i or H2, the presence of an additional radiation field with h 13.6 eV may not reduce the 21 cm optical depth because it can not ionize hydrogen. The absence of 21 cm absorption in most DLAs suggests that they originate in a low-density warm medium. Our calculations also suggest that H i, H2, and C ii∗ should be found in systems with 21 cm absorption. The absence of C i and H2 in the few systems with 21 cm absorption is inconsistent with this prediction, again suggesting a local source of star light.
3.5 Effects of micro-turbulence and cosmic rays
We have neglected cosmic rays and turbulent motions in the models considered until now. In this section we investigate whether the inclusion of these processes help bring the Bgr models into agreement with observations.
The presence of micro-turbulence increases the mean free path for line photons and reduces line centre optical depth. We consider a turbulent velocity corresponding to a Doppler b parameter of 3 km s-1. This shows the greatest possible effect since the typical measured b parameters of H2 components are usually km s-1(Srianand et al. 2005; Ledoux et al. 2003; Petitjean et al. 2002; Srianand et al. 2000).
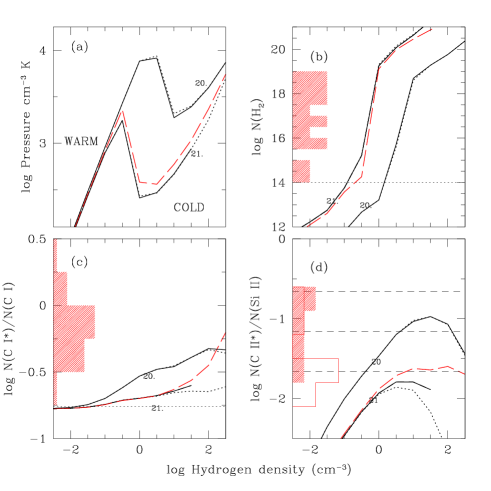
We consider two column densities, N(H i) = 1021 cm-2 and N(H i) = 1020 cm-2, along with = 0.01, and Z = 0.1 Z⊙. Some results are presented in Fig. 4. N(H2) changes very little for N(H i) = 1021 cm-2. However, the molecular column density is slightly lower in the case of N(H i) = 1020 cm-2. We would need b 3 km s-1 to produce a significant effect on N(H2).
[C i] 610 is optically thick at high column densities and the fine-structure level populations are influenced by line trapping. Turbulence increases the photon mean free path and reduces this trapping. The effect is clearly seen for the ratio N(C i∗)/N(C i) when N(C i∗) cm-2, which occurs when =10 cm-3 (Panel (c) of Fig. 4) for N(H i) = 1021cm-2. The effect is not seen significantly in the case of N(H i) = 1020 cm-2 since large column densities of N(C i∗) only occur for densities above 100 cm-3. As pointed out before, our calculations produce higher N(C i) than observed. N(C i) is invariably not saturated in most DLAs and 610 line trapping should not control the N(C i∗)/N(C i) ratio. Thus the inclusion of micro-turbulence can not rectify the problems of the Bgr models in simultaneously reproducing the H2 and C i observations.
The column density of C ii∗ is also affected by the presence of turbulent motions for N(C ii∗) cm-2 due to optical depth in the [C ii] 158 line. The observed N(C ii∗) is always higher than 3 cm-2 (Table 1 of Wolfe et al. 2003a; Srianand et al. 2005) in DLAs with N(H i) cm-2. Thus, line trapping effects may be important in producing the observed excitation of the C ii fine-structure level.
Cosmic rays add heat to a highly ionized gas and produce secondary ionizations in a neutral gas. H+ produced by cosmic ray ionization can cause ortho-para conversion and thermalize this ratio (Flower et al. 1994). We consider a cosmic ray ionization rate equal to the Galactic background ionization rate (; Williams et al. 1998). These results are presented with long-dashed lines in Fig 4. The enhancement in the gas temperature increases the column densities of C i∗ and C ii∗ in the high-density gas. The pressure of the neutral gas increases due to cosmic ray heating as expected. We also see a decrease in N(H2) at a given mainly because the increase in the gas temperature reduces the efficiencies in forming H2.
Background cosmic ray ionization does not produce drastic changes for the low-density gas where the Bgr dominates (Fig. 4). A much larger cosmic ray ionization rate is needed to have an desired effect.
3.6 Summary:
The main results for a cloud irradiated by the meta-galactic UV background radiation are:
-
•
The presence of the QSO dominated meta-galactic radiation field can maintain a H2 abundance lower than the detection threshold for cm-3, irrespective of the dust content and N(H i). The presence of any extra radiation field in addition to the meta-galactic radiation field, or a slower H2 grain formation rate, increases this critical density. Thus the absence of H2 in 85 per cent of DLAs is consistent with the low density models.
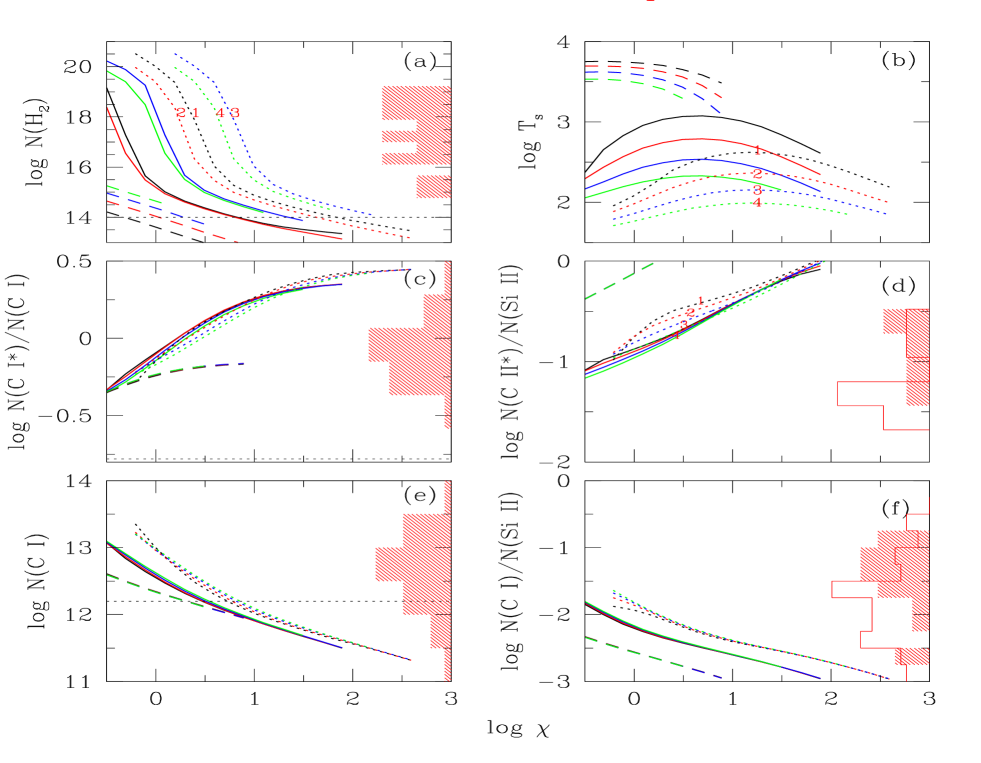
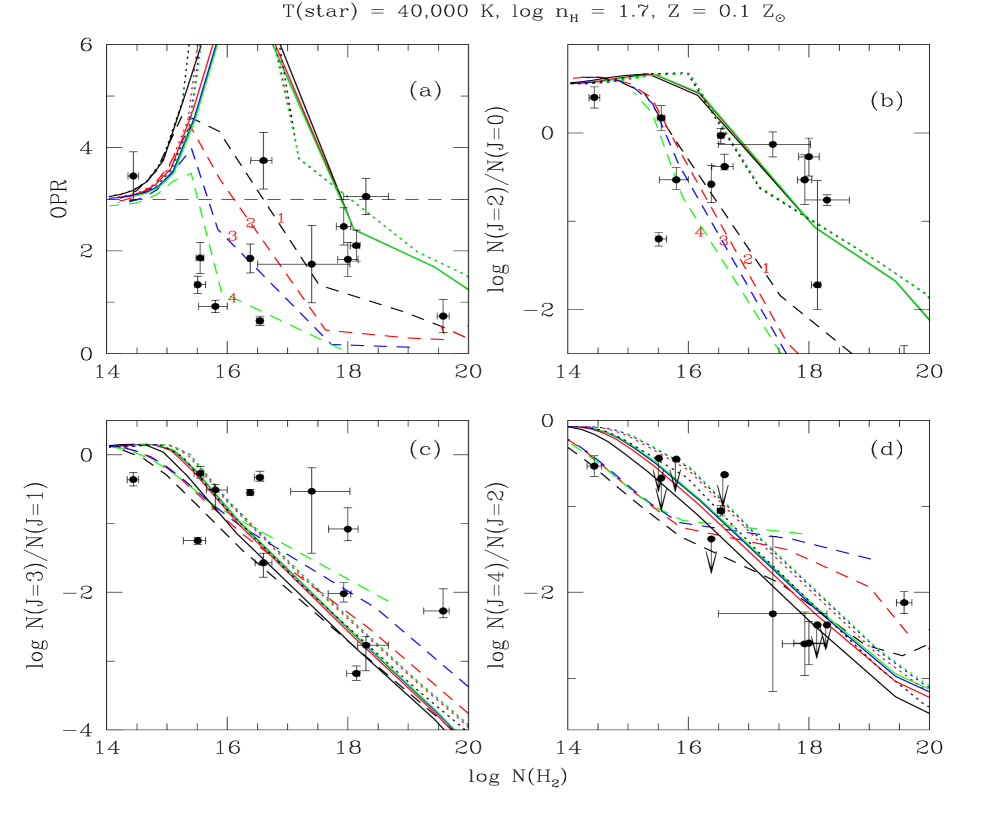
Figure 5: The effect of density: The results of calculations of a cloud in the radiation field of a star with a surface temperature 40,000 K (stellar case). The cloud has log N(H i) = 20.7, Z = 0.1 Z⊙. The long-dashed, continuous and short-dashed curves are for log = 0.0, 1.0, and 1.7 respectively. The labels 1,2,3, and 4 in the short-dashed curves are for log() = , and respectively. We mark these numbers only for the short-dashed curves. The dependences on has the same sense for other values of as well. The results are presented as a function of (see Eq.2). In each panel, the observed distributions are given as histograms (see caption of Fig. 2 for details). -
•
The detection of C i absorption is inevitable whenever our line-of-sight passes through the CNM. However, the density range that produces the observed N(C i∗)/N(C i) ratio also produces N(C i) and N(H2) higher than the observed values. An additional source of radiation with energies eV is needed to account for the low values of N(H2) and N(C i) in these systems.
-
•
Like H2, the absence of 21 cm absorption in most of the high-z DLAs can be naturally explained if DLAs originate mostly in the WNM. A low-density gas, corresponding to a WNM, has a very large spin temperate (Ts 7000 K). If DLAs are dominated by such a gas then 21 cm absorption will not be detectable.
-
•
A high-density gas has Ts 100 K. This produces strong 21 cm absorption along with high values of N(H2) and N(C i). The fact that N(H2) and N(C i) are not seen in the few systems that do show 21 cm absorption suggests that an additional radiation field is present in these systems as well. This is consistent with results of detail investigations of individual systems available in the literature (see references given in Section 3.3.1).
-
•
The too-large N(H2) and N(C i) column densities predicted at higher densities cannot be explained by micro-turbulent motions (up to 3 km s-1) or cosmic ray heating. However, the non-thermal motions affect the fine-structure level populations when the infrared lines become optically thick. The observed log N(C ii∗) is for N(H i) cm-2. The effects of line trapping of [C ii] becomes very important in these systems whenever the turbulent motions are small.
In the following section we explore the possibility of using in situ star formation to prevent the formation of too-large N(H2) in high-density systems. We wish to point-out that inclusion of radiation from the Lyman Break Galaxies (LBGs) can increase the flux of Lyman Warner band photons in the UV background by upto a factor 10 (see Haardt & Madau (2001)). This will make the Bgr radiation roughly 5 times less than the Galactic mean field. However, Section 4 shows that the required radiation field is much higher than this enhanced Bgr. In addition, this enhanced UV field will also produce bimodel distribution of N(H2) contrary to what has been observed.
4 Ionization by young stars:
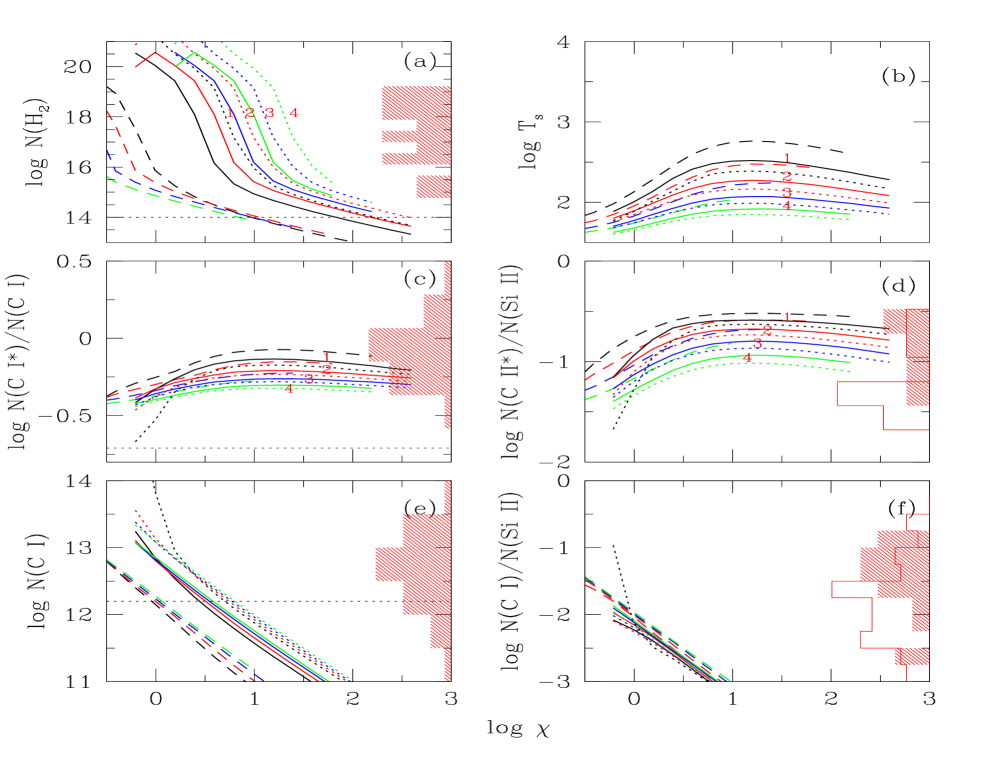
We add a stellar radiation field using a 40,000 K Kurucz’ model atmosphere in addition to the metagalactic radiation field discussed above. We consider direct stellar radiation and stellar continuum attenuated by N(H i) = cm-2. These two cases are denoted by “stellar” and “diffuse”, as discussed in Section 2.5. We showed that the meta-galactic UV background is sufficient to suppress the formation of H2 in low-density gas (i.e ). Thus, in this section we mainly concentrate on the high-density gas needed to account for the observed N(C i∗)/N(C i) ratio. We consider clouds with three values of N(H i) (, , and 1021 cm-2), three values of (1, 10, and 50 cm-3), and four values of ( , and ). In all of these calculations we assume Z = 0.1 Z⊙, turbulent velocity b = 3 km s-1. Cosmic-ray heating is not considered in the models described below.
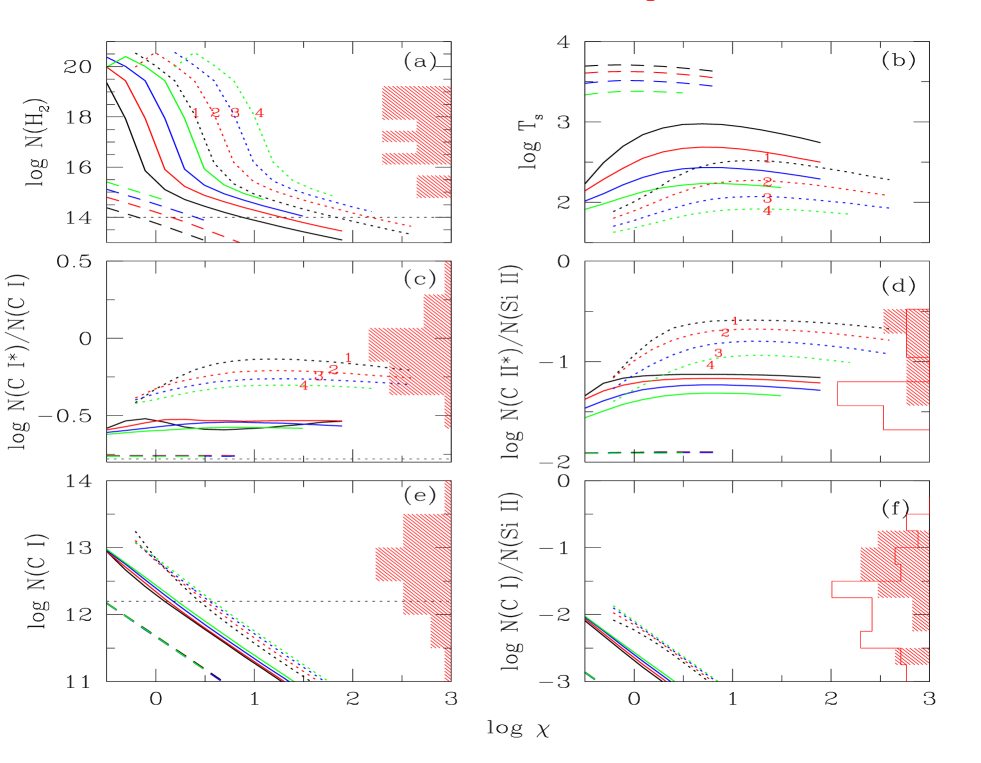
We present the results of model calculations as a function of (as defined in Eq. 2). The calculations for stellar case will have more high-energy photons than the diffuse one for the same value of . Therefore, for a given N(H i), the gas will be hotter and more ionized at the illuminated side of the cloud for the stellar case (see Fig. 1). We present the results of our calculations for the stellar and diffuse case for N(H i) = 5 cm-2 in Figs. 5 and 6 respectively. The effects of changing N(H i) are shown in Figs. 7 and 8.
4.1 H2 abundance:
| Models | ||||||||||
| Parameters | A | B | C | D | E | AE | BE | CE | DE | EE |
| log N(H i) | 20.7 | 20.7 | 20.7 | 20.0 | 21.0 | 20.7 | 20.7 | 20.7 | 20.0 | 21.0 |
| (cm-3) | 1 | 10 | 50 | 50 | 50 | 1 | 10 | 50. | 50 | 50 |
| log N(H i(ext)) | …. | …. | …. | …. | …. | 20.0 | 20.0 | 20.0 | 20.0 | 20.0 |
| 1,30 | 3,100 | 0.5,35 | 4,400 | 1,100 | 3,200 | 0.3,22 | 10,475 | |||
| Ts (K) | 3150,5600 | 100,1000 | 56,316 | 104,1260 | 48,275 | 2290,5248 | 90,900 | 54,339 | 40,560 | 66,195 |
| 0.09,0.05 | 2.74,0.27 | 4.90,0.87 | 0.53,0.04 | 11.42,2.00 | 0.12,0.05 | 3.04,0.30 | 5.07,0.81 | 1.37,0.10 | 0.83,0.28 | |
| log N(C i)/N(Si ii) | ||||||||||
| log N(C i∗)/ N(C i) | ,0.0 | ,0.3 | ,0.4 | |||||||
| log N(C ii∗)/N(Si ii) | ||||||||||
| log N(C i(tot)) | 12.0,13.4 | 11.9,13.0 | 11.8,12.8 | 11.0,13.4 | 11.8,13.0 | 11.0,13.0 | 11.0,13.0 | 11.0,13.0 | 11.2,13.0 | 10.6,12.0 |
| log N(O i∗) | 11.2,11.3 | 11.3,11.9 | 11.5,12.2 | 11.0,11.3 | 10.5,11.7 | 11.0,11.2 | 10.0,11.5 | 10.0,12.0 | 10.0,11.5 | 10.5,12.0 |
| log N(O i∗∗) | 11.2,11,3 | 11.3,11.9 | 11.6,12.2 | 11.0,11.3 | 10.5,11.5 | 11.0,11.3 | 11.0,11.53 | 110.0,11.5 | 0.0,11.3 | 10.0,11.7 |
| log N(Si ii∗) | 10.5,11.0 | 10.8,11.7 | 9.6,10.2 | 9.0,10.3 | 9.9,10.0 | 9.0,10.5 | 9.0,10.6 | 9.0,10.5 | ||
Panel (a) of Fig. 5 shows the predicted column density of H2 as a function of for the stellar case, log N(H i)=20.7, and 3 values of (long-dashed, continuous and short-dashed curves are for = 1, 10 and 50 cm-3 respectively). For each values of the results are presented for 4 different . For a given and , a higher dust content produces a lower N(H2). Naively we would expect N(H2) to increase with increasing due to an enhanced probability of H striking a grain, and increased shielding. However, the gas temperature increases for higher due to additional grain photo-electric heating (see the next section). This reduces the H2 formation rate as shown in Fig. 1 of Cazaux and Tielens (2002), so, N(H2) decreases.
The calculations reproduce the observed range of N(H2) for 1100, 1050 cm-3, and log N(H i) = 20.7 for the stellar case. The range becomes 1300 for the diffuse case (Panel (a) of Fig. 6). We find that with =1 cm-3, H2 should be detectable when and for the stellar and diffuse case respectively. Clearly, for a moderate local radiation field, , H2 will be detectable for 1 cm-3 and N(H i) cm-2. Higher is needed to produce detectable N(H2) for a lower N(H i) (Panels (a) in Figs. 7 and 8). The range of that is consistent with the observed range of H2 is summarised in Table 1 for all the scenarios discussed in this work. Observations of atomic fine-structure lines will further narrow down this range.
4.2 Spin temperature and 21 cm optical depth:
Panels (b) of Figs. 5 and 6 show the predicted Ts for log N(H i) = 20.7, 3 values of (Long-dashed, continuous and short-dashed curves are for =1,10 and 50 cm-3 respectively) and 4 values of . It is clear from all these panels that for a given (curves with similar line style), increases with increasing mainly due to photoelectric heating by dust grains (labels 1, 2, 3 and 4 on the short-dashed curve show models with in the increasing order). We also notice that for a given (say top-most curve with a given line-style) and the models with higher have lower Ts. This effect is very prominent in the stellar case. This is mainly because Ts is very large at the illuminated side of the gas in the stellar case. Panels (b) of Figs. 7 and 8 show the results with = 50 cm-3 for 3 different values of N(H i) (long-dashed, continuous and short-dashed curves are respectively for log N(H i)= 20, 20.7 and 21) for the range of . It is clear that for a given (say top most curves for different line-styles), clouds with lower N(H i) will have higher and hence lower . In the diffuse case (from Figs. 6 and 8) we notice that for a given and , Ts gradually increases with and saturates to a constant for large values of . The increase in with lower value of is the effect of photo-electric heating. At larger the grains become highly charged and total heating rate will become independent of (Bakes & Tielens, 1994; Weingartner & Draine (2001a)). Thus becomes independent of at large .
The range of predicted in the range of constrained by the H2 observations is summarised in Table. 1. This table also gives the expected 21 cm optical depth obtained using Eq. 1. It is clear from the table that for a high-density gas (i.e 10 cm-3) and log N(H i), 21 cm absorption should be detectable with an optical depth of . Especially for high , the 21 cm optical depth becomes as low as 0.05, even when =50 cm-3, for log N(H i) = 20. Thus, the absence of 21 cm absorption in high-density (or low temperature) systems will either mean that the average N(H i) along the radio source is much less than N(H i) seen along the optical sight-line (Wolfe et al. 2003a) or that the actual N(H i) in the high-density component is lower (Kanekar & Chengalur, 2003). Absence of H2 in the systems that show 21 cm absorption with low will indicate a radiation field much higher (i.e ). Our calculations also suggest that it is possible to detect H2 with low for moderate (see Models A & AE in Table. 1). For example, when log N(H i) and cm-3, the expected spin temperature is high (2300-5600 K) and . Thus, 21 cm absorption will either be weak or undetected in cases where H2 is detectable. Thus, the fine-structure excitation of C i or C ii with systems with detectable 21 cm absorption will lead to a better understanding of physical conditions in the gas. This is detailed in the following sections.
4.3 C i absorption: detectability and level of ionization:
Panels (e) and (f) of Figs. 5 and 6 plot N(C i) and N(C i)/N(Si ii) as a function of for stellar and diffuse cases respectively with log N(H i)=20.7. It is clear from the figure that the predictions for different (curves with same line-style) are very much identical. Both N(C i) and N(C i)/N(Si ii) are lower than those produced by the Bgr (Fig. 2) due to the presence of additional ionizing photons. A minor reduction in N(C i) and N(C i)/N(Si ii) for a given and is noted for the diffuse case compared to the stellar case. This can be easily understood using Fig. 1. N(Si ii) is nearly identical for both the radiation fields. Whereas N(C i) is less in the diffuse case as and are lower in these models compared to stellar case (see panel (b) of Fig. 1).
Here we concentrate on systems with H2 detections. The predicted N(C i) is well below the detection limit for log N(H i) = 20.7 and for the range of and the two stellar continua considered here. Thus, these models can explain the weak or non-detection of C i absorption in some of DLAs that show strong H2 absorption (zabs= 3.025 toward Q 0347383 with log N(H i)= 20.56; zabs= 2.595 toward Q 0405443 with log N(H i)= 20.90; and zabs= 2.811 toward Q 0528250 with log N(H i)= 21.10). N(C i)/N(Si ii) is lower than the measured ratio (in DLAs that show both H2 and C i absorption) for the range in allowed by H2 for both the diffuse and stellar case, and log N(H i) = 20.7. Based on the trend seen in Figs. 5 and 6 we may need 50 cm-3 and to explain the observed range in N(C i)/N(Si ii) for H2 components that show detectable C i absorption. However, such a model will over produce N(H2). This inconsistency can be solved by using a lower value of N(H i) and a higher (see Panel (f) in Figs. 7 and 8). In these plots long-dashed, continuous and short-dashed curves are the results for =50 cm-3 with log N(H i) = 20.0, 20.7, and 21.0 respectively. The total N(H i) measured for zabs= 1.968 toward Q 0013004 and zabs= 2.087 toward 1444+014 are consistent with log N(H i)20 in the H2 (and C i) components. The zabs= 1.962 system toward Q 0551-366 that shows three H2 components has a total log N(H i)=20.5. The zabs=1.973 system toward Q 0013-004 has 15 well detached C i components with a total N(H i)=20.8. Clearly a low N(H i) is probable in the components that show H2 and C i absorption. A cloud with a moderate radiation field (i.e ), log N(H i)=20.0, and = 50 cm-3 reproduces the observed range of N(C i)/N(Si ii), N(H2) and N(C i).
4.4 C i fine-structure excitation:
In this section we consider the fine-structure excitation of C i. Panel (c) of Figs. 5 and 6 shows N(C i∗)/N(C i) as a function of for log N(H i)=20.7. This ratio should be independent of if UV pumping is negligible because depends mainly on density and is roughly independent of . This happens for the diffuse case (Panel (c) of 6). Also the effect of is clearly evident in this case. However, in the stellar case, we find that the predicted N(C i∗)/N(C i) increases with increasing . We also notice that for a given and , the stellar case (Panel c in Fig. 7) with a lower N(H i) produces a higher value of N(C i∗)/N(C i). However, the dependence on N(H i) is very weak in clouds irradiated by the diffuse radiation field (see panel c in Fig.8). This implies that the ratio N(C i∗)/N(C i) will depend only on density for the diffuse case. However, the ratio N(C i∗)/N(C i) will depend on the strength of the radiation field (also see panel (d) in Fig. 1) in the stellar case.
Now we focus on systems that show detectable C i and H2. The predicted value of N(C i∗)/N(C i) is more sensitive to and weakly depends on N(H i) and for the diffuse case. The observed N(C i∗)/N(C i) is consistent with 10 cm-3. In the stellar case N(C i∗)/N(C i) depends on , N(H i) and . Clouds with log N(H i) = 20.7 reproduce the observed range in N(C i∗)/N(C i) for 150 cm-3 and the values of constrained by the H2 observations. As noted before, however, these models fail to reproduce the observed N(C i)/N(Si ii). Thus we require low N(H i) ( cm-3), high ( cm-3), and low () components in order to be consistent with the observed N(C i) and N(C i)/N(Si ii) ratio.
4.5 C ii fine-structure excitation:
Here we discuss the predicted C ii∗ in detail. Panel (d) of Figs. 5 and 6 shows N(C ii∗)/N (Si ii) for log N(H i) = 20.7 as a function of . The shaded histogram is the observed distribution of the systems with H2 components and the non-shaded histogram represents those systems that do not show detectable H2 and C i.
In the stellar case N(C ii∗)/N (Si ii) is higher for higher (see panel (d) in Fig. 5), and for a given the excitation is more for lower density (long-dashed, continuous and short-dashed lines are for = 1, 10, and 50 cm-3 respectively). The ratio depends only weakly on (different curves with different line-style) in the stellar case. All these trends are mainly because, for a fixed N(H i), a considerable fraction of C ii will originate from regions where hydrogen is ionized. The fraction of C ii originating from a hot ionized gas is higher in the case of lower and so the ratio is higher. This happens for the lower N(H i) case also (see panel (d) in Fig. 7 where long-dashed, continuous and short-dashed curves are for log N(H i) = 20., 20.7 and 21 respectively).
Results for the diffuse case are summarised in panels (d) of Figs. 6,8. It is clear that for a given , N(H i), and the ratio increases with increasing when the is small. However, at larger the ratio becomes independent of . This is due to the grain heating saturation for highly charged grains at high (see Weingartner & Draine, 2001a). This is also the reason for the lack of dependence of spin temperature on (see previous section). Thus, at high the ratios mainly depend on in the diffuse case. The models presented by Liszt (2002) use the fitting function given by Bakes & Tielens (1994) and show a monotonic increase in N(C ii∗)/N(C ii) with an increase in . Weingartner & Draine (2001a) (see figure 15 in their paper) show that the fitting function given by Bakes & Tielens (1994) over produce the photo-electric heating at high and because of this there will be an increase in N(C ii∗)/N(Si ii) with increasing even at large values of . As our treatment is very close to that of Weingartner & Draine (2001a) we clearly see the effect of saturation of photo-electric heating by dust grains in our models.
First we will concentrate on the systems with H2 detections. In the diffuse case the range in that is consistent with N(C i∗)/N(C i) also reproduces the observed range in N(C ii∗)/N(S ii). In the stellar case with log N(H i) = 20.7 the observed distribution of N(C ii∗)/N(Si ii) is consistent with in the range of 10-50 cm-3. The models with lower N(H i) tend to produce higher N(C ii∗)/N(Si ii) for a given and . A cloud with the low N(H i) and high that are required to reproduce N(C i)/N(Si ii) will over produce N(C ii∗)/N(Si ii). Thus the observed N(C ii∗)/N(Si ii) seems to favor the diffuse radiation field. This produces a model that reproduces all the other observations.
Now we concentrate on systems without H2 detections but showing C ii∗ absorption. There are two possibilities for the absence of H2 in these systems: Either (i) the gas has lower density and so is partially ionized with a higher temperature or (ii) the gas is at a high density in a strong UV field. In the diffuse case the ratio N(C ii∗)/N(Si ii) measured in systems without H2 are consistent with in the range of 1-10 cm-3 (see panel (d) of Figs. 6). Srianand et al. (2005) pointed out that Al iii absorption seen in these systems could be a useful indicator of the ionization of the gas. We will return to this issue while discussing the predicted N(Al iii)/N(Al ii) ratio (see Section 4.7).
4.6 Rotational excitation of H2:
Here we focus on the H2 rotational excitation predicted in our calculations.
4.6.1 The ortho-para ratio (OPR):
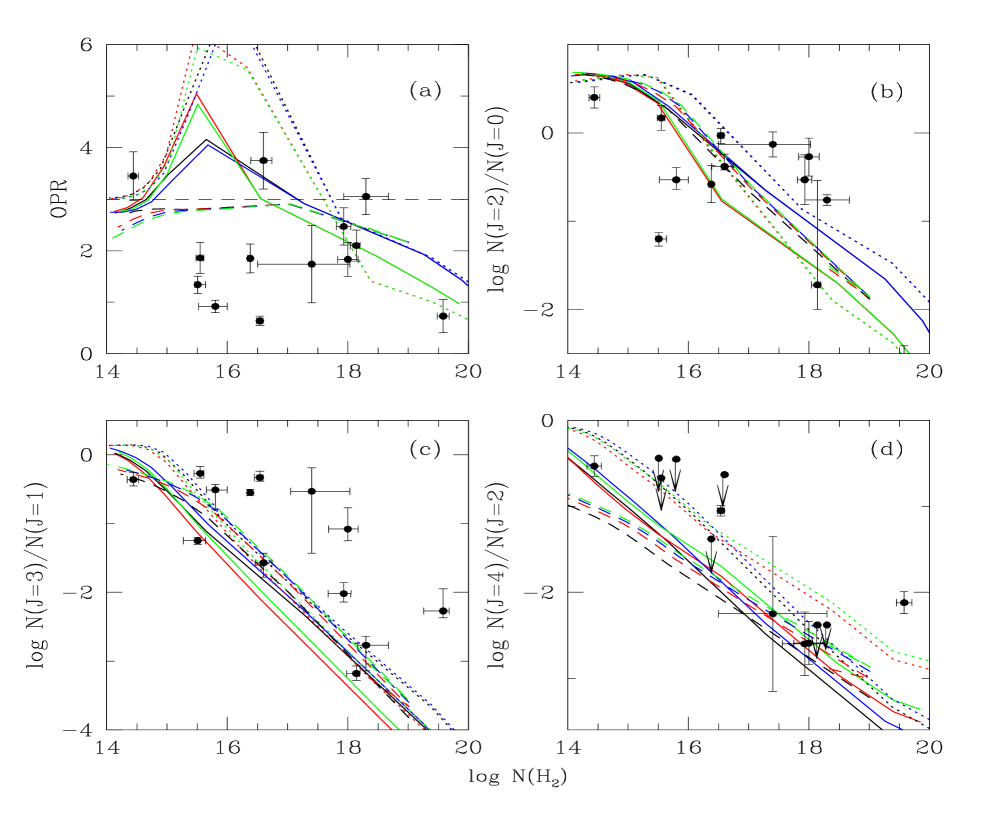
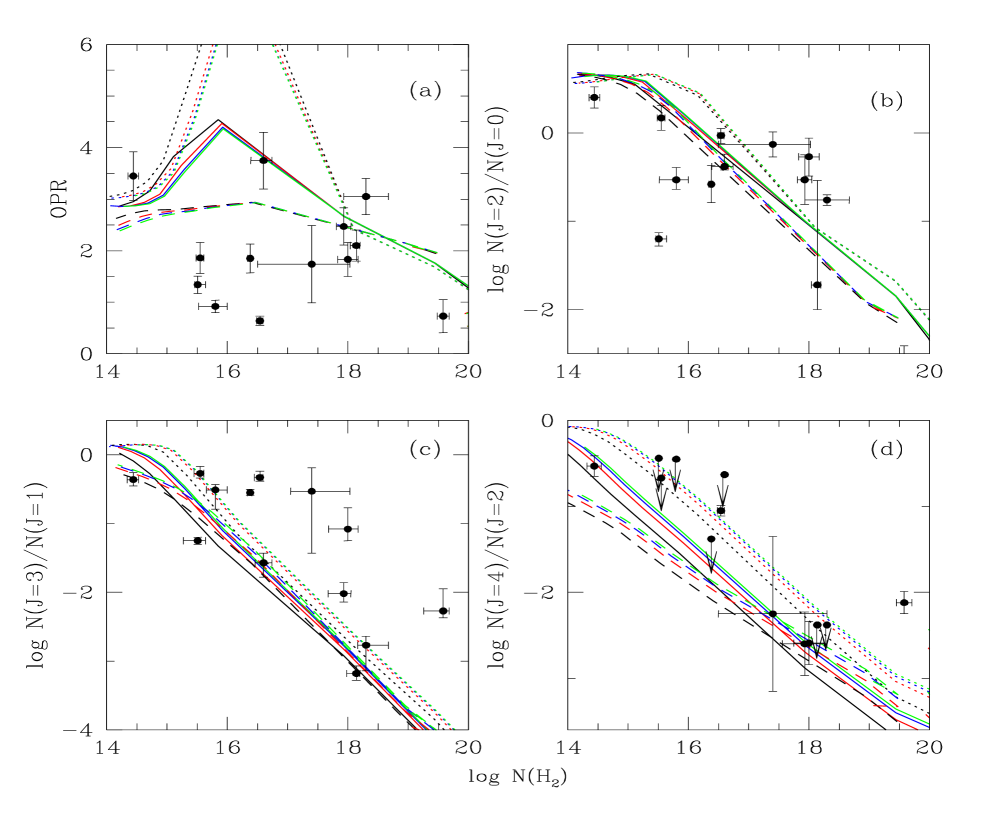
The OPR indicates the kinetic temperature when the H2 electronic bands are optically thick (i.e., log(N(H2)) 16; Tumlinson et al. 2002). Srianand et al. (2005) have shown that the OPR observed in DLAs are higher than those measured in Galactic ISM, LMC, and SMC sight lines. Here, we probe the reason for this difference. Panel (a) of Figs. 9 and 10 plots the OPR as a function of N(H2) for the stellar and diffuse cases respectively with log N(H i) = 20.7. For optically thin H2, when the Solomon process dominates excitations of H2, (i.e log N(H2) 16), the predicted OPR is close to 3 for clouds with log N(H i)=20.7. However, the OPR is greater than 3 for log N(H2) in the range of 16 to 18. At N(H2) the OPR traces the kinetic temperature of the gas.
Sternberg & Neufeld (1999) show that the high value of the OPR seen for intermediate N(H2) is because the electronic absorption lines of ortho-H2 become self-shielded at smaller column densities than para-H2. Thus, ortho-H2 exists while para-H2 is destroyed. Thus, we expect the OPR to be larger in the case of a higher radiation field when 16log N(H2)18. For a given N(H2) (in the intermediate range), the predicted OPR is higher for higher in models with log N(H i)=20.7. We also notice that, for a given N(H2) and , the models with lower N(H i) produce a lower value of the OPR (panel (a) in Fig. 11). Thus, the observed OPR with 16log N(H2)18 will require a lower N(H i) and higher . This is consistent with what we inferred based on the N(C i)/N(Si ii) ratio. A detail observation of an individual system confirms that the components with low OPR are consistent with a low value of N(H i) (see Table. 1 of Srianand et al. 2005). As an example, zabs= 1.96822 toward Q 0013-004 has the lowest OPR value measured in DLAs (0.640.09) and has log N(H2) = 16.77 and log N(H i). We notice that the kinetic temperature is in the range of K for the consistent models. This is slightly higher than the kinetic temperature range (60300K) derived using the OPR and assuming LTE assumptions (Srianand et al. 2005). We notice that the OPR does not track the kinetic temperature well in the intermediate N(H2) range. A careful investigation of this is presented elsewhere (Shaw et al. 2005). All of our calculations are in qualitative agreement with the OPR seen for log N(H2)18 components.
4.6.2 N(J=4)/N(J=2) and the radiation field:
Panel (d) of Figs. 9 and 10 plots N(J=4)/N(J=2) as a function of N(H2) for various log N(H i) and . The Solomon process controls these populations since the energy separation between these energy levels is far too large and collisional excitation is inefficient. This ratio indicates when the H2 column density is low (Jura 1975). For a given N(H2) with log N(H2) 16.0, the N(J=4)/N(J=2) ratio is larger for larger (i) , (ii) and (iii)N(H i) (panel d in Fig. 11). Apart from the two systems in Ledoux et al. (2003), absorption from the J=4 level of H2 is not detected. These two measurements and the upper limits for the optically thin systems are consistent with a radiation field as high as . There is very little difference between the diffuse and stellar continua since the excitation is mainly by electronic line absorption. In the optically thick cases, N(H2) in the J=4 level is populated mainly by formation pumping. No clear trend is present since formation pumping depends on various quantities.
4.6.3 N(J=2)/N(J=0) and N(J=3)/N(J=1):
The N(J=2)/N(J=0) ratio is more sensitive to collisional excitation than the population ratios of higher rotational levels. The observed and predicted N(J=2)/N(J=0) and N(J=3)/N(J=1) are plotted as a function of N(H2) in panels (b) and (c) of Figs. 9, 10, and 11 respectively. For the intermediate range of N(H2) the models that reproduce the OPR also roughly reproduce these two ratios. However, they do not explain the observed distribution for log N(H2). It is important to note that the J=2 and J=3 levels are mainly populated by cascades from high J levels following formation and UV pumping. The grain formation distribution function and grain surface interactions can affect the excitation of these high J levels. Although fitting the observed results may shed light on a gas with a different metallicity and dust composition than the Milky Way, such an exercise will divert us from our main theme and is left to future work.
4.7 N(Al iii)/N(Al ii):
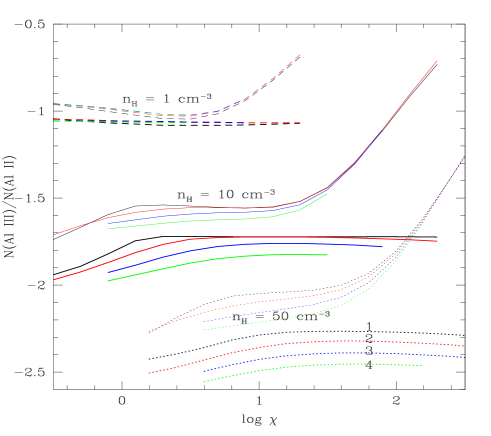
Here we focus on N(Al iii)/N(Al ii) produced with a stellar radiation field on top of the Bgr(Fig. 12). Al ii is mainly ionized by the high energy photons from the Bgr. In the diffuse case N(Al iii)/N(Al ii) ratio depends more on the density than on . This is also the case for stellar case when is small. However, the ratio increases with increase in for large values of (See thin curves in Fig. 12). Higher produces higher N(Al iii)/N(Al ii), especially in the case of a high-density gas. The ratio N(Al iii)/N(Al ii) is higher for lower N(H i) for a given and . Our calculations predict log N(Al iii)/N(Al ii) to be less than 1.5 for the ranges of , , and that reproduce the observed properties of the H2 components.
Srianand et al. (2005) have shown that most DLAs with log N(H i) 21 show C ii∗ absorption even when H2 and C i are clearly absent. All these systems also show Al iii absorption with log N(Al iii)/N(Al ii) higher than (Table 6 of Srianand et al. 2005). Our model calculations produce log N(Al iii)/N(Al ii) higher than for log N(H i) 20.7 when 10 cm-3. Clearly, the systems with only C ii∗ absorption without H2 and C i absorption need 10 cm-3 in order to have a N(Al iii)/N(Al ii) ratio at the detected level, since log N(H i) 21 in most of these components. This range in will also explain the observed N(C ii∗)/N(Si ii) in these systems (see Section. 4.5). This implies that C ii∗ absorption originates in a region of lower density and higher ionization compared to the components that produce H2 and C i absorption.
Lehner et al. (2004) show that a significant fraction of C ii absorption detected toward high latitude lines-of-sight in our galaxy originate from warm ionized medium (WIM). Using the profile coincidence between Al ii, Al iii, and photoionization models (computed using Cloudy) Wolfe et al. (2004) argue that C ii∗ in DLAs are unlikely to originate from WIM gas. They argue that a considerable fraction of Al iii can be produced from the gas that is by and large neutral (much like the models considered here). For the zabs= 1.919 system toward Q 2206-19 that show C ii∗ without H2 and C i absorption lines, Wolfe et al. (2004) derive a density of 1.6 cm-3. Srianand et al. (2005) discuss the profiles of absorption lines from different ionization states (including 21 cm absorption line) in the case of zabs= 1.944 system toward Q 1157+014 and conclude that a considerable fraction of C ii∗ absorption originate from gas at lower densities (i.e 1 cm-3). All these are consistent with our conclusion that density is lower (i.e cm-3) in the systems that show C ii absorption without H2 and C i compared to the ones that show H2 absorption (i.e = 10-100 cm-3).
4.8 Other fine-structure lines:
We predict the fine-structure level populations of O i and Si ii in addition to C i and C ii. The column densities of both O i∗ and O i∗∗ are in the range 2 cm-2, for the range of suggested by the C i and H2 observations (see Table.1). The oscillator strengths of O i∗ and O i∗∗ lines are low () and these lines are never detected in DLAs. Our calculations also predict N(Si ii∗) 2cm-2, consistent with the fact that Si ii∗ absorption is not detected in DLAs. It is most likely that one may not detect these lines directly even if the absorbing gas has a higher density due to their weakness. However, it may be possible to detect them by co-adding a large number of DLA spectra. Thus, one possible way to confirm the idea that most DLAs (with or without H2) originate in a high-density gas with star formation is to detect excited fine-structure lines of O I and Si II by co-adding many spectra as one does for metal lines in the Ly forest.
4.9 Summary
The main results for a high-density cloud in a stellar radiation field are:
-
•
The observed properties of DLAs with H2 are consistently reproduced by models with a local radiation field in addition to the QSO dominated BGR. Most of the observations of the H2 components (such as N(C i)/N(Si ii), N(C i∗)/N(C i) and N(C ii∗)/N(Si ii)) are consistent with lower N(H i) (i,e log N (H i)20 cm-2) and higher densities (10 (cm-3) 100). The median N(H i) in DLAs with H2 is 1020.8 cm-2, so in these systems only a fraction of the total N(H i) originates in regions with H2. The typical kinetic temperature ranges between 40 and 560 K.
-
•
We reproduce the observed range of the OPR in DLAs. The systems that are optically thin in the H2 electronic bands have a lower OPR, suggesting log N(H i)20, consistent with constraints from atomic species. The OPR , seen in some of the components with intermediate H2 electronic line optical depths, are produced by the different level of self-shielding in ortho and para H2. The absence of C i and H2 in J 4 levels in the case of a few optically thick H2 components are consistent with a higher in these clouds.
-
•
Our predictions, the measurements, and the upper limits on the N(J=4)/N(J=2) ratio in the optically thin H2 components are consistent with a radiation field as high as . This is consistent with the limits on the radiation field from the atomic species. The absence of N(J=4) lines in the optically thick H2 components are consistent with a low rate of formation pumping in these systems.
-
•
H2 and C i are not detectable if the radiation field is much higher irrespective of the model parameters. However, such clouds will be easily detectable in 21 cm absorption with spin temperature in the range of 100 to 1000 K. These clouds will also show very strong C ii∗ absorption. However, the column density of C ii∗ will strongly depend on the amount of ionized gas along the line of sight. Also these systems will show very strong Al iii absorption.
5 Discussion and Conclusions:
5.1 Nature of the radiation field:
Ledoux et al. (2003) show that detectable H2 absorption (N(H2)) is seen in 15-20 per cent of DLAs. We show that the observed properties of these systems are inconsistent with a gas irradiated by the meta-galactic UV radiation field. Our calculations suggest that these systems originate from a high-density gas ( cm-3) irradiated by a moderate diffuse UV radiation field (1 to 30 times that of Galactic ISM) and indicate ongoing star formation in these systems. The mean radiation field is determined by both the SFR and radiative transport. As the mean dust optical depth in DLAs will be smaller than that of Galactic ISM, the typical SFR in DLAs with H2 absorption can not be much larger than that seen in our Galaxy. Even if such a moderate star formation exists in most DLAs, they will still contribute appreciably to the global star formation rate density at higher redshifts (see Wolfe et al. 2003a,b; Srianand et al. 2005; Hirashita & Ferrara 2005).
5.2 Physical state of the H2 gas:
Our calculations with a diffuse radiation field suggest high densities in the H2 gas (i.e 10 (cm-3) ). The typical temperature of the clouds that are consistent with the observations are in the range 40 to 560 K. Our calculations simultaneously explain H2 abundance and fine-structure excitations of atomic species without opting for enhanced H2 formation rate on dust grains as required by analytical models of Hirashita & Ferrara (2005). The inferred range in temperature and densities are consistent with the physical conditions in the CNM gas. We show that if the cloud is irradiated by a diffuse interstellar UV background then N(C i∗)/N(C i) can directly probe the density of the gas. For radiation field with the ratio N(C ii∗)/N(Si ii) will also trace the density of the gas as photo-heating saturates at higher values of . However, if the cloud is close to the ionizing source N(C i∗)/N(C i) depends also on . The predicted values of N(C ii∗)/N(Si ii) in the stellar case with low N(H i) (as required by other observations) are much higher than the observed values. Thus, our calculations require that the H2 components in DLAs are ionized by a diffuse radiation field. Most of the observations are consistently reproduced with N(H i) = 1020 cm-2. This suggests that only a fraction of the total measured N(H i) is present in the H2 components.
5.3 DLAs without H2:
The observations show that systems without detectable H2 (i.e per cent of the DLAs) do not show C i absorption and also have very small values of . Roughly 50 per cent of the DLAs show detectable C ii∗ absorption. Our calculations suggest that the absence of H2, C i, C ii∗ and 21 cm absorption in a considerable fraction of DLAs could just be a consequence of a low-gas density in a moderate radiation field (irrespective of dust content of the gas). This more or less agrees with the Wolfe et al. (2004)’ conclusions that the systems with upper limits on C ii∗ absorption originate in a warm neutral medium (WNM)(also see Liszt 2002).
The observed N(C ii∗)/N(Si ii) in systems that show detectable C ii∗ absorption without H2 and C i is consistent with cm-3 (see Section 3.3.1). The absence of C i and H2 in these systems can be explained as a consequence of higher radiation field. Wolfe et al. (2003a; 2003b) in the framework of stable two phase medium argue that most of the C ii∗ absorption should originate from the CNM gas in order to have reasonable global star-formation rate density. We note 10 cm-3 in systems that show C ii∗ without H2 and C i so that the observed N(C ii∗)/N(Si ii) as well as ionization state of Al can be consistently reproduced (see Section 4.7). This range is consistent with the one measured by Wolfe et al. (2004) for zabs= 1.919 system toward 2206-10. Interestingly, the inferred density in these systems is less than that typically required to explain the property of H2 detected components (i.e ). Thus, it appears that the systems that show only C ii∗ seem to originate from lower density gas compared to the ones that also show H2 and C i absorption.
Unlike H2 and C i, an additional radiation field (with h eV) can not suppress 21 cm absorption in the high-density gas. Our calculations with predict a spin temperature in the range of K for a range of , , and N(H i) typically seen in DLAs. Thus, 21 cm absorption is definitely detectable. Over the redshift range that is similar to the range used by Ledoux et al. (2003) for H2 searches (1.9zabs), only two out of 8 DLAs show detectable 21 cm absorption (Kanekar & Chengalur 2003). The rest of these systems have a lower limit on the spin temperature in the range of 700-9000 K. Both of the systems with 21 cm absorption also show detectable C ii∗ absorption. Detail investigation of one of these systems (zabs= 1.944 system toward Q 1157+014) shows that C ii∗ originate not only from the gas responsible for 21 cm absorption but also from other components (Fig. 19 Srianand et al 2005). Clearly C ii∗ traces a wider range of physical conditions. There are few systems (e.g zabs= 3.387 toward Q 0201+11 and zabs= 3.063 toward Q 0336-01) that show detectable C ii∗ absorption without 21 cm absorption. The derived upper limits on spin temperatures in these systems will mean very low CNM fraction along the sight lines if the gas covers the background radio source completely (Kanekar & Chengalur, 2003). In the absence of VLBI observations, interpretation of these system will be very subjective (see Wolfe et al. 2003b for details). A careful analysis of Al iii/Al ii and N(C ii∗)/N(Si ii) in individual components is needed to get the contribution of ionized gas to the excitations of C ii∗.
Alternatively, one can use the fine-structure state populations of O i and Si ii that trace C ii very closely. Our calculations also compute expected fine-structure excitations of O i and Si ii. The expected column densities of O i∗, O i∗∗ and Si ii∗ are in the range cm-2 for the range of parameters considered in our calculations. It may be possible to detect these lines using pixel optical depth techniques that are used to detect metals in the diffuse low density IGM. Detection of such lines will put stringent constraints on density in these systems.
5.4 Conclusions:
In this article, we present calculations that self-consistently determine the gas ionization, level populations (atomic fine-structure levels and rotational levels of H2), grain physics, and chemistry. We show that for a low-density gas ( 0.1 cm-3) the meta-galactic UV background due to quasars is sufficient to maintain H2 column densities below the detection limit (i.e N(H2) cm-2) irrespective of the metallicity and dust content in the gas. Such a gas will have a 21 cm spin temperature in excess of 7000 K and very low C i and C ii∗ column densities for H i column densities typically observed in DLAs.
Calculations with a high-density gas in the presence of a local radiation field reproduce most of the observations of H2 components in DLAs. Thus our study clearly confirms the presence of CNM at least in 15-20% of the DLAs. We also show only fraction of total N(H i) is in the H2 components.
Unlike the components with H2, interpretation of systems that show only C ii∗ without additional constraints is not clear. This is because presence of free electrons can be more efficient in populating the fine-structure level of C ii. This can lead to a high value of inferred if the electron contribution is neglected. Using Al iii absorption we show that a gas that produces C ii∗ in systems without H2 has lower density than the ones with H2 absorption.
6 acknowledgements
GJF acknowledges the support of the NSF through AST 03-07720 and NASA with grant NAG5-65692. GJF and RS acknowledge the support from the DST/INT/US(NSF-RP0-115)/2002. GS would like to thank CCS, University of Kentucky for their two years of support. The hospitality of IUCAA is gratefully acknowledged. RS and PPJ gratefully acknowledge support from the Indo-French Centre for the Promotion of Advanced Research (Centre Franco-Indien pour la Promotion de la Recherche Avancée) under contract No. 3004-3.
References
- [] Abel N. P., Brogan C. L., Ferland G. J., O’Dell C. R., Shaw G., Troland T. H., 2004, ApJ, 609, 247 (A04)
- [] Abgrall, H., Le Bourlot, J., Pineau Des Forets, G., Roueff, E, Flower, D. R., & Heck, L. 1992, A&A, 253 525
- [] Bakes, E. L. O., Tielens, A. G. G. M. 1994, ApJ, 427, 822
- [] Black, J. H., Chaffee, F. H., Foltz, C. B. 1987, ApJ, 317, 442
- [] Black, J. H., van Dishoeck, E, F., 1987, ApJ, 322, 412
- [] Briggs F. H., Wolfe A. M., Liszt H. S., Davis M. M., Turner K. L., 1989, 341, 650
- [] Browning M. K., Tumlinson J., Shull J. M., 2003, ApJ, 582, 810
- [] Bunker A. J., Warren S. J., Clements D.L., Williger G.M., Hewet P. C., 1999, MNRAS, 309, 875
- [] Calura F., Matteucci F., Vladilo G. 2003, MNRAS, 340, 59
- [] Carilli C.L., Lane W., de Bruyn A.G., Braun R., Miley G.K., 1996, AJ 111, 1830
- [] Cazaux S., Tielens A.G.G.M., 2002, ApJ, 575, L29
- [] Curran, S. J., Murphy, M. T., Pihlstrom, Y. M., Webb, J. K., Purcel, C. R. 2005, MNRAS, 356, 1509
- [] Draine B. T., Bertoldi F. 1996, ApJ, 468, 269
- [] Ferland G. J., Fabian A. C., Johnstone R.M. 1994, MNRAS, 266, 399
- [] Ferland, G. J.; Korista, K. T.; Verner, D. A.; Ferguson, J. W.; Kingdon, J. B.; & Verner, E. M. 1998, PASP, 110, 761
- [] Ferland G. J., Fabian A. C., Johnstone R.M. 2002, MNRAS, 333, 876
- [] Flower, D.R., Watt, G. D. 1984, MNRAS, 209,25
- [] Fynbo J. U., Moller P., Warren S. J., 1999, MNRAS, 305, 849
- [] Gardner J. P., Katz N., Hernquist L., Weinberg D. H., 1997, ApJ, 484, 31
- [] Ge, J., Bechtold, J. 1997, ApJ, 477, 73.
- [] Ge J., Bechtold J., 1999 in Highly redshifted radio lines, Carilli, C. L., Redford S. J. E., Menten K. M., Longton G. I., eds. , ASP conf. Ser 156, 121.
- [] Ge, J., Bechtold, J., Kulkarni, V. P., 2001, ApJ, 547, 1
- [] Haardt F., Madau P., 1996., ApJ, 461, 20
- [] Haardt F., Madau P., 2001, /astro-ph/0106018
- [] Habing H., 1968, BAN, 19, 421
- [] Hirashita H., Ferrara A., Wada K., Richer P., 2003, MNRAS, 341,18
- [] Hirashita H., Ferrara A., 2005, MNRAS, 356, 1529
- [] Hollenbach D., McKee C.F., 1989, ApJ, 342, 306-336
- [] Howk, J. C & Sembach, K. R. 1999, ApJ, 523, 141
- [] Izotov, Y, I., Schaerer, D., Charbonnel, C. 2001, ApJ, 549, 878.
- [] Jenkins, E. B., & Tripp, T. M. 2001, ApJ, 137, 297
- [] Jura M., 1975, ApJ, 197, 575J
- [] Kanekar, N., Chengalur, J. N., 2003, A&A, 399, 857
- [] Khare, P., Kulkarni, V. P., et al. 2004, ApJ, 616, 86
- [] Kulkarni, V. P., Hill, J. M., Schneider, G., Weymann, R. J., Storrie-Lombardi, L. J., Rieke, M. J., Thompson, R. I., Jannuzi, B. T. 2001, ApJ, 551, 37.
- [] Launay, J. M., Le Dourneuf, M., Zeippen, C. J. 1991, A&A, 252, 842
- [] Ledoux C., Bergeron J., Petitjean P., 2002a, A&A, 385, 802
- [] Ledoux C., Petitjean P., Srianand R., 2003, MNRAS, 346, 209
- [] Ledoux C., Srianand R., Petitjean P., 2002b, A&A, 392, 781
- [] Lehner, N., Wakker, B., Savage, B. D. 2004, ApJ, 615, 767
- [] Levshakov S. A., Dessauges-Zavadsky M., D́Odorico S., Molaro P., 2002, ApJ, 565, 696
- [] Liszt H., 2002, A& A., 389, 393.
- [] Lu L., Sargent W. L. W., Barlow T. A., Churchill C. W., Vogt S. S., 1996, ApJ, 107, 475
- [] Matteucci F., Molaro P., Vladilo G., 1997, A&A, 321, 45
- [] Möller, P., Warren, S. J., Fall, M., Fynbo, J. U., Jakobsen, P. 2002, ApJ, 574, 51
- [] Möller, P., Fynbo, J. P. U., Fall, M., 2004, A&A, 422, 32
- [] Petitjean P., Bergeron, J., Puget, J. L. 1992, A&A, 265, 375
- [] Petitjean P., Srianand R., Ledoux C., 2000,A&A, 364, 26
- [] Petitjean P., Srianand R., Ledoux C., 2002, MNRAS, 332, 383
- [] Pettini M., Smith L. J., King D. L., Hunstead R. W., 1997, ApJ, 486, 665.
- [] Prantzos N., Boissier, S., 2000, MNRAS, 315, 82
- [] Prochaska J., Wolfe A. M., 2002, ApJ, 566, 68
- [] Reimers D., Baade, R., Quast, R., & Levshakov, S.A. 2003, A&A, 410,785
- [] Roy, N., Chengalur, J. N., Srianand, R., 2005, preprint
- [] Shaw G., Ferland G. J., Abel N. P., Stancil P. C., van Hoof P. A. M, 2005, ApJ, 624, 794 (S05), /astro-ph/0501485
- [] Shaw G., Ferland G. J., Srianand R., 2005, submitted to ApJ.
- [] Silva, A. I., Viegas, S. M., 2002, MNRAS, 329, 135
- [] Srianand R., Petitjean P., 1998, A&A, 335, 33.
- [] Srianand R., Petitjean P., 2001, A&A, 373, 816.
- [] Srianand R., Petitjean P., Ledoux C., 2000, Nature, 408, 931
- [] Srianand R., Petitjean P., Ledoux C., Ferland G., Shaw G. 2004, (Preprint)
- [] Sternberg A., Neufeld D.A., 1999, ApJ, 516, 371
- [] Takahashi J., 2001, ApJ, 561, 254-263
- [] Takahashi J., Uehara H., 2001, ApJ, 561, 843
- [] Tielens A. G. G. M., Hollenbach D., 1985, ApJ, 291, 722
- [] Tumlinson, J., Shull, J. M., Rachford, B. L., et al. 2002, ApJ, 566, 857
- [] van Hoof P.A.M., Weingartner J.C., Martin P.G., Volk K., Ferland G.J., 2001, in Challenges of Photoionized Plasmas, (G Ferland & D. Savin, eds) ASP Conf Ser 247, 363-378 (astro-ph/0107183)
- [] van Hoof P.A.M., Weingartner J.C., Martin P.G., Volk K., Ferland G.J., 2004, MNRAS, 350, 1330
- [] Vladilo G., Centurión M., Bonifacio P., Howk C., 2001, ApJ., 557, 1007
- [] Weatherley, S. J., Warren, S. J., Möller, P., Fall, M., Fynbo, J. U., Crisom, S. M. 2005, /astro-ph/0501422
- [] Weingartner, J.C., & Draine, B.T., 2001a, ApJS, 134, 263
- [] Weingartner, J.C., & Draine, B.T., 2001b, ApJ, 548, 296
- [] Williams J. P., Bergin E. A., Caselli P., Myers P. G., Plume, R. 1998, ApJ, 503, 689
- [] Wolfe A. M., 1995. in QSO Absorption Lines, Proc. ESO Workshop, ed. G. Meylan (Berlin:Springer), 13
- [] Wolfe A. M., Briggs F. H., Jauncey D. L., 1981, ApJ, 248, 460
- [] Wolfe A, M. ,Prochaska J. X., 2000, ApJ, 545, 603
- [] Wolfe A, M., Prochaska J. X., Gawiser E., 2003a, ApJ, 593,215
- [] Wolfe, A, M. & Gawiser, E., Prochaska, J, X., 2003b,ApJ, 593,235
- [] Wolfe, A. M., Howk, J. C., Gawiser, E., Prochaska, J. X., Lopez, S. 2004, ApJ, 615, 525
- [] Wolfire, M. G., Hollenbach, D., McKee, C. F., Tielens, A. G. G. M. 1995, ApJ, 443, 152
- [] Wolfire, M. G., McKee, C. F., Hollenbach, D., Tielens, A. G. G. M. 2003, ApJ, 587,