Spectral state transitions in low-mass X-ray binaries - the effect of hard and soft irradiation
In neutron star and black hole X-ray binaries the transitions between the two spectral states, hard and soft, signals the change between accretion via a hot advection-dominated flow(ADAF) and disk accretion. In a few cases the hard/soft transition were observed during the rise to the nova outburst, mostly only the soft/hard transition during the luminosity decrease. Surprisingly the luminosities at the second transition is always lower by a factor of 3 to 5. A model for this hysteresis was presented in a preceding paper: It was shown that this switch in the accretion mode at different mass accretion rates and therefore different luminosities is caused by the different amount of Compton cooling or heating of the accretion disk corona as it is irradiated by hard or soft radiation from the central light source, respectively. We now give detailed results on the dependence on hardness of this radiation and on radiation efficiency. We further discuss the influence of the inclination and a possible warping of the disk on the observed hysteresis.
Key Words.:
Accretion, accretion disks – black hole physics – X-rays: binaries – Stars: neutron – stars: individual: Aql X-1, GX339-4, XTE J1550-564, XTE J1650-5001 Introduction
Of great interest in black hole physics are the properties of the matter flow towards a compact object. Viscous differentially rotating gas flows determine the accretion processes around black holes, where viscous transport of angular momentum outward allows the gas to spiral inward towards the compact object. For a detailed discussion of the different possible modes of accretion see the work by Chen et al. (1995) and the review by Narayan et al. (1998).
The difference in observed spectra arising from the innermost accretion flow, can be used to study these accretion modes which are the same in stellar black holes or supermassive black holes in the centers of galaxies. Applications provide information for truncated thin disks in stellar mass systems as e.g. the black hole binary nova Muscae 1991 (Esin et al. 1997) as well as in low luminosity active galactic nuclei, e.g. M81 (Quataert et al. 1999). A rich documentation is present for accretion in low-mass X-ray binaries, containing a black hole or a neutron star primary (Chen et al. 1997, McClintock & Remillard 2005). The observations display the spectra of the X-ray radiation for different modes of accretion and correspondingly different spectral states: (1) a very hard spectrum (up to 100 keV) originating from the very energetic particles of a hot spherical advection-dominated flow (ADAF-type) (2) a soft spectrum (a few keV) radiated from the much cooler geometrically thin accretion disk. This is a simplified picture. In addition to the mentioned X-ray states of low and high luminosity also an “intermediate” state and a “very high” state can be found. McClintock & Remillard (2005) present an overview of the emission states of black-hole binaries where the combined X-ray and multi-frequency spectral characteristics of the sources are taken into account and a clearer definition of state names is suggested.
An interesting documentation of spectral changes are the transitions between hard and soft state observed for low-mass X-ray binaries, both neutron star and black hole systems (Tanaka & Shibazaki 1996), and also for high-mass X-ray binaries. The first observed change for a neutron star was found by Mitsuda et al. (1989) for 1608-522, and for a black hole system by Ebisawa et al. (1994), for GRS 1124-684, Nova Muscae 1991. A first modeling of the spectra was presented by Esin et al. (1997) using the concept of an inner advection-dominated accretion flow. Up to now the number of observations and the quality of spectra has very much increased, so that these data allow us to learn from the comparison of theoretical models with observations.
There is one special feature in the appearance of the transition of spectral states: considering an X-ray nova outburst light curve we see that the hard-soft transition does not occur at the same luminosity as the soft-hard transition. The latter happens at a luminosity lower by a factor of about 5. In recent work (Meyer-Hofmeister, Liu and Meyer 2005, hereafter MLM05) this surprising hysteresis could be explained as arising from the different amount of Compton cooling or heating acting on the accretion disk corona at the time of the state transition. During phases of low mass flow in the disk, as in quiescence and the early rise to outburst, the inner disk region is filled with an ADAF, the radiation is very hard and the hot photons lead to mainly Compton heating of the corona. If otherwise during the time around outburst maximum the mass flow rate in the disk is high, the thin disk reaches inward to the last stable orbit, the radiation is soft and the Compton effect acts as cooling of the corona. This difference in irradiation leads to a different vertical structure of the corona and a different amount of evaporation of gas from the disk.
In Sect.2 we summarize the observations for hysteresis. In Sect.3 we briefly describe the physics of our model for the interaction of disk and corona and the evaporation of gas from the cool disk. The computation of the vertical structure of the corona allows to study the Compton effect on the corona in detail and to evaluate the dependence on the hardness of the hard radiation. In Sect. 4 the results of the model calculations are shown. Since the irradiation from the inner region affects the evaporation rate, the accretion rate and the efficiency of radiation enter in the results. We compare with observations in Sect.5. The intermediate state between hard and soft spectral state is discussed in Sect.6, further in the discussion a possible effect of the inclination under which we observe a binary system in connection with flaring or warping of the disk. In Sect.8 the conclusions follow .
2 Observed hysteresis in lightcurves of X-ray binaries
Data for spectral state transitions in individual sources were already discussed in the first paper on hysteresis (MLM05). In Table 1 we summarize data on hysteresis now available in the literature. The values for the hysteresis given there are approximate values, either derived in the work referenced or deduced for the present paper from light curves and hardness ratios HR2 given in the literature (state transitions taken as occurring when HR2=(5-12keV)/(3-5 keV)= 1.5, McClintock & Remillard 2005). The existence of a hysteresis is well documented in the hardness-intensity diagrams but it is difficult to deduce the ratio between the luminosities at the transitions. The hardness used in these diagrams is different for different observations and it is difficult to deduce from this information the value of hysteresis. To deduce a reliable value for the hysteresis is difficult also due to the fact that the time of transition is not clearly documented, the hard/soft and even more the soft/hard transition take some time (as discussed in following sections). This means the values in Table 1 only show a range. We also refer to the description of spectral states in the review of McClintock & Remillard (2005, Sect.4.3): the low/hard (LH) and high/soft (HS) state correspond to our nomenclature hard and soft.
Historically the hysteresis effect was first pointed out by Mijamoto et al. (1995). A first detailed analysis of hysteresis in transient low-mass X-ray binaries was performed by Maccarone and Coppi (2003a), who discussed in detail the observations of Aql X-1 during the 1999 outburst, one of the best example, with two spectral transitions clearly documented at different count rates. For data and references of further interesting sources see Table 1. The source 4U 1543-47 (Park et al. 2004) was included because it has a classical X-ray nova outburst light curve. McClintock & Remillard (2005) show in their Fig. 4.2 a hard phase in the very beginning. Since the luminosity at outburst maximum is in the range of the Eddington luminosity the luminosity at the hard/soft transition, (expected at a few percent of this value) cannot be extracted from the data. The transition soft/hard is well documented.
| source | class | year | flux ratio: | keV band | references |
|---|---|---|---|---|---|
| name | hysteresis | ||||
| Aql X-1 | ns | 1999 | 7 | RXTE/PCA, 1-12keV | Maccarone & Coppi (2003a) |
| 2000 | 10? | RXTE/PCA, 2-60keV | Maitra& Bailyn (2004) | ||
| 4U 1705-440 | ns | 1999 | 4 | RXTE/ASM, 2-12keV | Muno et al. (2002) |
| GX 339-4 | bh | 1998 | 3.5 | RXTE/ASM, 3-12keV | Zdziarski & Gierliński (2004) |
| 2002 | 10. | RXTE/ASM, 3-12keV | Zdziarski & Gierliński (2004) | ||
| HID | RXTE/PCA, 3-21keV | Homan & Belloni (2005) | |||
| 4U 1543-475 | bh | 2002 | small? | RXTE/ASM, 2-12keV | McClintock & Remillard(2005) |
| RXTE/PCA, 3-25 keV | Park et al. (2004) | ||||
| RXTE/PCA+HEXTE, 3-200keV | Kalemci et al. (2005) | ||||
| XTE J1550-564 | bh | 1998 | around | RXTE/ASM, 1-12keV | Kubota & Done (2004) |
| 2000 | 2 | RXTE/CA+HEXTE 2-200 | Rodriguez et al. (2003) | ||
| 2000 | HID | RXTE/ASM, 1-12 keV | Maccarone & Coppi (2003a) | ||
| XTE J1650-500 | bh | 2001 | 5-10 | RXTE/PCA+HEXTE, 3-150 keV | Rossi et al. (2004) |
| HID | RXTE/PCA + HEXTE, 3-200 keV | Corbel et al. (2004) | |||
| HID | RXTE/PCA, 3-21keV | Homan & Belloni (2005) | |||
| GRS 1739-278 | bh | 1996 | 5 | RXTE/ASM, 2-12keV | McClintock & Remillard (2005), Borozdin et al.(1998) |
| H1743-322 | bh | 2003 | HID | RXTE/PCA, 3-21keV | Homan & Belloni (2005) |
| GRS 1748-288 | bh | 1998 | HID | RXTE/PCA, 1-12keV | Maccarone & Coppi (2003a) |
| about 10 | IRS-P3/IXAE, 2-18keV | Naik et al. (2000), McClintock & Remillard (2005) | |||
| XTE J1859+226 | bh | 1999 | HID | RXTE/ASM, 1-12 keV | Maccarone & Coppi (2003a) |
| HID | RXTE/PCA, 3-21keV | Homan & Belloni (2005) | |||
| XTE J2012-381 | bh | 1999 | HID | RXTE/ASM, 1-12 keV | Maccarone & Coppi (2003a) |
Notes: The sources listed as black holes in the class column are
confirmed black holes or black hole candidates. The values given for
the hysteresis in the table are approximate values (see
text). fast rise from low/hard to very high state, no reliable
luminosity value for the hysteresis, transition from low state
to intermediate state.
HID: a hardness-intensity diagram shows the hysteresis for these
systems (different energy bands, difficult to derive a hysteresis value)
RXTE= Rossi X-ray Timing Explorer with ASM= All Sky Monitor and
PCA= Proportional Counter Array
IRS-P3/IXAE= IRS -P3 satellite at the Indian X-ray Astronomy Experiment.
2.1 The hardness of observed spectra
Since the hardness of the radiation from the inner region has an essential influence on the evaporation process the hardness at the time of the change from hard to soft state is of interest. But only a limited number of hard spectra are available for the sources listed in Table 1.
Maccarone & Coppi (2003b) analyzed data from the May/June outburst 1999 of Aql X-1 and present a spectrum taken shortly before transition to the soft state. This spectrum ideally documents the irradiation at the state transition. We evaluated the mean photon energy as about 90 keV. The true value might be higher depending on the poorly known spectrum at keV. In the work by Muno et al. (2002, Fig.1) hard and soft colors for different sources are shown. The hard color of 4U 1705-440 at the hard/soft state transition seems comparable or slightly less than that of Aql X-1.
Wardziński et al. (2002) analyzed hard spectra of GX 339-4 taken by the soft -ray OSSE detector on board CGRO simultaneous with Ginga and RXTE observations. The energy range reaches up to several hundred keV. The source flux at the time the spectra were taken was about 1 percent of the Eddington luminosity, therefore close to a value where we expect the state transition. (Further discussion of these spectra by Zdziarski et al., 1998 and Zdziarski & Gierliński, 2004). The evaluation of the spectrum from 1997 leads to 100 keV. The large errors at high energies cause quite an uncertainty in the result.
For XTE J1550-664 a hard spectrum (PCA + HEXTE data, 18-200 keV) taken 16 days before the hard/soft transition of the outburst in 2000 is shown by Rodriguez et al. (2003). We evaluate about 90 keV for the mean photon energy (assuming no significant contributions at higher energy). An averaged hard spectrum taken during the 2000 outburst (Arefiev et al. 2004) is less hard.
Rossi et al. (2004) present a study of the 2001/2002 outburst of the transient source XTE J1650-500. The beginning of the outburst was well covered, but the hard/soft transition discussed could already be the transition to the very high state. A spectrum taken right before this transition (Rossi, private communication 2005) is not as hard as the spectra from other sources discussed above.
3 The spectral state transitions
3.1 The general picture
For the analysis of the spectral state transitions in low-mass X-ray binaries we take the commonly accepted picture for the two accretion modes: (1) accretion via an optically thick geometrically thin cool disk (cool compared to a coronal flow) or (2) an optically thin spherically extended hot flow, ADAF-type two-temperature solution. Usually at larger distance from the compact object the accretion flow always is of the first type mentioned, closer to the central object both types are possible. The radiation is dominated by the flow in the innermost region, that is a soft spectrum arises from disk accretion, a hard spectrum from the hot flow of energetic particles. X-ray novae are good candidates to study changes between the two modes, a hard spectrum in quiescence during mass accumulation in the disk and a soft one after a dwarf-nova type instability had triggered an outburst (Meyer-Hofmeister & Meyer 1999). The importance of irradiation had already been pointed out by de Kool & Wrickramasinghe (1999).
Caused by the interaction of disk and corona gas evaporates from the disk into the corona and flows in form of a hot advection-dominated flow. Thereby the mass flow rate in the thin disk is diminished. The evaporation rate increases with decreasing distance from the compact object, but reaches a maximum at certain distance. This maximum rate determines the switch between the accretion modes in the inner region. Only if the mass flow in the outer disk is larger than this value will the disk “survive” this reduction in mass flow and continues inward. Otherwise the disk becomes truncated at a certain distance depending on the mass flow rate, and from then on all mass flows inward via the coronal/ADAF flow. This truncation of the inner disk during phases of low mass flow rate has long been recognized to be an essential feature of disk evolution (Mineshige et al. 1998) which also appeared in numerical simulations (Cannizzo 1998, 2000 and Dubus et al. 2001). A recent systematic analysis of Done & Gierliński (2004) using all data available from galactic binary systems on changes of spectra and truncation radii as a function of the accretion rate confirms this picture.
3.2 The effect of irradiation on state transitions
In the work by Meyer et al. (2000) the interaction of disk and corona was approximated by a one-zone model incorporating the standard equations of viscous hydrodynamics (see also Liu et al. 2002). As became clear in the recent work on hysteresis (MLM05) Compton cooling and heating by radiation from the innermost region acting on the vertically extended corona is an important process. The hysteresis is mainly caused by the Compton cooling in the soft state, but irradiation in the hard state also plays an important role
Evaporation has three important features: (a) the rates increase towards smaller distance , (b) the rates have a maximum value at about several hundred Schwarzschild radii, and (c) from that distance on inward the coupling between electrons and ions becomes poor. Hard irradiation leads to higher mass evaporation rates, a higher maximal value, and therefore the spectral state transition at a higher luminosity than in the case of soft irradiation. (compare Fig.1 in MLM05). The harder the hard radiation is, the higher is the evaporation rate at maximum. Our recent computations were based on irradiation as hard as 100keV. Since the spectra observed for X-ray transients show quite a difference in hardness we take this into account for the evaluation of evaporation rates. As described in the foregoing paper (Sect. 4.3) the Compton cooling/heating rate per unit volume taken is the sum of Compton cooling and heating (inverse Compton and Compton effect).
| (1) |
with the Boltzmann constant, electron temperature, electron mass, velocity of light, electron particle density, Thomson cross section and the energy density of the photon field. At transition the dominant contribution comes from photons from the central source, those from the disk underneath can be neglected here. Also Compton cooling by photons of the secondary stars is generally negligible.
For the flux from the central region in the soft state we now take a slightly different form compared to that in MLM05. We replace ( scaleheight) by the term , where is the inclination angle under which the inner disk appears at height . The formulae then is
| (2) |
where is the luminosity of the central source, which is related to the central mass accretion rate as . The more detailed formula results in a less strong Compton effect than the earlier used expression and therefore a higher maximal evaporation rate.
4 Model calculations for hysteresis
In our computations we took a black hole mass (the results can be scaled for other masses and we show the results as measured in Eddington accretion rate with , electron scattering opacity and in Schwarzschild radius ). The viscosity has a strong influence on the results as shown in earlier work (Meyer-Hofmeister & Meyer 2001 and Liu et al. 2002) and also pointed out by Różańska & Cerny (2000). We use the value =0.3 supported by modeling of X-ray binary spectra (Esin et al. 1997), and also application to accretion disk evolution (Meyer-Hofmeister & Meyer 1999).
4.1 Evaporation rates – dependence on hardness of irradiation and radiation efficiency
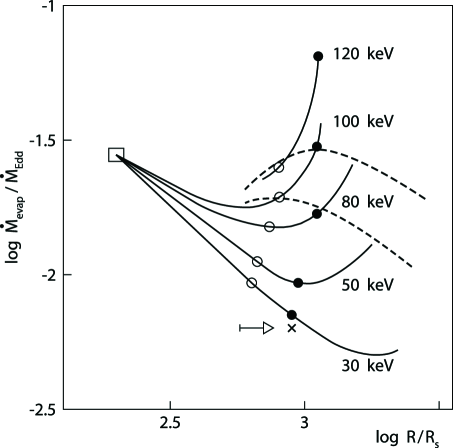
We determined the maximal evaporation rates (the rate determining the state transition) in the hard state for 30 to 120 keV mean photon energy of the radiation from the central source. The peak value has to be consistent with the accretion rate taken for the irradiation. For this consistency the efficiency with which radiation is produced from accretion enters. In the recent paper we had taken the value 0.05 for the efficiency in the hard state. In Fig. 1 we show the earlier results for 100 keV mean photon energy as dashed lines to illustrate the procedure to find the peak evaporation rate for the given efficiency or 0.025, marked by a filled or open dots. For the determination of each dot a series of evaporation rates at different distances from the center has to be evaluated to find the maximum (and the maximum has to be consistent with respect to the radiation produced in the central region). With this procedure we determined the maximal evaporation rates for different hardness and efficiency. The rates for and 0.025 are marked by filled and open dots. Along each solid curve the efficiency decreases towards zero, without irradiation (square).
The cross marks the peak evaporation rate for soft irradiation when the disk reaches inward to the last stable orbit. This is the case at the soft/hard transition. The difference between this value and the peak evaporation rate for hard radiation yields the hysteresis value.
4.2 Results for spectral state transitions
The peak evaporation rates for given hardness and efficiency of radiation provide the full picture of accretion rates which correspond to the spectral transitions from hard to soft state. Taking e.g. the radiation efficiency as 0.05, the filled dots in Fig. 1 give the truncation radii expected at the time of change from ADAF-type accretion to thin disk accretion. These radii are larger than those without Compton effect.
5 Comparison with observations
5.1 Hysteresis
In our section on observations (Sect.2) we pointed already out that hysteresis is clearly observed for several sources, but it is difficult to deduce the ratio of the luminosities corresponding to the two transition. There are several reasons. The hard/soft transition often is not well sampled, the spectral change takes some time (days to weeks), the exact time of transition is an interpretation of the data. A further uncertainty enters since different energy bands are used for the observations. The hardness-intensity diagrams presented by Corbel et al.(2004) and Homan & Belloni (2005) show the effect of the different hardness bands used for the hardness ratios (4.5-7.9)/(2.5-4.6)keV and (2-200)/(3-20)keV respectively. The observationally deduced ratios of luminosities at transition therefore only can show a range of values.
In Table 1 for GX 339-4 two hysteresis values are listed, 3.5 for the 1998 outburst and 10 for the 2002 outburst. The soft/hard transitions both took place at , a typical value, the hard/soft transitions at (1998) and (in 2002), respectively (Zdziarski & Gierliński 2004). How could such a difference arise? In our picture of state transition this always should occur at the same luminosity and should not depend on the history as argued by Zdziarski & Gierliński (2004). A possible explanation could be that the hard/soft transition at was already a change to the very high state and the then earlier transition from the low/hard to the soft state had occurred at a lower luminosity before the observations began (comparable to the situation in XTE J1650, see Sect. 2.1).
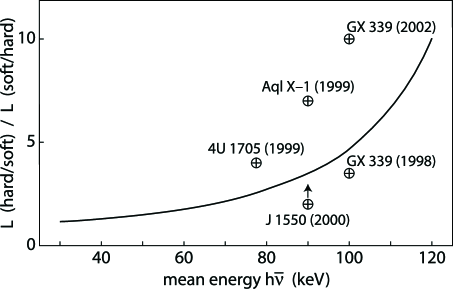
Our model calculations yield a clear dependence on hardness of the irradiation. In Fig. 2 we show this dependence together with luminosity ratios for some sources. As discussed in Sect. 2.1 only a few spectra taken at the time of the hard/soft transition are available. The results in Fig. 2 show the wide scatter. The hardness might be underestimated if radiation at higher energy bands, not included, would be present. Recent work of Ling (2005) reports observations of the gamma-ray emitting source GRO J1719-24 at energy bands up to several hundred keV. Similarities with other black hole X-ray transients, GRO J0422+32, and with Cyg X-1 are mentioned and it is not clear whether sources discussed here could also have X-ray emission in the gamma-ray energy region. Then a larger hysteresis would be expected.
5.2 Truncation radii
The fact that the state transitions occur at different luminosities leads to a dichotomy in the truncation radii for this luminosity interval where either states can be realized: the soft state in which the disk reaches to the last stable orbit, or, the hard state in which the disk is truncated according to the mass-flow rate - radius relation. The theoretically expected truncation radii during outburst rise and decline are shown in Fig. 2 of MLM05. Probably related to the truncation radii are the variations in power density spectra as discussed by Olive et al. (2003) for 4U 1705-44.
If we compare our results for the truncation radii obtained from the Compton effect on the coronal structure taken into account (MLM05 and this work) we find radii larger than expected from observations. Originally, the one-zone model for evaporation without including the Compton effect yielded a disk truncation at a few hundred Schwarzschild radii when the spectral transition occurs (Meyer et al.2000). In the paper by Yuan & Narayan (2004) the transition radii for several galaxies and galactic black hole sources are compared. Note that also sources in the hard state were included, for which the disk truncation at spectral state transition should be less or equal to the obtained value. The source XTE J1118 is a good example, the disk edge moves inward from values of to during quiescence to about 100 during outburst (where the source remained in the hard state, as can occur in case of low accretion rates (Meyer-Hofmeister 2004)). Gilfanov & al. (2000) estimated using frequency-resolved spectroscopy of Cyg X-1 that the inner radius of the reflector, presumably an optically thick accretion disk, lies at about 100 in the hard spectral state. Based on observations of Nova Mus 1991 Zycki & Done (1998) suggested that optically thick material within about 20-100 is generally present in the hard (low) state. The question arises whether a left over inner disk is possible together with the ADAF, a problem also connected with the intermediate state (see next section).
There is one parameter in our analysis which influences the truncation radii, the heat conduction. In forthcoming work we will evaluate the effect of a reduced heat conduction on the interaction of disk and corona. A farther effect on the coronal structure and the location of the disk truncation might come from magnetic fields reaching into the corona.
6 The intermediate state
In the foregoing sections we discussed only two spectral states, hard and soft. The observations document an intermediate state which can persist for quite some time and sometimes does not even lead to a complete transition. Consistent with the explanation of the other two states this state would correspond to an inner region with a comparable amount of mass flow accreting in the two forms, via a hot extended corona and via a standard thin accretion disk. To understand how this can happen a closer look at the coronal evaporation model is necessary: On top of a standard thin accretion disk always a corona forms in interaction with the disk, and this corona itself carries a part of the accretion flow. Analysis of the formation of the coronal flow/ADAF (Meyer-Hofmeister & Meyer 2003) yielded how this coronal accretion flow increases with decreasing distance from the black hole until it reaches a maximum at a fixed distance between 100 and 1000 Schwarzschild radii. Inside of this distance either a pure coronal flow exists (if the disk became already fully evaporated further outward) or the thin disk continues. What happens to the coronal flow above such a disk continuing inward after the hot flow has passed the distance where it reached its maximum? According to the calculations a disk region farther in has a weaker corona and carries less coronal flow. Therefore the part that can no longer be carried inward must condense into the cool disk underneath (Liu et al. 2004).
This condensation process allows interesting aspects for the intermediate state, which we will discuss here and in forthcoming work. Can all the former coronal flow condense so that the accretion in the innermost region occurs completely through the cool disk? This would say that in the interior we have either a pure coronal flow in the hard state or a pure disk flow in the soft state with no room for the various forms of the observed intermediate state. We suggest here a solution for this apparent contradiction between the theoretical model and the observations. This solution relies on the strong temperature dependence of the collisional coupling between the electrons and ions in the corona. For a cool corona these two species are well coupled and efficiently exchange energy during the thermal timescale for heating and cooling of the corona. In this case frictional heat released in the ion component is readily transfered to the electrons and conducted to lower denser levels and radiated away. This keeps the corona in a cool dense state as one goes to smaller radii until it would formally disappear altogether yielding a perfect self consistent soft state in the interior. If however the coronal temperature in the beginning is high, coupling between electrons and ions is poor and the electrons can not remove the frictional heat of the ions which will then stay near virial temperatures. The farther one gets inward the hotter the ions become and the poorer is the coupling between ions and electrons. This then will allow an intermediate state in which a hot coronal flow passes above and below, on both sides of a regular accretion disk with not much interaction between the two accretion streams.
Now it is very important that the regular coronal structure calculations just yield a beginning weakening of the coupling between electrons and ions at the distance from the black hole where the maximum coronal flow rate occurs (compare the shape of the hatched evaporation rates curve in Fig.1). If the accretion rate is higher than this maximum the disk does not fully evaporate and the coronal flow condenses effectively into the cool disk further in. If however the accretion rate drops to a value lower than the maximal possible coronal flow rate the disk evaporates over some distance outside of the radius of the evaporation maximum and a gap is formed. From the outer border of the gap on through the whole gap region the accretion continues inward in form of an ADAF. ADAF temperatures are near virial and are higher than those of coronae above a cool accretion disk at the same distance from the central black hole. Thus where the ADAF reaches the inner boundary of the gap i.e. the inner disk, it has a rather high temperature. This temperature is higher the farther in the gap extends because the virial temperatures increases with as the radius decreases. Correspondingly poor becomes the coupling between the electrons and ions and the flow is therefore only partially capable to cool off and to condense back into the disk. Though this partial condensation will feed the disk and keep it stretching all the way inward another part of the accretion flow will stay in the hot near virial flow above and below the disk and on arriving in the interior will give the hard spectral component to this intermediate state, the soft component being provided by the remaining disk flow.
If the accretion rate is quite close to the critical value (that is the maximal evaporation rate) or above it the hard power law tail will only constitute a small fraction of the spectrum and with the fluctuating accretion rate vary significantly. This would then account for the observed hard power law tail in the soft state.
7 Discussion
A number of factors can complicate a direct comparison between theoretical model and observations.
In the soft state the luminosity is radiated from a thin innermost accretion disk. When this disk lies in the equatorial plane the observer sees it foreshortened. The ”observed” luminosity is then inclination dependent and must be corrected for this projection in order to obtain the true luminosity at the soft/hard transition.
Further, should the inner disk be tilted out of the equatorial plane and precess, an additional and time varying aspect of the accretion disk enters and would simulate an apparent variation of the transition luminosity even when the true transition luminosity remains the same. Tilted and precessing accretion disks might be indicated by periodic shifts in color-intensity plots of low mass X-ray binaries.
Recently Narayan and McClintock (2005) investigated the effects of the inclination angles of black hole X-ray binary systems on their observational properties. Within their sample of 20 sources they found none with an inclination angle larger than and suggested that this absence of eclipsing sources is due to a flaring of the accretion disk by about , so that the disk permanently occults the X-ray source for the observer for all inclination angles that would allow us to see eclipses. Noisy light curves of sources with inclination between 70 and support this picture and indicate the presence of partial and time varying coverage of the central source. Such a partial occultation could affect the determination of the luminosities at both hard/soft and soft/hard transitions.
A perhaps more remote possibility which would however have a direct impact on the coronal evaporation mechanism itself and thus on the hysteresis is a warping of the inner accretion disk. This would change the aspect under which the corona sees the irradiating innermost disk surface and thereby change the strength of the irradiation.
8 Conclusions
As one follows the light curve of an X-ray nova from early rise to late decline, observations show a profound change in the source spectrum from a hard to a soft one on the rise and back from a soft to hard one on the decline. These changes occur at characteristic luminosities but remarkably, they are not the same for the two transitions. This hysteresis in the light curve could be understood as arising from the different type of irradiation coming from the innermost region, which is hard at the hard/soft transition but soft at the soft/hard transition: This difference leads to a different Compton cooling or heating of the coronal layers and results in a different coronal density and mass flow. The latter determines whether a disk can be truncated (hard state) or continues all the way to the black hole (soft state)(MLM05).
Now we have carried out further analysis and show how this hysteresis depends on the hardness of the irradiation. Unfortunately, only a few spectra taken at the moment of state transition are available. Also the contributions at the important high energies are uncertain. Thus the observational basis for a comparison is still fairly sparse. In addition theoretical uncertainties arising from the rough ”one-zone” modeling and the choice of its parameters together with the assumed planar inner disk geometry will enter into comparisons between observations and theoretical models.
Thus to verify in detail the theoretically well understood dependence on the hardness of the hard irradiation in the comparison with the data is difficult. It is difficult to determine when and at which luminosity the transition actually happened. Different observations are taken in different energy bands. Since the change from one state to the other takes some time this clearly also demands a more detailed understanding of the intermediate state between the hard and the soft state. In our first discussion here we find a remarkable coincidence of the distance where the coronal flow rate reaches its maximum with that of the least thermal coupling between electrons and ions which could perhaps explain the features of an intermediate state.
In conclusion one might take the explanation of the hysteresis as a further strong support for the coronal evaporation model. It is surprising how this very simplified model appears to catch essential features of the accretion flows around compact objects. More observations of spectral state transitions in different systems, broad spectral energy coverage and refinement of the theoretical modeling in the future might prove very fruitful.
Acknowledgements.
One of the authors, BFL, thanks the Alexander-von-Humboldt Foundation for the award of a research fellowship during which this investigation started. We would like to thank Sabrina Rossi and collaborators for providing a spectrum of XTE J1650 at the time of transition during outburst rise.References
- (1) Arefiev, V.A., Revnivtsev, M.G., Lutovinov, A.A. 2004, Astronomy Letters in print, astro-ph/0404460
- (2) Borozdin, K.N., Revnivtsev, M.G., Trudolyubov, S.P. et al. 1998, Astronomy Letters, 24, 435
- (3) Cannizzo, J.K. 1998, ApJ 494, 366
- (4) Cannizzo, J.K. 2000, ApJ 534, L35
- (5) Chen, W., Shrader, C.R., & Livio, M. 1997, ApJ 491, 312
- (6) Chen, X., Abramowicz, M.A., Lasota, J.-P., Narayan, R., Yi, I. 1995, ApJ 443, L61
- (7) Corbel, S., Fender, R.P., Tomsick, J.A. et al. 2004, ApJ 617, 1272
- (8) de Kool, M., & Wickramasinghe, D., 1999, MNRAS 307, 449
- (9) Done, C., & Gierliński, M. 2004, In: Stellar-Mass, Intermediate-Mass, and Supermassive Black Holes, eds. K. Makishima & S. Mineshige, Progr. Theor. Phys. Suppl. 155, 9
- (10) Dubus, G., Hameury, J.-M., & Lasota, J.-P. 2001, A&A 373, 251
- (11) Ebisawa, K., Ogawa, M., & Aoki, T. 1994, PASJ 46, 375
- (12) Esin A.A., McClintock, J.E., & Narayan, R. 1997, ApJ 489, 865
- (13) Gilfanov, M., Churazov, E., & Revnivtsev, M. 2000, MNRAS 316, 923
- (14) Homan, J., & Belloni, T., 2005, astro-ph/0412597
- (15) Kalemci, E., Tomsick, J.A., Buxton, M.M. et al. 2005, ApJ 622, 508
- (16) Kubota, A., & Done, C. 2004, MNRAS 353, 980
- (17) Ling, J.C., & Wheaton, Wm.M. 2005, ApJ 622, 492
- (18) Liu, B.F., Mineshige, S., Meyer, F. et al. 2002, ApJ 575, 117
- (19) Liu, B.F., Meyer, F., Meyer-Hofmeister, E. 2004, A&A 421, 659
- (20) Maccarone, T.J., & Coppi, P.S. 2003a, MNRAS 338, 189
- (21) Maccarone, T.J., & Coppi, P.S. 2003b, A&A 399, 1151
- (22) Maitra, D., & Bailyn, C.D. 2004, ApJ 608, 444
- (23) McClintock, J.E., & Remillard, R.A. 2005, to appear in Compact Stellar X-ray Sources, eds. W.H.G. Lewin, & M. van der Klis, Cambridge University Press, astro-ph 0306213
- (24) Meyer-Hofmeister, E. 2004, A&A 423,321
- (25) Meyer-Hofmeister, E., & Meyer, F. 1999, A&A 348, 154
- (26) Meyer-Hofmeister, E., & Meyer, F. 2001, A&A 380, 739
- (27) Meyer-Hofmeister, E., & Meyer, F. 2003, A&A 402,1013
- (28) Meyer-Hofmeister, E., Liu, B.F., & Meyer, F. 2005, A&A 432, 181 (MLM05)
- (29) Meyer, F., Liu, B.F., & Meyer-Hofmeister, E. 2000, A&A 361, 175
- (30) Mineshighe, S., Liu, B.F., Meyer, F. et al. 1998, PASJ 50, L5
- (31) Mitsuda, K., Inoue, H., Nakamura, N. et al. 1989, PASJ 41, 97
- (32) Miyamoto, S., Kitamoto, S., Hayashida, K. et al. 1995, ApJ 442, L13
- (33) Muno, M.P., Remillard, R.A., Chakrabarty, D. 2002, ApJ 568, L35
- (34) Naik, S., Nagrawal, B.P., Rao et al. 2000, A&A 354, 938
- (35) Narayan, R., Mahadevan, & R., Quataert, E. 1998, In: The Theory of Black Hole Accretion Discs, eds. M.A. Abramowicz et al., Cambridge Univ. Press p.48
- (36) Narayan, R., & McClintock, J.E. 2005, ApJ 623, 1017
- (37) Olive, J.-F., Baret, D., & Gierliński, M. 2003, ApJ 583, 416
- (38) Park, S.Q., Miller, J.M., McClintock, J.E. et al. 2004, ApJ 610, 378
- (39) Quataert, Q.E., Di Matteo, T., Narayan R. 1999, ApJ 525, L89
- (40) Rodriguez, J., Corbel, S., & Tomsick, J.A. 2003, ApJ 595, 1032
- (41) Rossi, S., Homan, J., Miller, J. et al. 2004, to appear in Proc. of the II BeppoSAX Meeting, eds. E.P.J. van den Heuvel, J.J.M. in ’t Zand, & R.A.M.J. Wijers, Nuclear Physics B Proc. Suppl., 132, p. 416
- (42) Różańska, A., & Czerny, B. 2000, A&A, 360, 1170
- (43) Tanaka, Y., & Shibazaki, N. 1996, Ann. Rev. Astron. Astrophys. 34, 607
- (44) Wardziński, G., Zdziarski, A.A., & Gierliński, M., 2002, MNRAS 337, 829
- (45) Yuan, F., & Narayan, R. 2004, ApJ 612, 724
- (46) Zdziarski, A.A., Poutanen, J., Mikolajewska, J. 1998, MNRAS 301, 435
- (47) Zdziarski, A.A., & Gierliński, M., 2004, In: Stellar-Mass, Intermediate-Mass, and Supermassive Black Holes, eds. K. Makishima & S. Mineshige, Progr. Theor. Phys. Suppl. 155, 99
- (48) Życki, P.T., Done, C.,& Smith, D.A. 1998, ApJ 496, L25