THERMAL DUST EMISSION FROM PROPLYDS, UNRESOLVED DISKS, AND SHOCKS IN THE ORION NEBULA11affiliation: Based on observations obtained at the Gemini Observatory, which is operated by the Association of Universities for Research in Astronomy, Inc., under a cooperative agreement with the NSF on behalf of the Gemini partnership: the National Science Foundation (US), the Particle Physics and Astronomy Research Council (UK), the National Research Council (Canada), CONICYT (Chile), the Australian Research Council (Australia), CNPq (Brazil), and CONICET (Argentina).
Abstract
We present a new 11.7 mosaic image of the inner Orion nebula obtained with T-ReCS on Gemini South. The map covers 2716 with diffraction-limited spatial resolution of 035; it includes the BN/KL region, the Trapezium, and OMC-1 South. Excluding BN/KL, we detect 91 thermal-infrared point sources, with 27 known proplyds and over 30 “naked” stars showing no extended structure in Hubble Space Telescope (HST) images. Within the region we surveyed, 80% of known proplyds show detectable thermal-infrared emission, almost 40% of naked stars are detected at 11.7 , and the fraction of all visible sources with 11.7 excess emission (including both proplyds and stars with unresolved disks) is roughly 50%. These fractions exclude embedded sources. Thermal dust emission from stars exhibiting no extended structure in HST images is surprising, and means that they have retained circumstellar dust disks comparable to the size of our solar system. Proplyds and stars with infrared excess are not distributed randomly in the nebula; instead, they show a clear anti-correlation in their spatial distribution, with proplyds clustered close to C, and other infrared sources found preferentially farther away. We suspect that the clustered proplyds trace the youngest 0.5 Myr age group associated with the Trapezium, while the more uniformly-distributed sources trace the older 1–2 Myr population of the Orion Nebula Cluster. This suggests that small protoplanetary disks persist for a few Myr in irradiated environments, and hints that hierarchical sub-clustering has been important on 30″ scales around the Trapezium. We detect 11.7 emission from the five brightest members of the Trapezium (ABCDE), caused by free-free stellar wind emission and possibly emission from dusty disks around companion stars. Within 30 of C Ori, 100% of known proplyds are detected at 11.7 , and they exhibit remarkable limb-brightened dust arcs at the collision of the proplyd mass loss and the wind from C. The star D is associated with the most prominent mid-IR dust arc of the Ney-Allen nebula. We propose that this arc is the consequence of D being the closest member of the Trapezium to the background cloud. Finally, we detect dust emission from Herbig-Haro jets in Orion, including HH 202, HH 529, HH 513, and HH 514. This is the first detection of mid-infrared continuum emission from dust in the body of a collimated HH jet or bow shock. The presence of dust implies that some jet material must be lifted from large radii in the accretion disk (outside the dust sublimation radius) or entrained from the circumstellar environment.
1 INTRODUCTION
Because of its proximity (d460 pc; Bally et al. 2000) and extreme youth, the Orion nebula is a valuable archetype for investigating low-mass star formation near high-mass stars. Consequently, Orion is so far the only H ii region where a large number of externally-illuminated protoplanetary disks can be studied in detail. These “proplyds” were first distinguished by their H and radio emission (Laques & Vidal 1979; Churchwell et al. 1987; Garay et al. 1987), but their circumstellar disks and ionized envelopes have been clearly resolved at visual wavelengths in Hubble Space Telescope (HST) images (e.g., O’Dell et al. 1993a; O’Dell & Wen 1994; O’Dell & Wong 1996; O’Dell 1998, 2001; Chen et al. 1998; McCaughrean et al. 1998; Bally et al. 1998, 2000; Smith et al. 2005). Meaburn (1988) first pointed out that all the bright proplyds around the Trapezium contain stellar sources in the near-infrared. Over 80% of known stars in the inner arcminute near the Trapezium have proplyd features. Many of them have spatially-resolved disks seen in silhouette against the background nebula. Thus, they have retained significant amounts of circumstellar dust despite their irradiated environment, which motivates a mid-infrared (IR) census at high spatial resolution.
At IR wavelengths, the OMC-1 region is dominated by hot dust in the luminous embedded BN/KL nebula. Not surprisingly, most thermal-IR imaging studies of Orion have focussed on resolving its dramatic structure (e.g., Becklin & Neugebauer 1967; Kleinmann & Low 1967; Rieke et al. 1973; Downes et al. 1981; Wynn-Williams et al. 1984; Gezari 1992; Dougados et al. 1993; Gezari et al. 1998; Greenhill et al. 2004; Shuping et al. 2004).
By comparison, little mid-IR attention has been lavished upon the Trapezium’s vicinity, sometimes called the Ney-Allen nebula in the mid-IR (Ney & Allen 1969; Gehrz et al. 1975). The only previous sub-arcsecond thermal-IR imaging of the Trapezium cluster was by Hayward et al. (1994), who detected several compact sources associated with proplyds and a series of parabolic arcs surrounding them, presumably marking the shock between the proplyds’ mass-loss and the stellar wind from Ori C (C hereafter). Hayward & McCaughrean (1997) subsequently detected mid-IR emission from a few additional proplyds farther from the Trapezium as well (see also Robberto et al. 2002). More recently, Robberto et al. (2005) presented large-scale 10 & 20 maps of the Orion nebula at arcsecond resolution, confirming previous extended structures and providing the first comprehensive list of point sources at mid-IR wavelengths. They detected 177 point sources in a 5′35 field, many of these associated with proplyds. In the near-IR, photometry (e.g., Lada et al. 2004 and references therein) reveals a large IR-excess disk fraction (roughly 50%) among the low-mass stellar population in Orion, as well as several highly-reddened and deeply-embedded sources that may mark sites of active ongoing star formation behind the main ionization front illuminated by the Trapezium.
Our new Gemini images show the same dust structures first noted by Hayward et al. (1994), but with improved spatial resolution and sensitivity, and we detect numerous additional sources not reported previously at these wavelengths. These are the first mid-IR images of a large portion of the Trapezium region obtained with an 8-m class telescope, and the improved spatial resolution facilitates a comparison with structures seen in visual-wavelength images obtained with HST. In recent papers (Smith et al. 2004b; Smith & Bally 2005) we reported the discovery of several new IR sources in the OMC-1 South cloud core and a disk around the embedded source IRc9, based on a subset of the data presented here. Below we highlight some of the intricate structure seen in our larger 11.7 mosaic image, with particular attention to several compact sources (both stars and proplyds) and the dusty arcuate shocks in the Trapezium region. The intricate multiwavelength structure in the BN/KL region will be discussed in a separate paper.
2 THERMAL-IR OBSERVATIONS
Images of the Orion nebula at 11.7 (=11.09-12.22 ) were obtained on 2004 Jan 25 using T-ReCS on Gemini South. T-ReCS is the facility mid-IR imager and spectrograph with a 320240 pixel Si:As IBC array, a pixel scale on the 8m Gemini South telescope of 0089, and a resulting field-of-view of 285214. The observations were taken with a 15 east-west chop throw. Since the throw is much smaller than the extent of the nebula, we took a series of adjacent images, starting on relatively blank sky to the west, and stepping by 15 per pointing at a constant declination. To define the reference sky to subtract from each position, we took the minimum of two frames on either side of the position of interest. This allowed effective removal of point sources in the reference sky frames, but some nebular emission persisted where both adjacent pointings contained diffuse emission at the same position on the array, or where a point source and bright diffuse emission overlapped in the two reference frames adjacent to the array position being considered. In those cases, we set the residual emission in the sky frame by interpolating over the point source. This technique worked sufficiently well to reveal structures smaller than 15 in size, but degraded the image quality somewhat because of small pointing errors in the off-source beam (the telescope cannot guide while observing the reference sky position). Individual sky-subtracted frames were then combined to make a larger mosaic image, using point sources in each frame as tie points for spatial alignment.
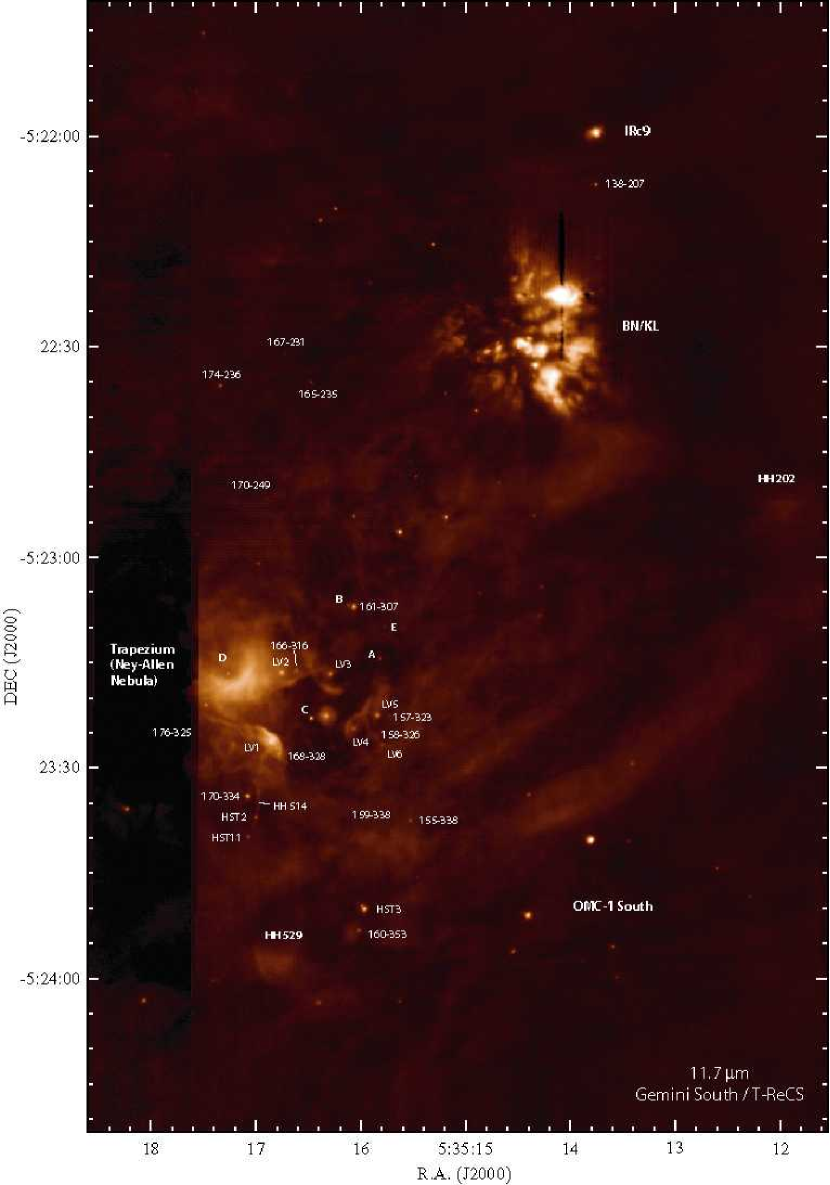
Figure 1 shows the resulting 11.7 mosaic image. Table 1 lists J2000 coordinates for IR point sources, as well as point-source photometry at 11.7 measured in a 09 radius synthetic aperture. These coordinates were measured relative to C assuming its position is =5h35m1646, =523230 (McCaughrean & Stauffer 1994). The relative positional uncertainty is better than 1 pixel (009) near the center of the field but increases to about 5 pixels (045) near the upper and lower edges. Flux densities in Table 1 were measured with respect to the secondary standard star HD 32887, adopting the values tabulated by Cohen et al. (1999). Point-source sensitivity was approximately 10.5 mJy (1) at 11.7 . The measured FWHM of point sources in our images was roughly 035, consistent with the expected diffraction limit at this wavelength. Flux uncertainty for the brighter sources is dominated by 5–10% uncertainty in the calibration stars. However, because we were limited by a relatively small chopper throw of only 15, at some positions where bright and complex diffuse emission fell in the reference beam (i.e. near the Trapezium) the photometric accuracy may be as poor as 30%, and a few sources listed in parenthesis had additional uncertainty due to a close neighbor or uneven background.
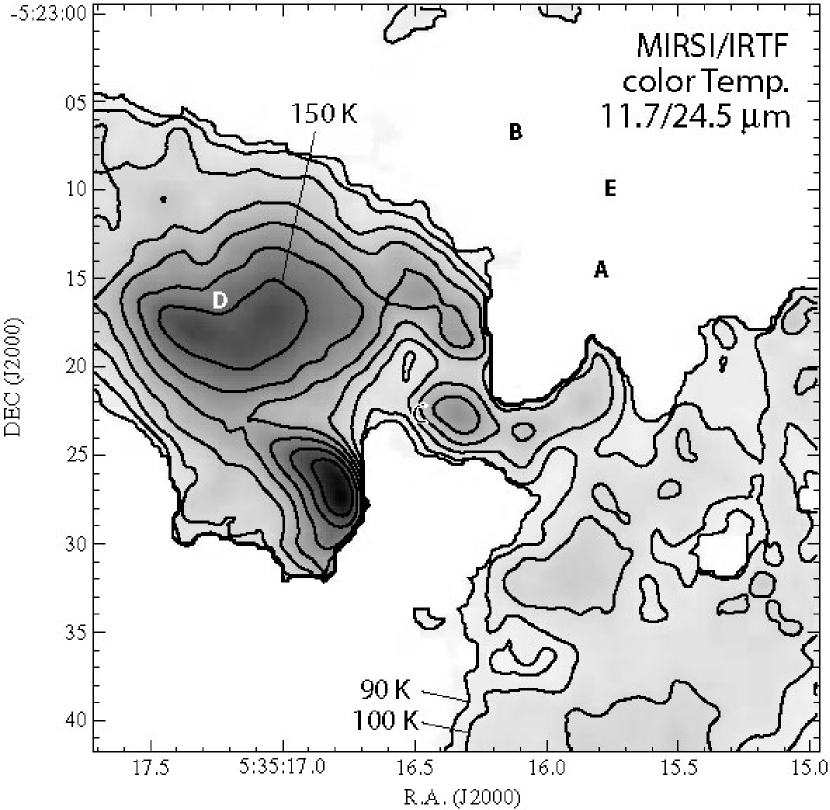
In §3.3 we supplement our monochromatic Gemini/T-ReCS map with data obtained with the MIRSI instrument on the NASA Infrared Telescope Facility (IRTF). We used the flux ratio in 11.7 and 24.5 images to deduce the grain color temperature. Details of the data reduction for the MIRSI images can be found in Kassis et al. (2005).
3 RESULTS
Our 11.7 map has the best combination of high spatial resolution, sensitivity, and areal coverage that has yet been used to image Orion in the mid-IR. This map has a smaller field of view than a recent mid-IR survey by Robberto et al. (2005), but the higher spatial resolution and sensitivity of our study makes the two datasets complementary, especially near the crowded Trapezium where spatial resolution is key. Our higher spatial resolution also facilitates a detailed comparison between dust emission structures and emission-line features seen in narrowband optical HST images. In our T-ReCS survey, many new point sources and diffuse structures are detected, some close pairs of sources are resolved for the first time, and previously-identified nebular features are revealed in greater detail, as discussed below.
3.1 Proplyds and Stars
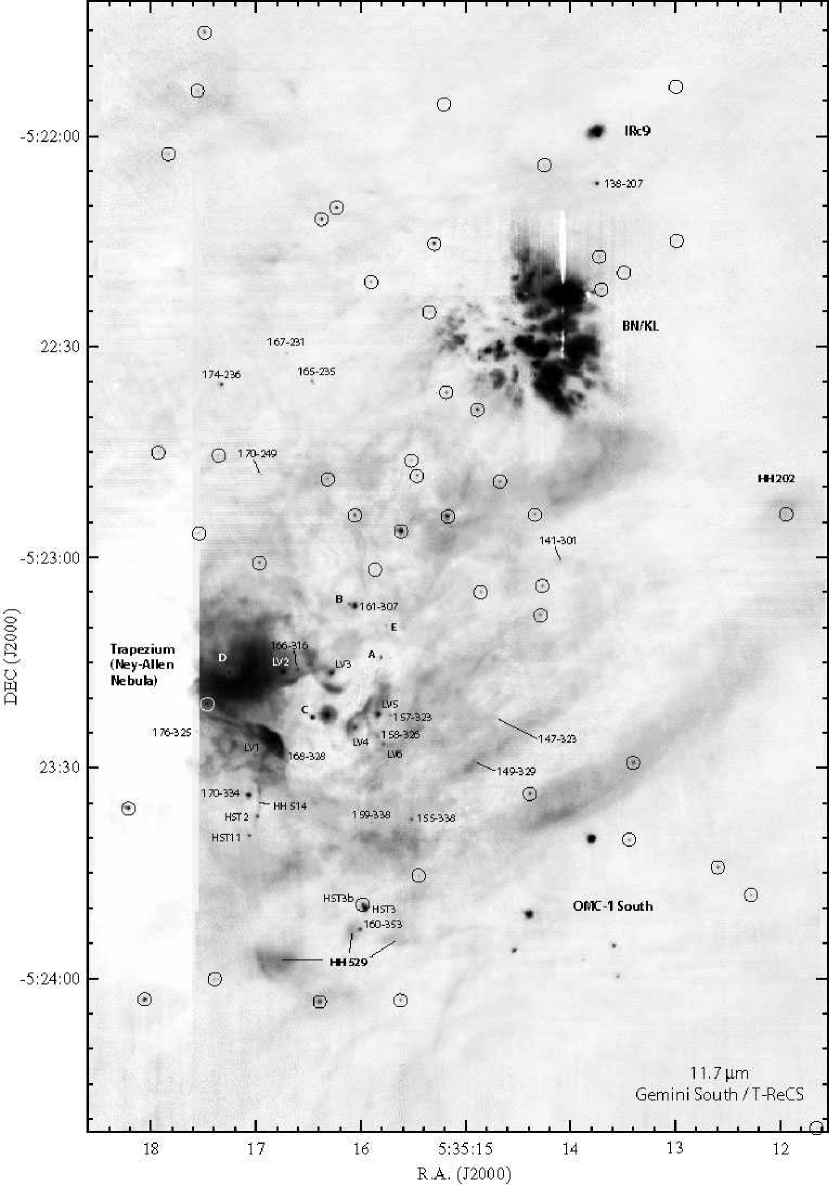
Within the boundaries of Figure 1, we detect 91 point sources (see Table 1; this excludes sources assumed to be part of the BN/KL complex and faint extended proplyds like 141-301). Labels in Figures 1 and 2 identify 11.7 sources which are known to be proplyds because of extended structure seen in HST images, while IR sources not associated with proplyds are circled in Figure 2. Some of these non-proplyd IR sources have no visual I.D. and are likely to be embedded sources. Table 2 summarizes source counts and IR excess fractions for all sources with visual-wavelength counterparts (both proplyds and “naked” stars showing no extended structure in HST images, taken from the list compiled by O’Dell & Wong 1996). The fraction of visible sources showing excess 11.7 emission is roughly 50%, which agrees with the IR-excess disk fraction measured for the low-mass stellar population in the nebula by Lada et al. (2004).
We detected nearly all the known proplyds (O’Dell & Wong 1996; Bally et al. 2000) in our survey region, except for 161-328, HST 1, 10, 12, 13, 16, and 17, so that about 80% of known proplyds have detectable 11.7 emission. The non-detections of HST 1, 10, 16, and 17 need to be qualified, however, as they fell in the 15-wide portion at the left edge of Figure 1 which was only observed in the reference sky position and is of considerably lower quality (note that faint extended emission from HST 1 and 10 was indeed detected in N-band images by Robberto et al. 2002).
Perhaps even more interesting than the detection of proplyds is the 11.7 emission from several “naked” stars with no extended proplyd structure in HST images, some of which are brighter than nearby proplyds at 11.7 . These comprise about half the IR point sources circled in Figure 2. The mid-IR emission from most of the weaker sources is detected here for the first time. We detect 27 new 11.7 sources not found previously in -band images by Robberto et al. 2005 (new embedded sources in OMC-1 South were discussed in a previous paper; Smith et al. 2004b). In the last column of Table 1 we list numbers assigned to various single point sources detected previously by Robberto et al. (2005). Except in the case of the luminous Trapezium stars themselves, the detectable excess mid-IR emission implies that these stars have retained dust disks, despite the lack of material in observable proplyd envelopes. Since no extended structure is seen by HST (either as ionized envelopes or as silhouette disks), these must be very compact remnant dust disks – roughly the size of Pluto’s orbit or smaller. Since they do not show extended structure in HST images, the disks are either depleted of gas so that they do not have significant photoevaporating envelopes, or their evaporation rates are so low that their ionized envelopes remain unseen in optical emission lines by HST. There is no apparent trend of 11.7 flux with separation from C. The apparent thermal-IR flux of an externally-irradiated disk will also depend on its size, its tilt angle with respect to the ionizing source, and its inclination from our line of sight (see Robberto et al. 2002). Therefore, the dust may be heated internally by the central star in each system. Many of these stars also show excess L’ band emission (Lada et al. 2004), and a detailed study of their spectral energy distributions (SEDs), including additional multi-filter mid-IR emission, would be worthwhile to further constrain the properties of the disks. Other implications of our detection of these mid-IR point sources are discussed further in §4.1.
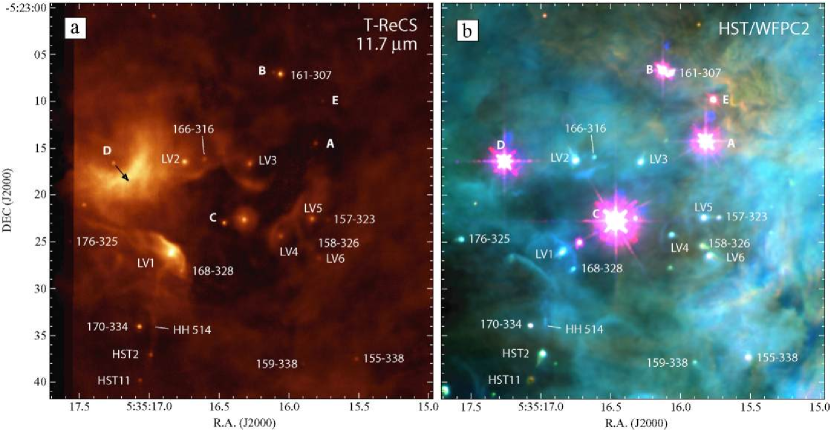
All of the main Trapezium stars (A, B, C, D, and E) are detected at 11.7 , but they are faint (Figure 3). Their mid-IR fluxes are roughly consistent with expected photospheric emission, perhaps enhanced by moderate free-free emission from their stellar winds. However, the high multiplicity fraction in the Trapezium111The five Trapezium stars ABCDE actually contain at least 13 individual stars. A and C each have at least one spatially-resolved companion, B is composed of at least four resolved stars, and both A and B are eclipsing binaries (Weigelt et al. 1999; Simon et al. 1999; Schertl et al. 2003). raises the possibility that the IR emission may originate in dusty disks around companion stars. Indeed, Schertl et al. (2003) found near-IR excess emission associated with companions of B and C, and relatively high extinction toward companions of A and B. External irradiation of such disks less than 500 AU from a luminous star should result in very hot dust around these sources, which should be distinguishable from free-free or photospheric emission in the SEDs of ABCDE. B has a known proplyd companion (161-307; Bally et al. 2000) that is clearly spatially resolved for the first time at thermal-IR wavelengths in Figure 3. Of the main Trapezium stars, only D has no known companions, and the remarkable peculiarities of its environment are discussed below in §3.3.
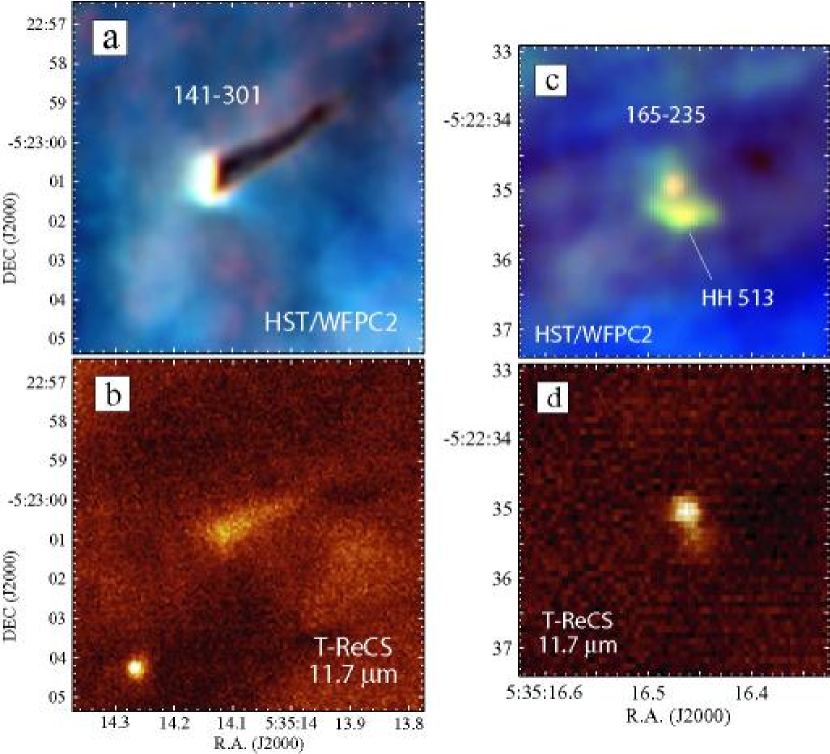
Not all proplyds detected at 11.7 are point sources in the IR; some show complex structure or extended diffuse emission. Figure 4 shows two interesting examples: the large proplyd 141-301, and the proplyd 165-235 with the associated microjet HH 513. In 141-301, the thermal IR emission comes not from a disk concentrated around the central star, but from the long dark tail trailing behind the proplyd in the direction away from C. This proplyd is unusual compared to many other of Orion’s bright proplyds and silhouette disks in that the proplyd is very large and the full extent of the tail is seen as a silhouette object. This large size and full-body silhouette are reminiscent of some of the large proplyd candidates seen in the Carina nebula (Smith et al. 2003). Whether the tadpole shapes of these objects and 141-301 are caused by true evaporating protoplanetary disks or instead by evaporating cometary globules is not yet clear. The T-ReCS images also spatially resolve close pairs of sources containing proplyds, like B and its companion 161-307, and the proplyd HST3 plus its nearby companion. Although they are not detected in our images because they reside in the poor-quality region at the east edge of our map, HST 1 and HST 10 also show extended mid-IR emission (Robberto et al. 2002).
3.2 Dust Arcs
Figure 3 shows the remarkable thin limb-brightened arcs around the proplyds LV 1, 2, 3, 4, and 5, 157-323, 158-326, and 166-316. Their mid-IR emission was noted earlier by Hayward et al. (1994), but their structure is revealed here in greater detail. Many of these arcs are also seen in H and [O iii] 5007 emission (Figure 3; see also Bally et al. 2000), implying that they mark the collision between the stellar wind of C and the ionized proplyd outflow (e.g., Henney & Arthur 1997). In all cases, the parabolic arcs point in the general direction of C.
The source just west of C (163-323) shows an unusual envelope with a radius of 15; it has no known evidence for an ionized proplyd cusp in HST images, but such emission would be difficult to detect as this source is embedded in the glare from C. Unlike the other mid-IR arcs, this star’s envelope appears roughly spherical, despite its proximity to C. Robberto et al. (2002) interpret this source (also named SC3; Hayward et al. 1994) as a proplyd surrounding a face-on disk located behind C and projected near it on the sky. An alternative interpretation might be that it is close to or embedded within the photodissociation region (PDR) behind C, much as we suggest below for the arc around D. However, the fact that the central star is a bright IR source suggests that it does indeed harbor a warm circumstellar disk.
The dust arcs associated with LV1 and D are larger and much brighter than the other proplyd arcs in Figure 3. Their corresponding 11.7 /H flux ratios are much higher as well; the arc around LV1 is only faintly visible in HST images, and the large arc around D is not seen at all in H or [O iii] (Fig. 3). In the case of D, at least, we propose that the dust arc emitting at 11.7 has a different origin than the arcs around the other Trapezium proplyds, as discussed below.
The dust arc around LV1 is unusual in that it is much brighter than any of the other proplyd arcs. LV1 is also by far the brightest proplyd at 11.7 . These clues might suggest that it is closer to C than the other proplyds, despite its greater separation than some others (like LV4 and 163-323) as seen projected on the sky. This view is supported by the much warmer dust temperatures around LV1 of roughly 160–170 K (Figure 5), as compared to 130 K for other proplyds with a similar apparent separation from C. However, this view would not easily explain the much fainter H and [O iii] emission from the large arc around LV1, since the ionizing UV radiation should be more intense as well. Another interpretation might be that the outflow from LV1 has a higher dust content than the other proplyd flows, or that it contains smaller and hotter grains, making it appear brighter at 11.7 . These questions can potentially be answered with more detailed multi-filter mid-IR imaging or mid-IR spectroscopy. Yet, it is worth pointing out that while the LV1 arc is somewhat different from the other proplyd arcs, its dust cannot have the same PDR origin that we attribute to the Ney-Allen dust in the following section; the LV1 arc does indeed point directly toward C while the Ney-Allen arc does not, and LV1 does not contain a comparable luminous heat source.
3.3 D and the Ney-Allen Nebula
The environment around D is particularly interesting. Within a radius of about 0608, it shows a 0.10.2 Jy arcsec-2 deficit of thermal-IR emission compared to its surroundings, perhaps indicating a dust-free cavity around the star. This is visible in Figures 1, 2, and 3, but it is shown more clearly by the tracing through the star in Figure 6. This empty ring around the star is not an image processing artifact, since we have applied no image enhancement like unsharp masking or maximum-entropy deconvolution to our T-ReCS image, which can sometimes manufacture similar rings.
Does this indicate a real dust cavity around D? Any luminous star will have a zone around it where dust would be too hot to remain as solid grains; D is a normal B0.5 V star with L=5104 L⊙. For normal dust grains that condense at temperatures of roughly 1000 K, assuming a typical grain radius of 0.1 (so that 100), dust should be able to survive no closer than 180 AU or 04 from D. Since this is in rough agreement with the size of the “cavity” we observe, one could surmize that either 1) D produces dust in its own stellar wind beyond about 200 AU from the star, or 2) D is embedded within a dusty environment and has destroyed that dust in its immediate vicinity. Since main-sequence O and early B stars do not normally have dusty stellar winds, and because efficient dust formation requires relatively high densities unlikely to be found in a stellar wind at a distance as large as 180 AU, the second option seems more likely. Locating D within a dusty environment has important bearing on the discussion below.
D is close to the center-of-curvature of a large 2–6-radius arc that forms the most prominent feature of the Ney-Allen nebula (see Fig. 3). Robberto et al. (2005) proposed the existence of a massive evaporating circumstellar disk around D to explain the formation of this arc. They noted a possible connection between this IR-excess disk around D and the fact that D is the only massive Trapezium member without a known binary or multiple companion star, suggesting that these were mutually exclusive. Our higher resolution mid-IR images, however, show no such dust disk around D larger than 50 AU – instead they show what appears to be a cavity around the star, with the weak IR emission from D itself being consistent with photospheric emission only. Following the discussion above, it is unlikely that D harbors any dust disk at all, since an unresolved disk responsible for the observed 11.7 emission would be well inside the dust sublimation radius. Thus, the origin of the Ney-Allen arc must have some other explanation.
This arc cannot be discerned in visual-wavelength images, and its origin is mysterious. There is no source other than D that it could plausibly be associated with. D is offset from its center-of-curvature by about half of the arc’s radius, and unlike the other arcs in the Trapezium, its apex does not point exactly toward C. However, it is intriguing that the apex of the arc does point in roughly the same direction as the proper motion of D itself, measured as 0.5 mas yr-1 (a tangential velocity of 1 km s-1) at P.A.217° (van Altena et al. 1988). This direction is shown by the arrow near D in Fig. 3. Given the very bright thermal-IR emission and this structure’s invisibility at optical wavelengths, we speculate that the Ney-Allen arc may arise as the stellar wind of D sweeps up dust in the main PDR behind the Orion nebula, and that dust in the Ney-Allen arc is heated by D itself, not C like all the other Trapezium dust arcs.
This would require that D be closer to the background molecular cloud than the other Trapezium stars, which is plausible for two reasons:
1. D shows an absorption component at 21 km s-1 that is not seen in optical spectra of the other Trapezium stars (O’Dell et al. 1993b), implying that it is the closest to the ionization front (O’Dell 2001).
2. The very bright 11.7 emission from a large area associated with the Ney-Allen nebula has an elevated color temperature compared to surrounding regions in the Trapezium. Figure 5 shows a color temperature map deduced from the 11.7/24.5 flux ratio in images obtained with the MIRSI camera at the IRTF (Kassis et al. 2005). This map was made assuming a dust emissivity , revealing grain temperatures of roughly 155 K at the position of the large Ney-Allen arc. Since the local dust temperature peaks near D instead of near the much more luminous star C, this requires that D is located much closer to the dust than C is. The fact that 20 emission is more spatially extended in the direction away from D than emission at shorter wavelengths is (Robberto et al. 2005) also suggests that it is the heat source for the arc, rather than C. For a grain temperature of 155 K and the same assumptions about grain properties as above, this dust should be found at a distance of 7500 AU from D. This value is much smaller than the expected distance between the ionizing star C and the ionization front behind it, which is roughly 0.2–0.25 pc or 40,000–50,000 AU (Wen & O’Dell 1995).
3.4 HH Jets
Our T-ReCS/Gemini mosaic of the Orion nebula provides the first unambiguous detection, to our knowledge, of mid-IR continuum emission from dust in the bow shocks and jets of Herbig-Haro (HH) objects. This is significant, since dust is frequently assumed to be destroyed in such shocks (e.g., Reipurth & Bally 2001). While mid-IR line emission from H2 was detected by the Infrared Spce Observatory (ISO) satellite in HH 54 (Neufeld et al. 1998) and HH 337 (Noriega-Crespo et al. 1998), mid-IR thermal continuum emission from hot dust was not. Molinari et al. (1999) detected far-IR continuum emission from cool dust associated with HH 7, but those observations had low spatial resolution compared to ground-based images, so it is not clear if the dust is located in the outflow or around it.
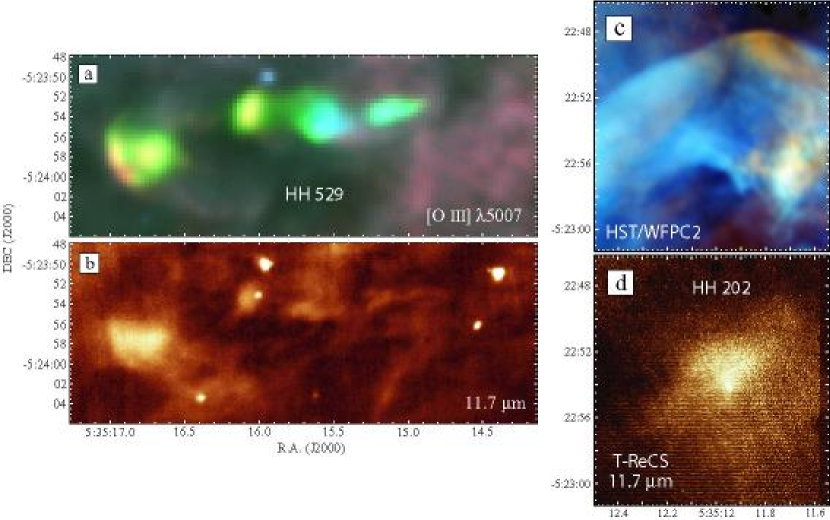
We have clearly detected 11.7 emission coincident with bright ionized gas in HH 202, 513, 514, and 529 (Figs. 3, 4, and 7). The 11.7 emission is most likely thermal dust emission, since the 11.7 filter does not transmit [Ne ii] 12.8 or [S iv] 10.4 , and hydrocarbon emission would not be expected in an irradiated jet or shock in the interior of an H ii region. However, spatially-resolved mid-IR spectra would obviously help to check this assertion.
HH 529 and HH 202 are both associated with prominent jets emerging from OMC-1 S (Smith et al. 2004b; Doi et al. 2004; O’Dell & Doi 2003; Bally et al. 2000), and both show detectable 11.7 emission in Figure 7. We also detect dust emission in the jets from two proplyds: the highly collimated HH 514 jet from the proplyd HST2 (Fig. 3) and the HH 513 microjet from the proplyd 165-235 (Fig. 4 and ).
In every case where we detect dust in HH jets, we only detect 11.7 emission on the side of the jet facing C, while we do not detect the counter-jets in any of these HH objects. This suggests that the dust is either heated directly by C, or is heated indirectly and locally by trapped Ly from the dense ionized gas in each object. We find a direct spatial correlation between the locations of ionized gas traced by either H or [O iii] and the dust seen in mid-IR emission. The most impressive example is HH 529 in Figure 7 and , where the dust emission is seen both behind the leading bow shock and in internal shocks or density enhancements within the body of the jet. In the brightest part of HH 529 behind the leading bow shock, we measure a background-subtracted specific intensity at 11.7 of 0.61 Jy arcsec-2. Dust emission is also seen in the collimated body of the HH 514 jet from HST2. Finding mid-IR emission from hot dust in the body of a collimated jet far from a main shock front is an important clue to the origin of the dust in HH flows. Specifically, it implies that the dust was entrained in the flow early-on, instead of having formed in the dense cooling zone behind a reverse shock or bow shock. This is discussed in more detail in §4.2.
4 DISCUSSION
4.1 Spatial Segregation and Subclustering, and the Lifetime of Remnant Dust Disks in Irradiated Environments
Our 11.7 survey of the inner parts of the Orion nebula with T-ReCS on Gemini South has revealed a number of mid-IR point sources, which come in three flavors: 1) known proplyds, 2) visible stars with no extended structure in HST images (“naked” stars), and 3) embedded IR sources with no visual identification. Of these three types, the mid-IR emission from “naked” stars is perhaps the most surprising and interesting from the point of view of understanding the history of recent star formation in this region. We expected to see mid-IR emission from proplyds – which obviously are still surrounded by gas and dust envelopes, many showing clear silhouette disks or microjets (e.g., Bally et al. 2000) – and we expect mid-IR emission from sources embedded within the background molecular cloud.
The mid-IR emission from naked stars, on the other hand, is more unexpected, indicating the presence of remnant dust disks comparable to the size of our solar system (optically thick dust disks would need to be smaller than about 01 or 50 AU to escape detection by HST). One might surmise a priori that these objects are older than the proplyds, since their smaller disks seem to be in a more advanced stage of evaporation (the source of that photoevaporation may have been Balmer continuum radiation from other luminous stars in the Orion Nebula Cluster, such as A and B). If true, the age of their central stars may give important clues to the lifetimes of disks in irradiated environments, and their spatial distribution within the Orion Nebula Cluster (ONC) might hold important clues to the geometry of its recent star formation history. Hillenbrand (1997) found that stars in the ONC have a range of ages from 0.5–2 Myr, with the younger 0.5 Myr population concentrated toward the center, within 0.3 pc of C, and the older 1–2 Myr population distributed more uniformly over larger radii. Thus, if the unresolved disks really have been exposed to evaporating UV radiation for a longer time than the proplyds, we might expect the proplyds and unresolved disks to follow a spatial trend akin to the age segregation of the ONC.
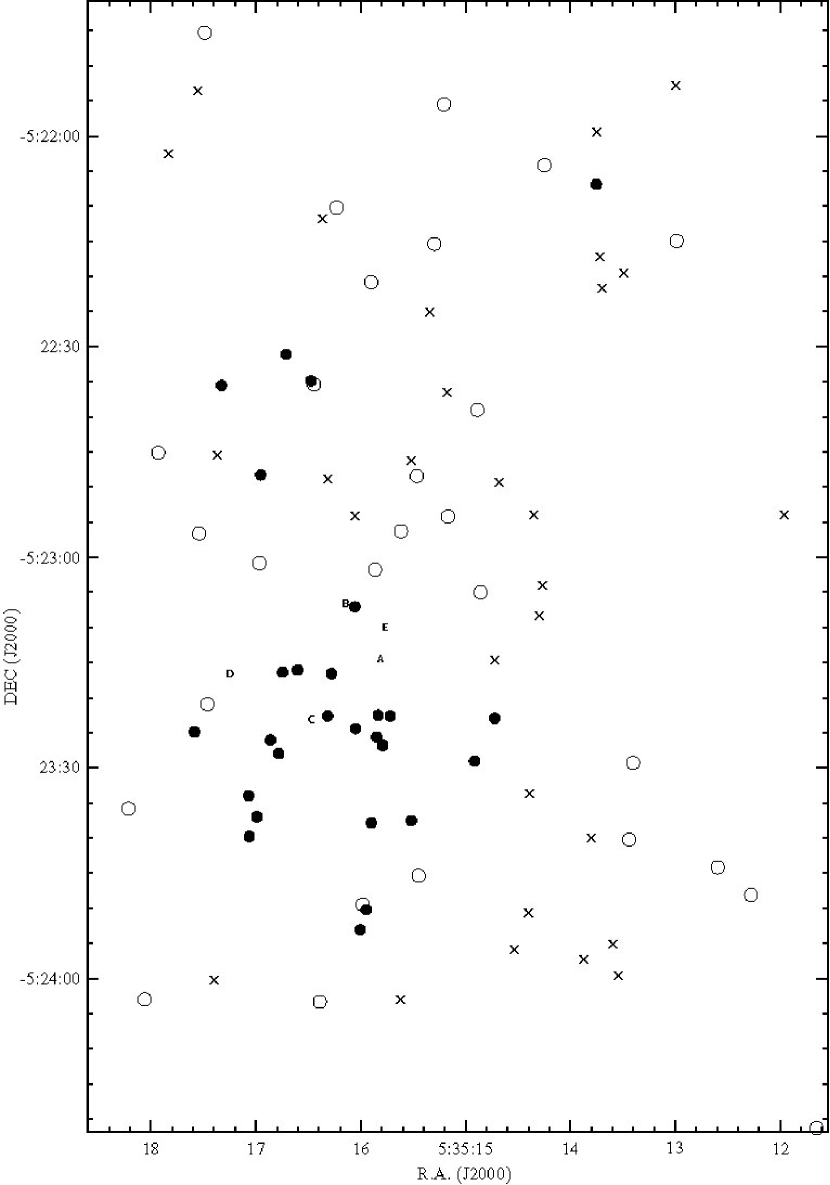
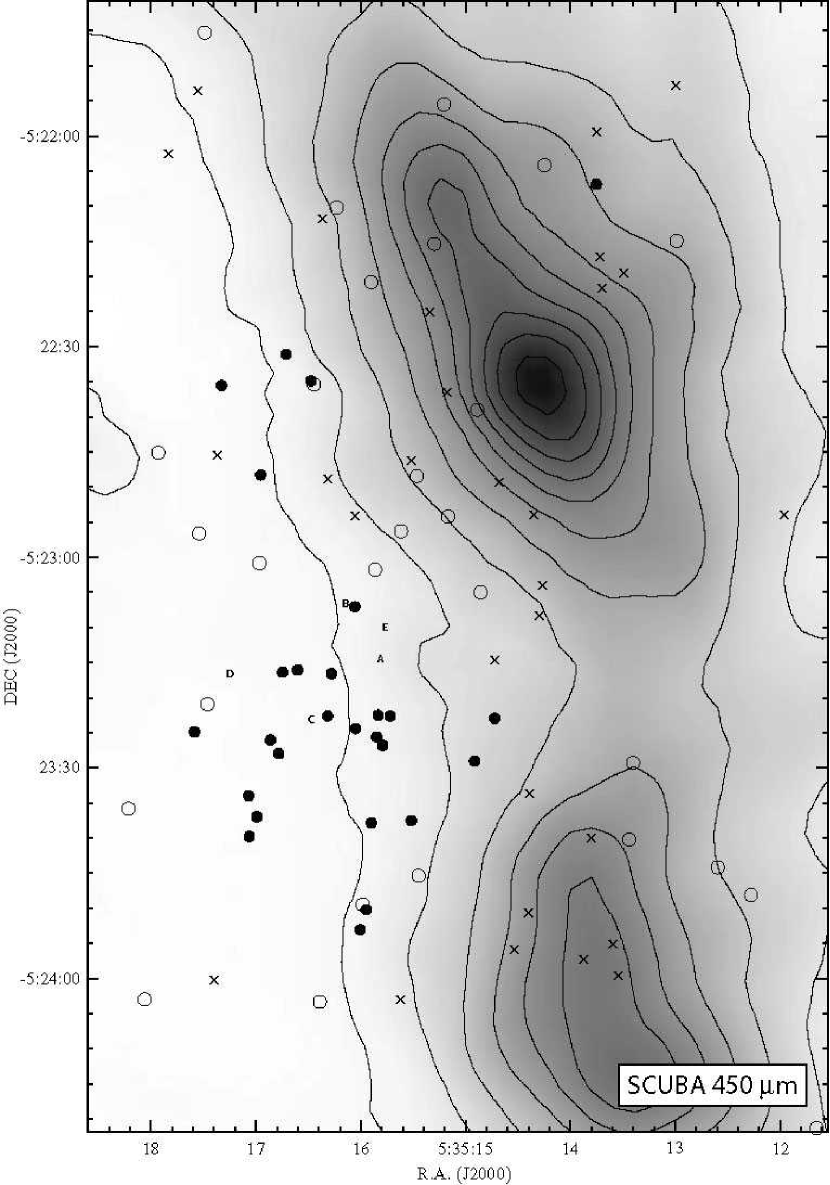
Indeed, we find that the three types of mid-IR point sources are not distributed randomly in the Orion nebula. Figure 8 shows the locations of proplyds (filled circles), naked stars with mid-IR emission (unfilled circles), and embedded mid-IR sources (X’s). Figure 8 gives a clear impression that proplyds are clustered preferentially near C, while the remaining mid-IR sources seem to have a smoother spatial distribution. This is not simply an effect of otherwise similar disks being more severely evaporated near C, because a few bright proplyds are seen at larger distances than naked stars, and the naked stars do not have spatially-resolved silhouette disks like many proplyds. These really are two different populations of objects, reinforcing the idea that the two types of objects may have different ages.
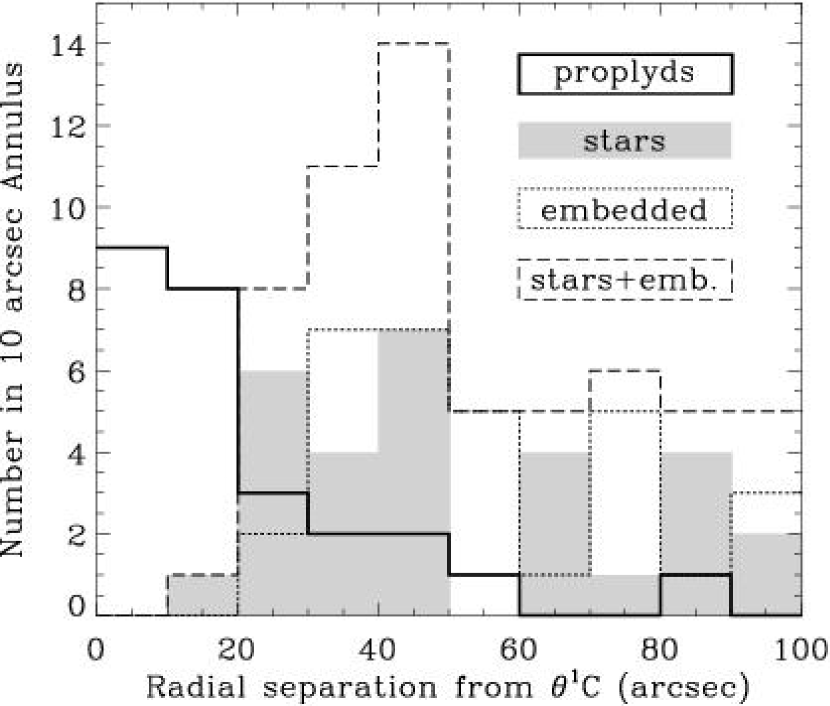
Figure 9 shows a more quantitative description of the spatial distribution of these three types of sources, where we have plotted the number of each type of source as a function of projected separation from C (we do not include the massive members ABCDE in Fig. 9). There is a clear anti-correlation between the spatial distribution of proplyds and other types of mid-IR point sources. There appears to be a boundary at a radius of roughly 20″ from C, inside of which almost all mid-IR sources are proplyds, and outside of which the number of proplyds drops while the number of non-proplyd point sources rises sharply. The populations of naked stars and embedded sources are indistinguishable in Figure 9, and their sum (naked stars plus embedded sources; the dashed histogram in Figure 9) shows the anticorrelation even more vividly. We did not attempt to fit the trend of the number of each type of source as a function of radius, since our survey is incomplete, and only has full coverage over 2 radians in azimuth out to 20″ (0.05 pc). A larger and more complete survey that extends farther to the east and southeast might find additional proplyds or other point sources beyond 20″ from C, but the dearth of naked stars with mid-IR emission within 20″ is real, and somewhat perplexing.
In general, we find that the proplyds detected in the mid-IR are highly concentrated within 0.05 pc of C, while other mid-IR point sources are excluded from this inner region and are distributed more uniformly outside of it. This distribution echoes the segregation by age in the ONC, with younger (0.5 Myr old) stars heavily concentrated in the center of the cluster, and older (1–2 Myr) stars found over a larger area (Hillenbrand 1997). This provides circumstantial evidence that the proplyds near C are, in fact, among the youngest members of the Trapezium cluster, while the mid-IR point sources associated with naked stars and embedded sources may be part of the older ONC population.
This implies that protoplanetary disks may be long-lived. Proplyd lifetimes are often estimated to be only 104–105 yr (e.g., O’Dell 2001; Bally et al. 1998; Henney & O’Dell 1999), but these estimates extrapolate from their current mass-loss rates and current disk masses. As a protoplanetary disk continues to evaporate and shrinks in size, it’s geometric cross section for absorbing UV radiation also shrinks. As the disk’s outer radius decreases to the appropriate gravitational radius
where 3 km s-1 is the sound speed in the PDR (heated by soft UV radiation) or 11 km s-1 in the photoionized gas, further evaporation becomes limited by viscous transport from to larger radii where it can escape. Therefore, as disks shrink to 40 AU (for 1 M⊙), their evaporative evolution becomes dependent on disk viscosity (Matsuyama, Johnstone, & Hartmann 2003). Thus, in advanced stages of disk evolution, the corresponding evaporation mass-loss rate declines, potentially prolonging the disk lifetime.
Throop & Bally (2005) have recently proposed that as evaporation continues, the protoplanetary disks will preferentially shed their gas and smallest grains, leaving behind larger grains that settle to the disk midplane, thereby aiding in planetesimal (and planet) formation. We suspect that the mid-IR emitting disks surrounding “naked” stars in Orion are a manifestation of these more advanced phases of protoplanetary disk evaporation in H ii regions. Their association with the older and more extended population of the ONC might then suggest that the inner portions (5–20 AU) of protoplanetary disks are resiliant, surviving for at least 1–2 Myr. If this conjecture is true, then detailed study of these sources holds enormous potential for learning about a critical phase of planet formation. Constraining their disk masses and grain properties could provide a direct test of the scenario proposed by Throop & Bally (2005). An alternative view could be that some of the “naked” stars were ejected from the core that formed the Trapezium, similar to the process at work in the simulations of Bate & Bonnell (2005). In that case, their surprisingly small disks for their young age might be the result of tidal stripping in the ejection process (e.g., Reipurth 2000). The spatial distribution of these “naked” stars over a larger area of the nebula might shed light on this question.
Additionally, the concentration of proplyds near C suggests that hierarchical subclustering has been very important in the formation of the larger ONC, if the proplyds and the Trapezium stars really are the youngest objects seen at visual wavelengths in Orion. Hillenbrand & Hartmann (1998) pointed out that the ONC is elongated in the north-south direction, like the molecular cloud behind it (Johnstone & Bally 1999), implying that the ONC is young enough that it is not yet dynamically relaxed and still bears an imprint of the geometry of its birth environment. Thus, it seems plausible that the proplyds and Trapezium stars all formed recently from the same localized dense cloud core, distinct from the rest of the ONC cluster — much as the BN/KL and OMC-1 South events will produce subclusters younger than the Trapezium when they have cleared away their natal material. This is an important clue to the enduring puzzle of why proplyds are so common in the core of the Orion nebula, but are not seen elsewhere in the sky – i.e., the Trapezium and the surrounding proplyds may be a uniquely young remnant of the original cloud core that spawned them, where the UV radiation was just turned-on only 0.5–1 Myr ago. Proplyds may not be seen in other nearby H ii regions with massive O-type stars because they are not young enough, and their proplyds have already been mostly evaporated. More distant proplyds seen outside the immediate vicinity of C may have recently emerged from their own cloud core, or may have been ejected from the core that formed the Trapezium (e.g., Reipurth 2000; Bate & Bonnell 2005).
Finally, Figure 10 shows that even the spatial distribution of the remaining non-proplyd sources seen in the mid-IR is not entirely random. Specifically, embedded sources (X’s in Fig. 10) seem to be found preferentially near or on the Trapezium-facing side of the densest parts of the OMC-1 cloud core, seen in sub-mm emission from cool dust associated with the “integral shaped filament” that runs through Orion (Johnstone & Bally 1999). Lada et al. (2004) found a similar result for the spatial distribution of embedded sources with excess L-band emission. It is unclear whether these embedded sources are still in the early phases of formation within their natal material, or are instead members of the older 1–2 Myr population that happen to be engulfed by the dense cloud core that bisects the larger ONC. A more thorough mid-IR survey over a larger area, perhaps with Spitzer, could help clarify the nature of these embedded sources.
4.2 Mid-IR Properties of Point Sources
Unfortunately, our T-ReCS survey of Orion is monochromatic over most of the field, limiting its potential for investigating dust properties (temperature, optical depth, grain size) in the sources we detected. The nearest wavelength at which a complete survey has been done with comparable sensitivity and resolution is the L-band study of Lada et al. (2004) using the VLT. Interpreting the comparison between 3 and 12 is hampered by the partial contribution of photospheric emission in the L-band, and the fact that several of the embedded sources we detected at 11.7 were not detected in the L-band. Nevertheless, a preliminary comparison of these two wavelengths does give some limited insight.
Figure 11 shows a pseudo color-magnitude diagram for the sources in Table 1, comparing the 11.7 flux to the 11.7 /L-band flux ratio. In Figure 11, the different source categories are plotted with the same symbols as in Figures 8 and 10.
A handful of proplyds and embedded sources have very strong mid-IR excess emission (they are found at the upper right in Fig. 11). The reddest sources are LV1, LV4, and 163-323, all of which are very close to C. Aside from these, most point sources detected in our survey have similar 3-12 colors, regardless of the type of source. With a flux ratio near 1, most of these sources would be considered Class I, but a more complete investigation of their SEDs over a wider wavelength range is necessary. The similar loci for most of the sources in Figure 11, regardless of the type of source, suggests no severe differences in grain sizes and temperatures. While this does not confirm the age segregation proposed in the previous section, it is not necessarily inconsistent with it; longer wavelength data may be needed to detect the largest and coolest dust grains, which may be preferentially present in the older systems.
In viewing Figure 11, it is useful to recall that it only traces about half the stellar sources known in the area of the Orion nebula that we covered – the remaining stars not detected at 11.7 would presumably reside at the lower left corner of this figure with weak 11.7 excess and L-band fluxes dominated by photospheric emission.
4.3 HH Jets and the Trapezium Dust Arcs – Where Does the Dust Come From?
As noted in §3.4, evidence for dust in HH objects is scarce (Reipurth & Bally 2001; Henney et al. 1994). Yet, we have detected 11.7 continuum emission from warm dust in several irradiated HH jets and in arcs around proplyds near C. In both cases, the dust is near enough to C that it can be heated directly by UV radiation or indirectly by re-radiation from the ionized gas. This suggests that dust could be common in other HH jets as well, but in quiescent environments without a strong external UV source, the dust is not heated sufficiently to emit strongly in the mid-IR. While we see this dust emission in the Orion nebula, the origin of the dust in these outflows is not obvious, with four potential sources to consider:
1) In the HH jets, the dust may be entrained at the origin of the jet, implying that the jet is lauched from the accretion disk at a radius larger than the dust sublimation radius. In the Trapezium dust arcs, the dust may be entrained in the photoevaporative flow off the surface of the central proplyd disk.
2) Dust may be entrained from the ambient material surrounding the jet or proplyd. This process seems to be at work in HH 444 near Ori, as demonstrated by Andrews et al. (2004).
3) The dust may form in the dense post-shock cooling zone, either from jet or proplyd material after passing through the reverse shock, or from ambient material that has passed through the forward shock.
4) Dust from the ambient medium may survive passage through the forward bow shock. For the Trapezium dust arcs, this would require dust formation in the stellar wind of C itself.
Dust is often thought to be destroyed in shocks, giving rise to bright IR emission lines of [Fe ii] as iron is liberated into the gas phase (e.g., McKee et al. 1984; Hartigan et al. 2004; Nisini et al. 2002; Smith et al. 2004a), but the dust may reform in the dense post-shock cooling zone. On the other hand, Mouri & Taniguchi (2000) have argued that dust may even survive passage through shocks, as large grains are shattered into smaller grains but are not completely destroyed. While options 3 and 4 might contribute some of the dust seen in HH jets and dust arcs, dust formation or survival in shocks cannot be the sole explanation for the dust seen in the HH jets in the Orion nebula. This is because dust is not only seen at the location of the bow shock, but is also seen in condensations along the body of the jet. This is most clearly illustrated in HH 529 (Fig. 7), where dust is seen from all the main locations along the jet where dense ionized gas is seen. HH 514 also shows clear evidence for dust along the body of the jet (Fig. 3).
Option 2 seems to be an unlikely explanation for the source of the dust as well, but is difficult to rule out. In the harsh irradiated environment of the Orion nebula, disks are exposed and no longer embedded in surrounding cloud cores. This is especially true for HH 514 and 513, because they originate from the exposed sources HST2 and 165-235 (proplyds inside the H ii region, with little surrounding material to entrain), or for the dust arcs around the proplyds so close to C. For these proplyds, dust would need to be entrained from material in the optically thin proplyd envelope. However, this process may be important for the embedded sources that drive HH 202 and HH 529 (Smith et al. 2004; Doi et al. 2004; O’Dell & Doi 2003; Bally et al. 2000).
Thus, option 1 above seems to be a likely explanation for the origin of the dust in HH jets and potentially in the Trapezium dust arcs as well. In HH jets, if the dust is entrained directly from material in the circumstellar disk, one would expect the entrainment to occur at relatively large radii in the disk – radii at least as large as the dust sublimation radius, typically at AU for =100 and a sublimation temperature of 1000 K. The requirement that some of the jet material is lifted from the disk at relatively large radii would provide important constrains on models of protostellar jet launching and collimation. The origin of dust in HH jets certainly deserves further investigation.
In both jets and photoevaporative flows from proplyds, it is likely that primarily the smallest grains are entrained. Small grains are also more likely to survive shocks and the harsh UV radiation field because of their smaller cross-section, and may be more subject to stochastic heating. Measurements of the dust temperature using multiwavelength data may be able to constrain the grain size distribution in these HH jets and dust arcs.
4.4 A New Interpretation of the Ney-Allen Nebula
We have suggested a new interpretation for the origin of the brightest arc in the Ney-Allen nebula. Based on the observed dust color temperature and its peak near D, the heating of the Ney Allen arc appears to be dominated by D instead of the more luminous star C, requiring that D is actually behind the other members of the Trapzium, much closer to the background ionization front and PDR of the Orion nebula. This geometry is supported by an absorption feature seen in the spectrum of D that is not seen in the other Trapezium stars. A small dust-free cavity around D itself provides additional evidence that it is embedded in a more dusty environment.
The geometry of the Ney-Allen arc is more puzzling than the question of its heat source. One potential explanation may be that the stellar wind from D is sweeping up dust from the surrounding PDR. The proper motion vector of D makes this suggestion seem attractive, but is not essential since the wind speed is much greater than stellar motion. Although the proper motion vector is small and highly uncertain, the main point that D is closer to the PDR than the other Trapezium stars does not rely on the proper motion measurement.
4.5 Future Work
Figures 8, 9, and 10 reveal a strong spatial anti-correlation between known proplyds and other IR point sources. We have argued, based on the absence of silhouette disks in the “naked” stars, that this is not a simple effect of stronger UV radiation causing enhanced evaporation in proximity to C. Instead, it seems to be related to age segregation due to subclustering within the ONC, reflecting the geometry of the cloud cores from which these stars were born. This illuminates the vexing question of why proplyds are so ubiquitous near C, but are not seen in large numbers anywhere else in the sky. More in-depth study at thermal-IR wavelengths — especially sensitive multi-filter photometry or spectroscopy of point sources at 8–50 with ground-based observatories, Spitzer, and SOFIA — will help characterize the luminosity, dust temperature, dust composition, disk mass, and extinction as a function of position and specifically as a function of separation from C. It will be important to examine the emission properties of proplyds and non-proplyds over a larger field of view, to provide a more complete sample of the inner ONC.
References
- (1)
- (2) Andrews, S.M., Reipurth, B., Bally, J., & Heathcote, S.R. 2004, ApJ, 606, 353
- (3)
- (4) Bally, J., O’Dell, C.R., & McCaughrean, M.J. 2000, AJ, 119, 2919
- (5)
- (6) Bally, J., Sutherland, R.S., Devine, D., & Johnstone, D. 1998, AJ, 116, 293
- (7)
- (8) Bate, M.R., & Bonnell, I.A. 2005, MNRAS, 356, 1201
- (9)
- (10) Chen, H., Bally, J., O’Dell, C.R., McCaughrean, M.J., Thompson, R., Rieke, M., Schneider, G., & Young, E. 1998, ApJ, 492, L173
- (11)
- (12) Churchwell, E.B., Felli, M., Wood, D.O.S., & Massi, M., 1987, ApJ, 321, 516
- (13)
- (14) Cohen, M., Walker, R.G., Carter, B., Hammersley, R., Kidger, M., & Nogushi, K. 1999, AJ, 117, 1864
- (15)
- (16) Doi, T., O’Dell, C.R., & Hartigan, P. 2004, AJ, 127, 3456
- (17)
- (18) Dougados, C., Lena, P., Ridgway, S.T., Christou, J.C., & Probst, R.C. 1993, ApJ, 406, 112
- (19)
- (20) Downes, D., Genzel, R., Becklin, E.E., & Wynn-Williams, C.G. 1981, ApJ, 244, 869
- (21)
- (22) Garay, G., Moran, J.M., & Reid, M.J. 1987, ApJ, 314, 535
- (23)
- (24) Gehrz, R.D., Hackwell, J.A., & Smith, J.R. 1975, ApJ, 202, L33
- (25)
- (26) Gezari, D.Y. 1992, ApJ, 396, L43
- (27)
- (28) Gezari, D.Y., Backman, D.E., & Werner, M.W. 1998, ApJ, 509, 283
- (29)
- (30) Greenhill, L.J., Gezari, D.Y., Danchi, W.C., Najita, J., Monnier, J.D., & Tuthill, P.G. 2004, ApJ, 605, L57
- (31)
- (32) Hartigan, P., Raymond, J., & Pierson, R. 2004, ApJ, 614, L69
- (33)
- (34) Hayward, T.L., & McCaughrean, M.J. 1997, AJ, 113, 346
- (35)
- (36) Hayward, T.L., Houck, J.R., & Miles, J.W. 1994, ApJ, 433, 157
- (37)
- (38) Henney, W.J., & Arthur, S.J. 1997, in IAU Symp. 187, Herbig-Haro Flows and the Birth of Low Mass Stars, ed. B. Reipurth & C. Bertout (Dordrecht: Kluwer), 561
- (39)
- (40) Henney, W.J., & O’Dell, C.R. 1999, AJ, 118, 2350
- (41)
- (42) Henney, W.J., Raga, A.C., & Axon, D.J. 1994, ApJ, 427, 305
- (43)
- (44) Hillenbrand, L.A. 1997, AJ, 113, 1733
- (45)
- (46) Hillenbrand, L.A., & Hartmann, L.W. 1998, ApJ, 492, 540
- (47)
- (48) Johnstone, D., & Bally, J. 1999, ApJ, 510, L49
- (49)
- (50) Kassis, M., Adams, J.D., Campbell, M.F., Deutsch, L.K., Hora, J.L., Jackson, J.M., & Tollestrup, E.V. 2005, in press
- (51)
- (52) Lada, C.J., Muench, A.A., Lada, E.A., & Alves, J.F. 2004, AJ, 128, 1254
- (53)
- (54) Laques, P., & Vidal, J.L. 1979, A&A, 73, 97
- (55)
- (56) Matsuyama, I., Johnstone, D., & Hartmann, L. 2003, ApJ, 582, 893
- (57)
- (58) McCaughrean, M.J., & Stauffer, J.R. 1994, AJ, 108, 1382
- (59)
- (60) McCaughrean, M.J., Chen, H., Bally, J., Erickson, E., Thompson, R., Rieke, M., Schneider, G., Stolovy, S., & Young, E. 1998, ApJ, 492, L157
- (61)
- (62) McKee, C.F., Chernoff, D.F., & Hollenbach, D.J. 1984, in Galactic and Extragalactic IR Spectroscopy, ed. M.F. Kessler, & J.P. Phillips (Dordrecht: Reidel), 103
- (63)
- (64) Meaburn, J. 1988, MNRAS, 233, 791
- (65)
- (66) Molinari, S., et al. 1999, ApJ, 521, L71
- (67)
- (68) Mouri, H., & Taniguchi, Y. 2000, ApJ, 534, l63
- (69)
- (70) Neufeld, D.A., Melnick, G.J., & Harwitt, M. 1998, ApJ, 506, L75
- (71)
- (72) Ney, E.P., & Allen, D.A., 1969, ApJ, 155, L193
- (73)
- (74) Nisini, B., Caratti o Garatti, A., Giannini, T., & Lorenzetti, D. 2002, A&A, 393, 1035
- (75)
- (76) Noriega-Crespo, A., Garnavich, P.M., & Molinari, S. 1998, AJ, 116, 1388
- (77)
- (78) O’Dell, C.R. 1998, AJ, 115, 263
- (79)
- (80) O’Dell, C.R. 2001, ARAA, 39, 99
- (81)
- (82) O’Dell, C.R., & Doi, T. 2003, AJ, 125, 277
- (83)
- (84) O’Dell, C.R., & Wen, Z. 1994, ApJ, 436, 194
- (85)
- (86) O’Dell, C.R., & Wong, S.K. 1996, AJ, 111, 846
- (87)
- (88) O’Dell, C.R., Wen, Z., & Hu, X. 1993a, ApJ, 410, 696
- (89)
- (90) O’Dell, C.R., Valk, J.H., Wen, Z., & Meyer, D.M. 1993b, ApJ, 403, 678
- (91)
- (92) Reipurth, B. 2000, AJ, 120, 3177
- (93)
- (94) Reipurth, B., & Bally, J. 2001, ARA&A, 39, 403
- (95)
- (96) Rieke, G.H., Low, F.J., & Kleinmann, D.E. 1973, ApJ, 186, L7
- (97)
- (98) Robberto, M., Beckwith, S.V.W., & Panagia, N. 2002, ApJ, 578, 897
- (99)
- (100) Robberto, M., Beckwith, S.V.W., Panagia, N., Patel, S.G., Herbst, T.M., Ligori, S., Custo, A., Boccacci, P., & Bertero, M. 2005, AJ, 129, 1534
- (101)
- (102) Schertl, D., Balega, Y.Y., Preibisch, T., & Weigelt, G. 2003, A&A, 402, 267
- (103)
- (104) Shuping, R.Y., Morris, M., & Bally, J. 2004, AJ, 128, 363
- (105)
- (106) Simon, M., Close, L.M., & Beck, T.L. 1999, AJ, 117, 1375
- (107)
- (108) Smith, N., & Bally, J. 2005, ApJ, 622, L65
- (109)
- (110) Smith, N., Bally, J., & Brooks, K.J. 2004a, AJ, 127, 2793
- (111)
- (112) Smith, N., Bally, J., Licht, D., & Walawender, J. 2005, AJ, 129, 382
- (113)
- (114) Smith, N., Bally, J., & Morse, J.A. 2003, ApJ, 587, L105
- (115)
- (116) Smith, N., Bally, J., Shuping, R.Y., Morris, M., & Hayward, T.L. 2004b, ApJ, 610, L117
- (117)
- (118) Throop, H.B., & Bally, J. 2005, ApJ, 623, L149
- (119)
- (120) van Altena, W.F., Lee, J.T., Lee, J.F., Lu, P.K., & Upgren, A.R. 1988, AJ, 95, 1744
- (121)
- (122) Weigelt, G., Balega, Y., Preibisch, T., Schertl, D., Scöller, M., & Zinnecker, H. 1999, A&A, 347, L15
- (123)
- (124) Wen, Z., & O’Dell, C.R. 1995, ApJ, 438, 784
- (125)
- (126) Wynn-Williams, C.G., Genzel, R., Becklin, E.E., & Downes, D. 1984, ApJ, 281, 172
- (127)
| R.A. | DEC | Fν(11.7 m) | Name/Comment | R05 |
|---|---|---|---|---|
| (J2000) | (J2000) | (Jy) | ||
| 5:35:11.64 | -5:24:21.4 | 0.02 | O | 20 |
| 5:35:11.95 | -5:22:54.2 | 0.08 | X | 25 |
| 5:35:12.27 | -5:23:48.3 | 0.11 | O; OMC-1 S 8 | 27 |
| 5:35:12.59 | -5:23:44.3 | 0.22 | O; OMC-1 S 7 | 31 |
| 5:35:12.99 | -5:21:53.2 | 0.03 | X | … |
| 5:35:12.99 | -5:22:15.1 | 0.03 | O | (34) |
| 5:35:13.40 | -5:23:29.5 | 0.19 | O; OMC-1 S 10 | 40 |
| 5:35:13.44 | -5:23:40.4 | 0.10 | O; OMC-1 S 9 | 41 |
| 5:35:13.48 | -5:22:19.5 | (0.03) | X | … |
| 5:35:13.55 | -5:23:59.9 | 0.08 | OMC-1 S C | 42 |
| 5:35:13.58 | -5:23:55.5 | 0.13 | OMC-1 S B | 43 |
| 5:35:13.72 | -5:22:21.9 | (0.1) | X | … |
| 5:35:13.72 | -5:22:17.4 | 0.12 | X | … |
| 5:35:13.75 | -5:21:59.6 | 9.5 | IRc9 (extended; 53 diam. ap.) | 49 |
| 5:35:13.75 | -5:22:07.0 | 0.35 | 138-207 | 48 |
| 5:35:13.80 | -5:23:40.3 | 6.4 | OMC-1 S 1 | 46 |
| 5:35:13.88 | -5:23:57.4 | 0.04 | OMC-1 S 6 | (47) |
| 5:35:14.25 | -5:22:04.5 | 0.05 | O | (55) |
| 5:35:14.27 | -5:23:04.3 | 0.13 | X | 58 |
| 5:35:14.29 | -5:23:08.4 | 0.17 | X | 59 |
| 5:35:14.34 | -5:22:54.1 | 0.08 | X | 60 |
| 5:35:14.39 | -5:23:33.8 | 0.28 | OMC-1 S 11 | 62 |
| 5:35:14.40 | -5:23:51.0 | 2.5 | OMC-1 S 2 | 61 |
| 5:35:14.54 | -5:23:56.2 | 0.46 | OMC-1 S 3 | 64 |
| 5:35:14.67 | -5:22:49.5 | 0.06 | X | (65) |
| 5:35:14.71 | -5:23:23.0 | 0.02 | 147-323 | … |
| 5:35:14.71 | -5:23:14.6 | 0.12 | X | … |
| 5:35:14.86 | -5:23:05.1 | 0.04 | O | 66 |
| 5:35:14.89 | -5:22:39.2 | 0.45 | O | 69 |
| 5:35:14.91 | -5:23:29.1 | (0.03) | 149-329 | … |
| 5:35:15.17 | -5:22:54.3 | 0.59 | O | 71 |
| 5:35:15.18 | -5:22:36.8 | 0.16 | X | 70 |
| 5:35:15.21 | -5:21:55.7 | 0.02 | X | … |
| 5:35:15.30 | -5:22:15.5 | 0.46 | O | 73 |
| 5:35:15.34 | -5:22:25.2 | 0.05 | O | 74 |
| 5:35:15.44 | -5:23:45.7 | 0.02 | O | 76 |
| 5:35:15.46 | -5:22:48.6 | 0.04 | O | … |
| 5:35:15.52 | -5:22:46.5 | 0.03 | X | … |
| 5:35:15.52 | -5:23:37.5 | 0.09 | 155-338 | 79 |
| 5:35:15.61 | -5:22:56.5 | 1.11 | O | 82 |
| 5:35:15.62 | -5:24:03.2 | 0.10 | X | 81 |
| 5:35:15.72 | -5:23:22.6 | 0.04 | 157-323 | 83 |
| 5:35:15.75 | -5:23:10.0 | 0.03 | E | … |
| 5:35:15.78 | -5:23:26.7 | 0.11 | LV 6 | 86 |
| 5:35:15.80 | -5:23:14.5 | 0.05 | A | 85 |
| 5:35:15.81 | -5:22:45.8 | 0.04 | O | 84 |
| 5:35:15.83 | -5:23:22.5 | 0.92 | LV 5 | 87 |
| 5:35:15.84 | -5:23:25.7 | 0.04 | 158-326 | (88) |
| 5:35:15.86 | -5:23:02.0 | 0.02 | O | … |
| 5:35:15.90 | -5:23:38.1 | 0.02 | 159-338 | … |
| 5:35:15.90 | -5:22:21.0 | 0.11 | O | (91) |
| 5:35:15.95 | -5:23:50.1 | 1.70 | HST 3 | … |
| 5:35:15.97 | -5:23:49.7 | (0.03) | HST 3b | … |
| 5:35:16.01 | -5:23:53.1 | 0.31 | 160-353 | 94 |
| 5:35:16.06 | -5:23:24.4 | 0.56 | LV 4 | 98 |
| 5:35:16.06 | -5:22:54.2 | 0.20 | X | 96 |
| 5:35:16.06 | -5:23:07.1 | 1.29 | B companion, 161-307 | … |
| 5:35:16.11 | -5:23:06.9 | (0.03) | B | … |
| 5:35:16.23 | -5:22:10.4 | 0.21 | O | 102 |
| 5:35:16.28 | -5:23:16.3 | 0.32 | LV 3 | (105) |
| 5:35:16.32 | -5:23:22.6 | 1.63 | 163-323; SC3; near C | 106 |
| 5:35:16.32 | -5:22:49.1 | 0.08 | X | 104 |
| 5:35:16.37 | -5:22:12.0 | 0.29 | X | … |
| 5:35:16.39 | -5:24:03.5 | 0.30 | O | (108) |
| 5:35:16.45 | -5:22:35.3 | (0.04) | HH 513 | … |
| 5:35:16.46 | -5:22:35.1 | (0.09) | 165-235 | … |
| 5:35:16.46 | -5:23:23.0 | 0.76 | C | 111 |
| 5:35:16.61 | -5:23:16.2 | 0.13 | 166-316 | (114) |
| 5:35:16.71 | -5:22:31.2 | 0.05 | 167-231; silhouette disk | … |
| 5:35:16.74 | -5:23:16.5 | 0.96 | LV 2 | 116 |
| 5:35:16.76 | -5:23:28.0 | 0.25 | 168-328 | … |
| 5:35:16.84 | -5:23:26.2 | 5.59 | LV 1 | 118 |
| 5:35:16.95 | -5:22:48.5 | 0.02 | 170-249 | (119) |
| 5:35:16.96 | -5:23:00.9 | 0.12 | O | 122 |
| 5:35:16.98 | -5:23:37.1 | 0.39 | HST 2 | 121 |
| 5:35:17.06 | -5:23:39.8 | 0.08 | HST 11 | 123 |
| 5:35:17.07 | -5:23:34.0 | 0.85 | 170-334 | 124 |
| 5:35:17.25 | -5:23:16.6 | 0.06 | D | … |
| 5:35:17.33 | -5:22:35.7 | 0.28 | 174-236 | 128 |
| 5:35:17.35 | -5:22:45.7 | (0.03) | X | … |
| 5:35:17.39 | -5:24:00.3 | (0.1) | X | 129 |
| 5:35:17.46 | -5:23:21.1 | 0.12 | O | 130 |
| 5:35:17.49 | -5:21:45.4 | 0.22 | O | … |
| 5:35:17.54 | -5:22:56.7 | 0.08 | O | (132) |
| 5:35:17.56 | -5:21:53.8 | 0.07 | X | (134) |
| 5:35:17.57 | -5:22:56.4 | (0.03) | O | … |
| 5:35:17.57 | -5:23:25.0 | (0.02) | 176-325 | 131 |
| 5:35:17.83 | -5:22:02.8 | 0.09 | X | … |
| 5:35:17.90 | -5:22:44.8 | 0.02 | O | 140 |
| 5:35:18.06 | -5:24:03.1 | 0.46 | O | 143 |
| 5:35:18.21 | -5:23:35.9 | 0.78 | O | (146) |
Note. — The sources with an “O” listed in the right column are optically visible stars with no extended proplyd structure in HST images (O’Dell & Wong 1996) that nevertheless show detectable 11.7 thermal-IR emission from unresolved dusty disks. “X” denotes an IR point source with no star or proplyd in the list of O’Dell & Wong (1996), and the stars ABCDE, members of OMC-1 South, and known proplyds are identified by name. The last column (R05) gives the designation for sources previously detected by Robberto et al. (2005); sources in parenthesis are uncertain identifications due to poor agreement in the coordinates.
| Parameter | Partial Map | Full Map |
|---|---|---|
| Total number of IR sources detected | 87(+1) | 91(+1) |
| IR-detected proplyds | 25 | 27 |
| Known proplyds | 30 | 34 |
| % proplyds detected in mid-IR | 83% | 79% |
| IR-detected “naked” stars | 30 | 34 |
| Stars with visual ID | 78 | 94 |
| % visual stars detected in mid-IR | 38% | 36% |
| % excluding ABCDE | 34% | 33% |
| IR-detected proplyds & stars | 55 | 61 |
| Total proplyds & stars | 108 | 128 |
| % of all proplyds & stars | 51% | 48% |
| % excluding ABCDE | 49% | 46% |
Note. — This table compares numbers of sources we detected at 11.7 with proplyds and stars in our survey region that have been identified in visual-wavelength HST images, listed in the catalog of O’Dell & Wong (1996). The second column (partial map) excludes the region at the left of Figure 1 that is affected by sky-chopping artifacts, and so the statitstics are more reliable than in the third column, which lists numbers for the full region displayed in Figure 1. Non-proplyd stars (“naked” stars) are those listed as “objects that appear entirely stellar” in O’Dell & Wong (1996). This table excludes embedded IR sources that we detected at 11.7 , which have no visual I.D. The (+1) in the first entry referes to the proplyd 141-301, which is not a point source.