Formation and Evolution of Planetary Systems:
Cold Outer Disks Associated with Sun-like stars
Abstract
We present the discovery of debris systems around three solar mass stars based upon observations performed with the Spitzer Space Telescope as part of a Legacy Science Program, “the Formation and Evolution of Planetary Systems” (FEPS). We also confirm the presence of debris around two other stars. All the stars exhibit infrared emission in excess of the expected photospheres in the 70 m band, but are consistent with photospheric emission at 33m. This restricts the maximum temperature of debris in equilibrium with the stellar radiation to K. We find that these sources are relatively old in the FEPS sample, in the age range 0.7 3 Gyr. Based on models of the spectral energy distributions, we suggest that these debris systems represent materials generated by collisions of planetesimal belts. We speculate on the nature of these systems through comparisons to our own Kuiper Belt, and on the likely planet(s) responsible for stirring the system and ultimately releasing dust through collisions. We further report observations of a nearby star HD 13974 ( 11 pc) that is indistinguishable from a bare photosphere at both 24 m and 70 m. The observations place strong upper limits on the presence of any cold dust in this nearby system (10-5.2).
1 INTRODUCTION
Studying the formation of our own solar system and observing the frequency of similar systems associated with other stars are two ways in which we seek to understand our origins. Through remote observation and direct exploration, we have developed a much clearer understanding of our solar system. However many questions about the processes involved in the initial formation and subsequent evolution towards the present configuration cannot be addressed directly. Therefore, we need to study other stars to help place our solar system in context.
There are two major zones of debris in the solar system: the asteroid belt at 2 4 AU composed of rocky material that is ground up by collisions to produce most of the zodiacal dust cloud and the Kuiper Belt (KB) that consists of small bodies orbiting beyond Neptune’s orbit at 30 50 AU. Since their discovery over a decade ago (Jewitt & Luu 1993), Kuiper Belt objects have played an increasingly important role in understanding the formation and evolution of our planetary system (e.g. Malhotra 1993; Kenyon & Bromley 2004). While direct detection of in situ debris from collisions amongst Kuiper Belt objects has yet to be confirmed, of order 10% of the solar system’s far-IR luminosity could be emitted by Kuiper Belt dust (e.g. Backman et al. 1995). Searching for KB-like debris around other Sun-like stars as a function of age will determine both the frequency of such systems and provide important insight into the formation of our solar system.
Most debris disks were found by their mid-to-far infrared emission in excess of the expected photosphere (e.g., Auman et al. 1984; Backman & Paresce 1993; Mannings & Barlow 1998; Habing et al. 1999; Silverstone 2000; Spangler et al. 2001, Decin et al. 2003, Zuckerman & Song 2004). The majority of these debris disks are also associated with hot, luminous stars, since observatories such as IRAS and ISO did not have the necessary sensitivities to detect debris disks around lower-luminosity solar-type stars at distances beyond a few parsecs.
The increased sensitivity afforded by the Spitzer Space Telescope (Spitzer; Werner et al. 2004) has the potential to identify and investigate debris systems that were not detectable with previous observatories. Using data from the Formation and Evolution of Planetary Systems (FEPS) Spitzer Legacy Program, we have conducted a search for outer dust disks dominated by temperatures characteristic of the Kuiper Belt ( K). The earliest results from our validation observations are presented in Meyer et al. (2004), where we identified such debris disks (exo-KBs) surrounding the 30 Myr-old Sun-like star HD 105 and the 0.4 - 1 Gyr old star HD 150706. Herein we present five more Sun-like stars that exhibit characteristics of exo-KBs, and discuss their properties in the context of the evolution of our own solar system. We also present one star that has a firm detection at 70 m, but the measurement is consistent with the photospheric emission from the star. In this case, we place unprecedentedly low upper limits on the presence of KB-like debris in this system.
In § 2, we describe the observations and data reduction. In § 3, we discuss the methodology for identifying the five exo-Kuiper Belt candidate stars from the FEPS sample, and we present the resulting spectral energy distributions (SEDs). We outline our interpretation of the SEDs in terms of physical models in § 4. We discuss the implications of our results in § 5, and summarize our findings in § 6.
2 OBSERVATIONS & DATA REDUCTION
The FEPS program is described by Meyer et al. (2004, 2005) and a detailed description of the data acquisition and data reduction for the FEPS program is given in the FEPS V1.1 Explanatory Supplement (Hines et al. 2004). In this section, we present a condensed description as it applies to the five targets investigated herein. Observational details are listed for each star in Table 1. Imaging data were obtained with the Multi-band Imaging Photometer for Spitzer (MIPS: Rieke et al. 2004) in the 24 m and 70 m bands using small field photometry mode with 2 – 10 cycles of 3 and 10 second integration times respectively; each of such dataset is a data collection event (DCEs). After initial processing by the Spitzer Science Center (SSC) version S10.5.0 pipeline to provide reconstructed pointing information, we used the MIPS Data Analysis Tool (DAT) software (Gordon et al., 2004, 2005) to process the data.
For the 24 m data, read-2 correction, dark subtraction, droop correction, electronic nonlinearity correction, scan mirror dependent flat fields, cosmic ray rejection, and distortion correction were applied. We produced both individual DCE frames and a mosaic image using all DCE frames. Outlier rejection of each pixel was performed for a mosaic image. The typical number of total DCE frames per source used for photometry was 28 for 2 cycles.
For the 70 m data, dark subtraction, illumination correction, and cosmic ray identification/rejection were applied. The electronic nonlinearity of the detector was corrected. (Gordon et al., 2004, 2005) note in their investigation that this nonlinearity is 1 %, much smaller than absolute calibration uncertainties of 20 % (see the Spitzer Observers Manual 4.6: SOM 4.6, and the MIPS Data Handbook 2004). A “time-filtering” algorithm as described by (Gordon et al., 2004, 2005) was used to eliminate time-dependent gain drifts. All 70 m flux measurements were performed on the distortion corrected final mosaic image.
We used the IDL-based software package IDP3 (Schneider & Stobie 2002) to perform aperture photometry on the 24m and 70m data. IDP3 was developed by the Instrument Definition Team for the Near Infrared Camera and Multi-object Spectrometer (NICMOS), and has been further optimized for the Spitzer IRAC and MIPS data. Object fluxes were measured using standard aperture photometry techniques. For the 24 m photometry, we adopted a 147 aperture radius and a background annulus from 294 to 417 to perform aperture photometry on the distortion corrected individual DCE frames. For the 70 m photometry we used a target aperture radius of 297, and a background annulus of 396 – 792 on the single mosaic image. Aperture correction factors, listed in the SOM 4.6, were then applied.
For HD 8907, we used a smaller target aperture (197) with the same background annulus at 70m to avoid contamination by a nearby source. We also placed a mask on the nearby source to minimize any contribution from the wings of the PSF to the background annulus. The aperture correction for this smaller aperture was derived relative to the standard aperture using 70um observations from other bright and isolated FEPS stars. The uncertainty in this small-aperture correction is 1.2%.
The 24m flux uncertainties are reported in Table 2, and include both the standard deviation of the mean flux density for individual DCEs, which is an estimate of the internal precision of our measurement, and the absolute calibration uncertainty. The 70m internal uncertainty is estimated by the rms pixel-to-pixel dispersion inside the background annulus measured on the mosaic image and scaled to the area of the target aperture. The total uncertainty for both bands is the combination of the internal uncertainty combined (i.e., added in quadrature) with the calibration uncertainty. The calibration uncertainties for 24 m and 70 m photometry are 10 % and 20 % respectively (see the Spitzer Observers Manual 4.6 and MIPS Data Handbook 2004). Note that the the 70 m internal uncertainties are much smaller than absolute calibration uncertainty, and the internal signal-to-noise is very high for our detected objects. It is our knowledge of the absolute flux density in physical units that retains the large uncertainties in Table 2.
Infrared Array Camera (IRAC: Fazio et al. 2004) observations at 3.6, 4.5 and 8.0m were also obtained for each object using the 3232 pixel subarray mode with an effective integration time of 0.01 sec per image (frame time of 0.02 s). Sixty four images of the object were obtained at four different positions in a random dither pattern on the array. This gives a total of 256 images (2.56 sec total integration time) per band. We used the basic calibrated data (BCD) products produced by the SSC S10.5.0 data pipeline as described in the SOM 4.6. Aperture photometry was performed with IDP3 using a 3 pixel radius aperture centered on the target. The background was estimated using the 820 pixels that lie beyond an 10 pixel radius relative to the star (i.e., all pixels beyond the target radius). The background flux was normalized to the area of the target aperture and subtracted from the summed target flux. The final source flux is the mean of the 256 measures, corrected from a 3 pixel radius to the 10 pixel radius used for the IRAC instrumental absolute flux calibration. The internal uncertainty was estimated as the standard deviation of the 256 independent measurements. As for MIPS, the total uncertainty in the physical flux density was constructed by adding the internal and absolute uncertainties in quadrature — absolute flux calibration uncertainties of 10 % in all three bands.
Low-resolution () spectra were obtained with the Infrared Spectrograph (IRS: Houck et al. 2004) from µm, using “high-accuracy” blue peak-up to place the source in the spectrograph slit. Integration times per exposure were 6 sec over the Short-Low wavelength range (7.4 14.5 m), and 14 sec over the Long-Low wavelength range (14.0 38.0 m). The spectra for wavelengths beyond m are not reliable (Houck et al. 2004), so have been omitted. The spectra were obtained at two nod positions in staring mode for averaging and estimating the noise. The BCDs resulting from the SSC pipeline S10.5.0 were further processed within the SMART software package (Higdon et al. 2004). We used the droopres data products, which are intermediate products produced before stray-light and flat-field corrections have been applied. Spectra were extracted assuming point source profiles with a fiducial width of 5 6 pixels in the center of the orders. Residual “sky” emission was subtracted using adjacent pixels. Random errors were calculated from the difference between the two independent spectra, then added in quadrature with an estimated 14 % uncertainty in absolute flux calibration. A more detailed discussion of the IRS data reduction and extraction is presented in Bouwman et al. (2005).
3 SPECTRAL ENERGY DISTRIBUTIONS OF FIVE EXO-KUIPER BELTS
As part of the ongoing analysis of the FEPS database, we have looked for stars that are detected at 70 m but show no significant excesses above the stellar photospheres for µm. This criterion restricts the equilibrium temperature and inner radius of a significant dust component to K and 10 AU for dust in thermal equilibrium around a star with 1 L☉. Three other parallel investigations based on FEPS observations will concentrate on stars that have: 1) young optically-thick disks detected by IRAC, which focus on determining the evolutionary time scale of the inner disks (Silverstone et al. 2005); 2) strong emission at 24 µm but weak at 70 µm indicating material at temperatures approaching those of our solar system’s asteroid belt and terrestrial planets (Hines et al. 2005); and 3) infrared excess indicating a broad range of temperatures characteristic of both terrestrial zones and Kuiper Belts (Bouwman et al. 2005). The focus of this study is on stars that are dominated by excess infrared emission suggestive of Kuiper Belt like disks.
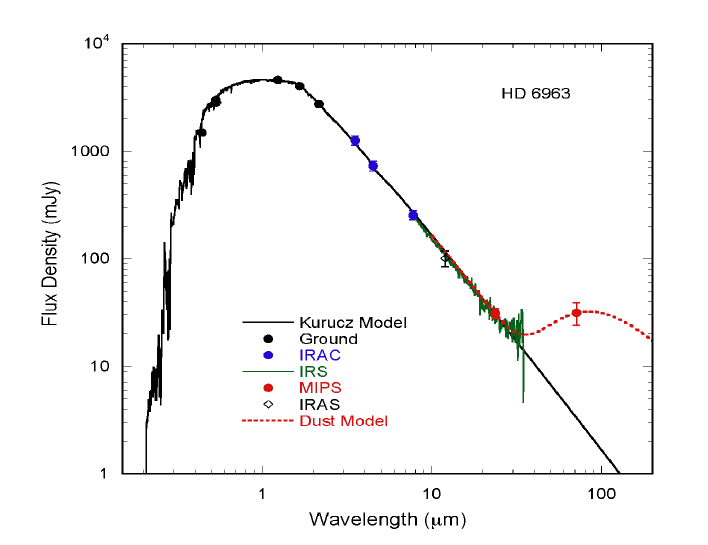
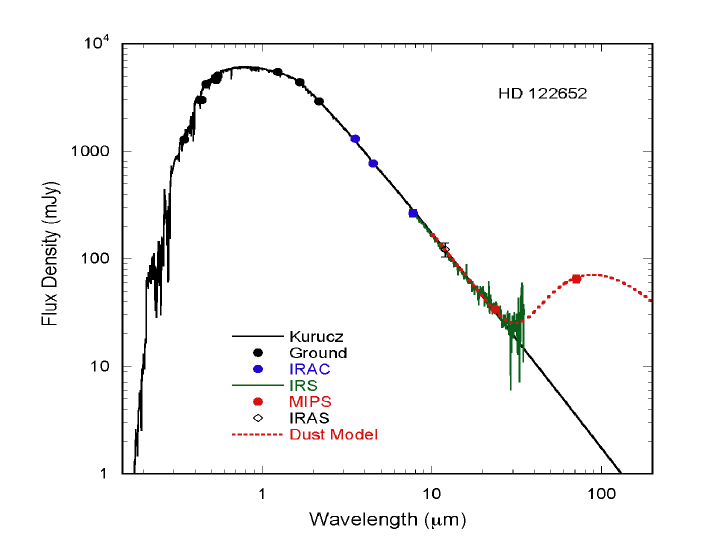
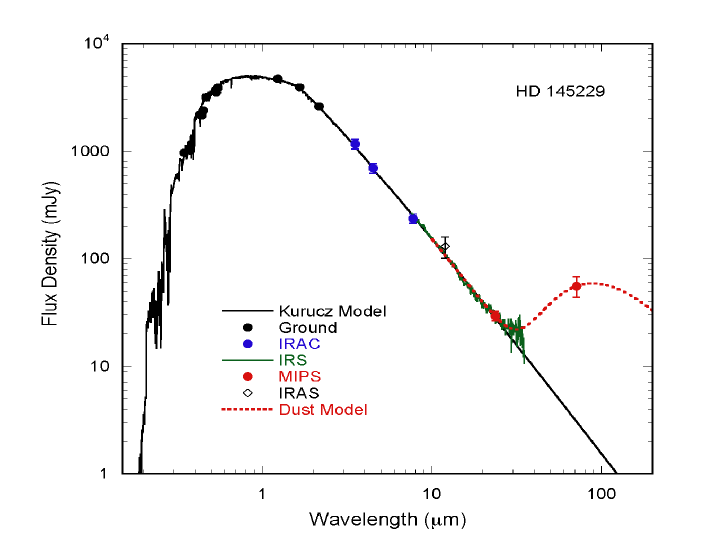
Five stars were selected from the FEPS data obtained between May 28, 2004 (MIPS campaign 8) and Sep. 25, 2004 (MIPS campaign 13), that have 3 excess at 70 m, but are consistent with photospheric emission ( 3 excess) 33 m. Three of the objects are newly discovered debris systems (HD 6963, HD 145229, & HD 206374), while two of the objects were previously identified as having an infrared excess (HD 8907 & HD 122652; respectively, Silverstone 2000, Zuckerman & Song 2004) from IRAS observations. We note that one object, HD 8907, is one of 10 stars with known excess sources, which was included in the FEPS targets for the purposes of a gas emission line search. A sixth star, HD 13974, was also detected at 70 m with high signal-to-noise, but in this case the 70 m flux density is consistent with emission from the photosphere to within 1 uncertainty.
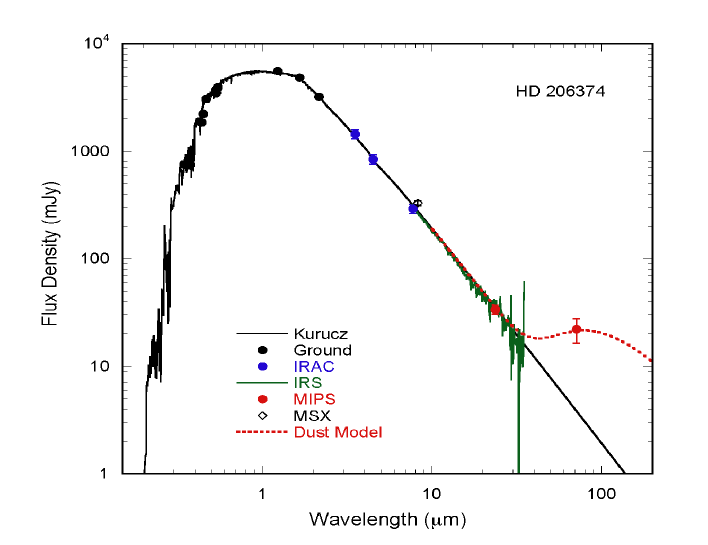
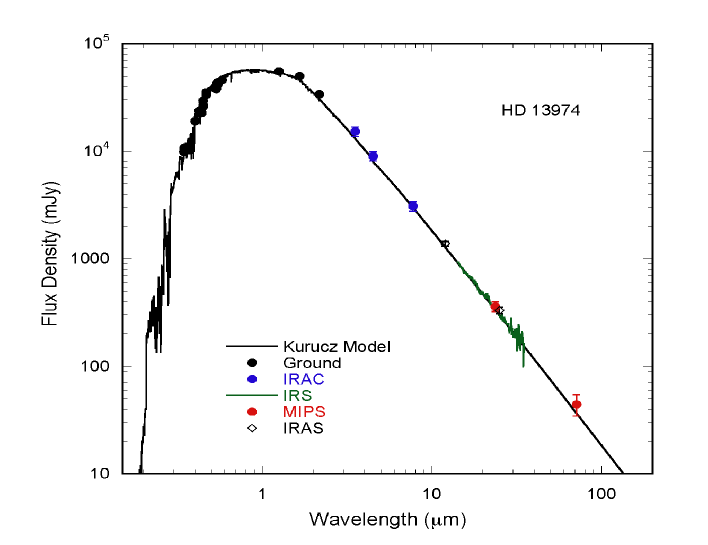
Spitzer photometry for the five stars is presented in Table 2, and the SEDs are shown in Figures 1 and 2. Mid-infrared spectra are also displayed for all of the objects. We use the “average weighted” wavelengths of IRAC and MIPS bands as suggested by the Spitzer Observer’s Manual (SOM). Color corrections have not been applied. The magnitude of these corrections are expected to be smaller than the present absolute calibration uncertainties (see the IRAC and MIPS data handbooks111http://ssc.spitzer.caltech.edu/).
The expected photospheric emission for each star was determined by fitting Kurucz model atmospheres with convective overshoot to published optical photometry including, if available, Johnson , Strömgren , Tycho , Hipparcos , Cousins and 2MASS measurements. Predicted magnitudes in each filter were computed by multiplying the Kurucz model with the combined system response of the filter, the atmospheric transmission (for ground-based observations), and the spectral response function of the detector as outlined in a series of papers by Cohen et al. (2003a, b, and references therein). The Johnson- and Strömgren- filters were excluded from the model fits because the observed photometry shows large deviations from the model values explained in part by chromospheric activity common in young late-type stars. The best-fit Kurucz model was computed in a least squares sense with the effective temperature and normalization constant as free parameters. The metallicity was fixed at [Fe/H] = 0.0 and the surface gravity at log g cm s-2 = 4.5. In addition, each of the stars is within the Local Bubble (see, e.g., Welsh et al. 1998), and the visual extinction was fixed at 0 mag. The stellar parameters used in the Kurucz models, and additional properties of the stars including their distance and estimated ages, are listed in Table 3.
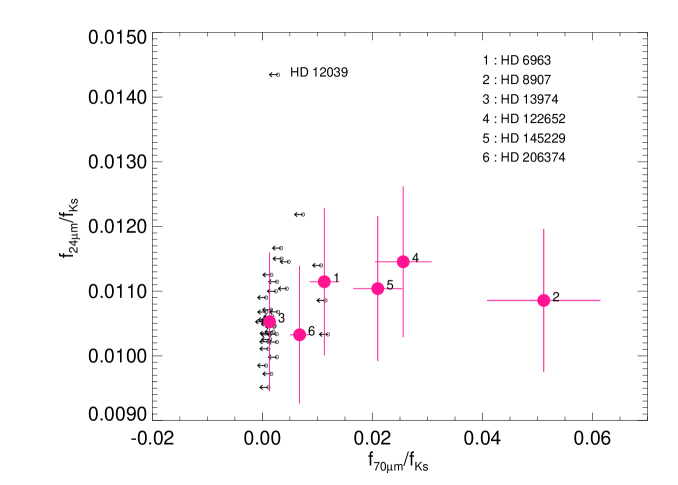
The deviation from the stellar photospheres at m is readily apparent for HD 6963, HD 8907, HD 122652, HD 145229, and HD 206374 (Fig. 1). The 70 µm emission from HD 13974 is consistent with the stellar photosphere (Fig. 2) within the uncertainty of 70 m flux. Figure 3 shows the significance of the 70 m excesses relative to the Kurucz model atmospheres for the five excess stars compared with the distribution for the other stars in the FEPS V1.1 data release. Figure 4 also illustrates the excess in a color-color space that is sensitive to the color temperature of the excess (24m/Ks vs. 70m/Ks). Large filled circles in Figure 4 are sources with 70 µm detections, and small open circles with arrows are 1 upper limits for non-detections. This plot has the virtue of also capturing the lack of strong 24 m excesses in these targets. Note that the 24 m excess of HD 12039 is well separated from the other targets; this star is unique within the FEPS program in exhibiting only warm debris dust, and is discussed in detail in Hines et al. (2005). The location of HD 13974 in this plot agrees well with 1 upper limits of 70 µm non-detections.
In the next section we use the observed SEDs to constrain the properties of the detected debris systems. For HD 13974 the 70 µm detection is consistent the photosphere, placing stringent limits on any KB-like excess. For those objects that were not detected at 70m, we are still able to place upper limits on the presence of a debris system.
4 DEBRIS DISK MODELS
We model our debris disks assuming optically thin dust in thermal equilibrium with the stellar radiation field. In this case, the temperature of a dust grain with a given chemical composition and grain size depends on the radial distance to the central star only. The fact that the SEDs do not significantly deviate from the photosphere for µm places the maximum temperature for the detected dust grains at K. This suggests a minimum equilibrium distance from the stars AU, assuming grains similar in size or larger than those found in our own zodiacal dust cloud (radius m, Reach et al. 2003).
The dust grains are subject to radiation pressure and Poynting-Robertson (P-R) drag, and the action of both mechanisms places limits on the time that the dust remains in the system. Very small grains will be ejected from the system by radiation pressure, while larger grains will suffer P-R drag and spiral toward the parent star. A detailed prescription for computing “blowout” sizes and P-R drag timescales is given in Burns et al. (1979) for the solar system, and are derived for a range of extrasolar systems by Artymowicz (1988) and Backman & Paresce (1993). Particles smaller than m have a blown out time 102 yrs. We consider grains to be no longer important contributors to the SED when they travel a factor of 4 farther from the star than their position of creation in the main dust belt. At these distances, the grain is 0.5 initial temperature, and emits at a twice the wavelength. We consider such a grain to no longer be contributing to the main excess SED, and in effect has left the system. Grains blown out from points of origins a few 10 AU from a solar type star will leave a system by this definition in at most only a few102 years.
Particles larger than 1 µm will be subject to slow P-R inward drift and will be destroyed on timescales of 10 yrs for particle sizes of 1 10 µm (timescale linearly proportional to particle size) starting from distances of order AU (timescale proportional to ). This time scale is very short compared to the age of the systems (see Table 3), which suggest that the debris in these systems is being replenished by a parent population of objects, a putative Kuiper Belt.
From these arguments, we can build simple models of the debris systems. Below we develop models for five of the objects that have limited photometry beyond 24 m. For HD 8907, where we have more photometric constraints on the SED, we explore a more comprehensive model.
4.1 Simple Blackbody Grain Models
Blackbody models of the detected debris disks were based on excess color temperature (), estimated from the two shortest broadband wavelengths with 1 excess (including the synthetic band at 33 µm using IRS long-low data) — Blackbody grains by definition absorb and emit radiation efficiently at all relevant wavelengths. For each object, the solid angle, , subtended by the emitting material as seen from the central star was calculated from and excess using the Planck formula. This value for in turn was converted to: (1) total grain emitting cross-section area, , using the system distance, (2) grain luminosity using and in the Stefan-Boltzmann formula for blackbody luminosity, and (3) grain mass assuming a constant per-grain mass density 222A density of 2.5 g cm-3 was chosen to represent generic silicate fragments of asteroid-like planetesimals, c.f., mean value of densities determined for 10 asteroids 2.4 g cm-3; http://aa.usno.navy.mil/hilton/asteroid_masses.htm. of 2.5 g cm-3 for solid “astronomical silicate” (Draine & Lee 1984) and grain radius 10 µm for efficient emission at 70 µm. The 10 µm radius grain is the smallest size that acts as a blackbody at 70 µm. The uncertainty in blackbody temperature estimate () is about 10%.
In all cases, the flux densities between 33 m and 70 m are increasing, suggesting that we are observing the Wien side of the dust excess SED, thus is interpreted as an estimate of the maximum dust temperature. The corresponding minimum distance from the star of the emitting material was found from the estimated maximum and the relevant using the formula for blackbody grains in Backman and Paresce (1993). The relationship between grain temperature, position (), and primary star luminosity (equation 3 of Backman & Paresce 1993) for grains larger than m, that emit efficiently at m, and have negligible albedo, is
| (1) |
where is in unit of , 3.91033 erg s-1. The model fit parameters and masses are presented in Table 4, and Figure 1 shows simple model SEDs.
The blackbody models also allow estimates of the mass in the radiating grains. Because (1) these calculations made use of a maximum dust temperature and corresponding inner radius (), also (2) lack of photometric measurements or even useful upper limits beyond the apparent peak of excess emission (70 m) prevents useful characterization of the dust outer boundary radius, and finally (3) grains larger than the minimum size assumed here would radiate the same blackbody SED but would have a higher ratio of mass to surface area, the values of and in Table 4 characterize the portion of the SED observable out to 70 µm; future observations at longer wavelengths could conceivably indicate more luminosity and dust mass.
We note that debris disk models comprised of grains slightly larger than the blowout size ( 1 µm) cannot be ruled out based on simple fits to the SED. Such a model (based on a temperature vs. position function given in equation 5 of Backman and Paresce 1993) requires an of 270 AU for a solar luminosity star and a dust mass 3 larger than the lower limit given above. We comment on the likelihood of this model in section 5.4.
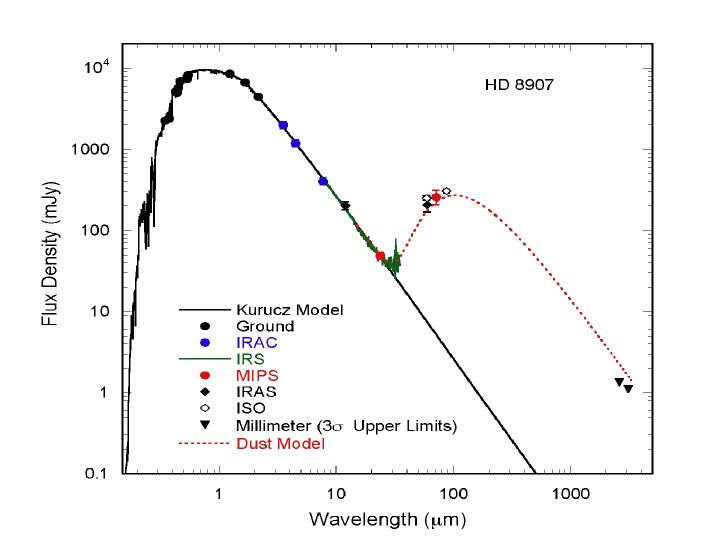
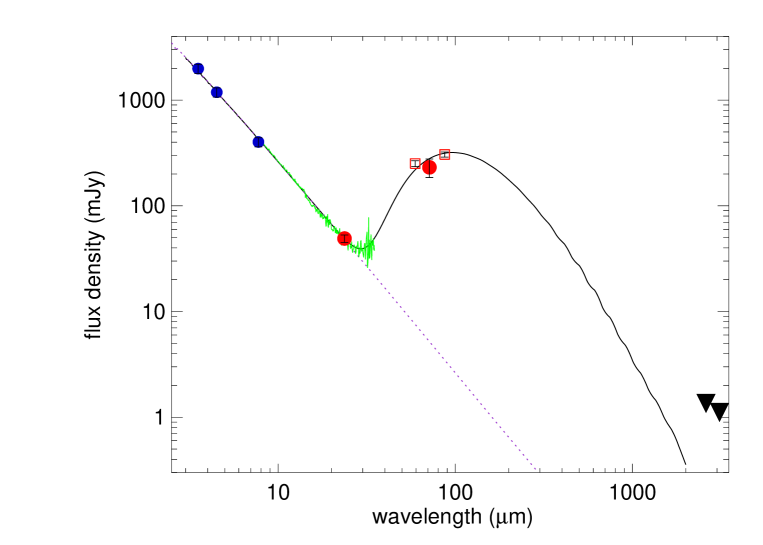
4.2 Detailed Modeling of HD 8907
The simple black body grain model yields K, the inner radius = 48 AU, a dust to stellar luminosity ratio (log ) , and a dust mass log () for 10 m radius blackbody grains with grain density 2.5 g cm-3.
The detection of significant excess emission from HD 8907 at several wavelengths allows us to conduct a more thorough analysis of that system. Therefore we modeled the SED of HD 8907 using the dust disk models of Wolf & Hillenbrand (2003, WH03; 2005). We used the Levenberg-Marquardt algorithm to solve the least-squares problem, giving a best-fit dust disk model (Marquardt 1963; Markwardt 2003 333http://cow.physics.wisc.edu/craigm/idl/fitting.html). A detailed description of the fitting algorithm will be given in Rodmann et al. (2005). Due to lack of mineralogical features in the IRS spectrum, we assumed the optical properties of astronomical silicates (Draine & Lee 1984; Laor & Draine 1993; Weingartner & Draine 2001).
We assumed the density profile to be , corresponding to a disk with a constant surface density . The power law exponent of the grain size distribution was set to the canonical value , characteristic for a size distribution initially produced by a collisional cascade (Dohnanyi 1969; Tanaka et al. 1996). For the maximum grain size () and the , we assumed arbitrary values of mm and AU. Grains larger than 1 mm contribute little to the infrared emission of the disks, and the outer radius is poorly constrained in the absence of sub-millimeter/millimeter data. We used an upper limit at mm (Carpenter et al. 2005) to constrain flux of the disk models at mm wavelengths. We then fit for three parameters simultaneously in a sense: , , and Mdust in grains smaller than 1 mm. The first two parameters influence the shape of the SED and the wavelength at which the disk emission begins to depart from the stellar photosphere; the latter only scales the dust reemission to match the peak of the infrared emission.
Figure 5 shows the SED of HD 8907 with the WH03 model result using astronomical silicate and grain radii range from 6 µm 1 mm. The result suggests 42.5 AU, with dust mass of 1.7 . The larger dust mass compared to the mass estimate from the simple blackbody model is from the inclusion of larger grains, which contribute the bulk of the mass even though they do not contribute to the bulk of the infrared emission. The 1 uncertainty level for each parameters used in our modeling are: () 20 AU (50%); () 3 µm(50%); and () 3.3 10-3 (20%). These parameter uncertainties are estimated from the covariance matrix (inverse of the curvature function) by the LevenbergMarquardt algorithm.
4.3 On the Presence of Warm Dust Mass Within
The selection of debris disks for this investigation is purposely biased against objects with debris at temperatures warmer than K. However, in our own solar system we observe a warm component associated with debris from the asteroid belt. Such a warm component, albeit faint, has also been verified in other debris systems, e.g., around an A-star HR 4796A (e.g., Koerner et al. 1998), and recently with Spitzer imaging of Fomalhaut (Stapelfeldt et al. 2004). We do not have the luxury of high resolution imaging of the five Sun-like stars presented herein, so we have to rely on the SEDs to place upper limits on the warm dust components.
Table 5 presents upper limits to the amount of warm dust located interior to the outer disk inner boundaries () in each system. These were evaluated by assuming that dust in these locations would be drifting in from the denser outer source zones via P-R radiation drag and thus would extend with constant surface density from inward to a radius correspond to the vaporization temperature of silicates at 1500 K at 0.1 AU from the star. For each system a surface density () upper limit was calculated for dust between sublimation radius, (1500 K) and of the outer disk model such that the summed SEDs of inner dust model plus outer dust model plus stellar photosphere was less than the upper limit to the observed SED, i.e., observations plus 1 uncertainty including calibration, as defined above. This was then converted to dust mass limits assuming 10m grains with material density of 2.5 g cm-3 as for the blackbody models of the cool outer disks. These masses are of order 10-6 M⊕, the mass of a single asteroid only a few hundred km in diameter, and are generally 23 orders of magnitude below the lower limits for the masses we derive for the outer cool dust. Note that our Spitzer observations of HD 13974, which shows photospheric emission up to 70 m, yield an upper limit on warm dust surface density equivalent to only about 20 times that of the zodiacal cloud in our solar system (i.e., 20 ”zodis”).
5 DISCUSSION
A primary goal of the FEPS project is to place our solar system in context with other debris disk systems (Meyer et al. 2005). To date, most disk systems identified with IRAS and ISO have been associated with either stars more luminous than the Sun (typically A-stars), or very young systems ( 30 Myrs). A recent census of Sun-like stars with KB-like disks that have been identified with IRAS and ISO has been presented by Decin et al. (2003) and Zuckerman & Song (2004), but these studies were only able to identify the brightest systems and did not cover a large range of ages that encompass stars approaching the age of our Sun.
The FEPS sample is a coherent effort to understand the debris systems around Sun-like stars over a large range of ages from 3 Myrs – 3 Gyrs. We are beginning to assemble a sufficiently large sample of objects over a range of ages to start to answer fundamental questions about the evolution of dust disks surrounding Sun-like systems with Spitzer data.
5.1 Age Determination
The age determination of all of the stars in the full FEPS sample is discussed in Hillenbrand et al. (2005). Age bins given for the five stars (Table 3) in this study are inferred from the level of chromospheric and coronal activity. The chromospheric activity is indicated by CaII H&K emission. Values of the fractional luminosity emitted in the H&K lines, , were derived by Soderblom (2000, private communication). Here we adopt the calibration of Donahue (1993) between log and age. Coronal activity, on the other hand, is indicated by X-rays. The fractional X-ray luminosity, , in general tracks ; for HD 8907 in particular, relative youth is indicated by both activity indicators. We use coarse age bins rather than specific ages due to the uncertainty in the age estimates.
5.2 Solar System Evolutionary Model
The total mass of the KB in the solar system is highly uncertain, however some recent studies (e.g., Luu & Jewitt 2003, Teplitz et al. 1999) suggest its total mass is in the range 0.01 1.0 M⊕, mostly in large planetesimal bodies. From COBE observations at wavelengths 150 m and 240 m, Backman et al. (1995) estimated upper limits on KB dust luminosity of 10-6. This corresponds to a KB infrared dust mass limit of 10 assuming grains with 10 m and = 2.5 g cm-3 as in the present paper’s models of exo-KBs. For comparison, Moro-Martín & Malhotra (2003) estimate a KB mass of about 410-6M⊕ in particles with sizes between 2.4 m and 160 m based on flux of KB dust detected drifting toward Jupiter’s orbit (Landgraf et al. 2002). We see that the systems considered in this paper contain more massive and luminous dust ensembles than does the KB. But what would our own KB have looked like at the younger evolutionary stages represented by these five objects?
Backman et al. (2005) have devised a simple evolutionary model of the KB based on the model of the current KB in Backman et al. (1995) that can be used to estimate what our system would have looked like at the ages, distances and stellar luminosities of our targets. The model assumes the planetesimal population in the KB of these solar systems extends from 40 AU to 50 AU at the ages of our targets, after migration of the outer planets and KB had been completed (Malhotra 1993; Levison et al. 2004), and the influence by Neptune (at 30 AU) had eroded the belt substantially inward of the 3:2 resonance at R AU. The model also assumes that the starting mass of the KB was 10 M⊕, the minimum necessary to yield a high enough density to build the observed large KB bodies accretionally in the allowed time span (Stern & Colwell, 1997). The model evolution is not very sensitive to the starting mass because a purely collisional system evolves asymptotically toward a state in which the collision timescale is approximately equal to the age of the system. For example, a wide range of starting masses evolve in this model to a KB with a mass of about 0.5 M⊕ at age 4.5 Gyr. This means that, in a dissipative system such as this, evidence of the original state is mostly erased and cannot be inferred by modeling backwards.
A parent body size of 10 km and maximum fragment size of 5 km were parameters tuned to yield a KB dust population at an age 4.5 Gyr consistent with present limits on KB dust emission (Backman et al. 1995; Teplitz et al. 1999) and inference of the KB dust production rate from dust impact rates in the outer solar system (Landgraf et al. 2002). The dust distribution and thermal emission were calculated for 30 logarithmically spaced size bins between 1 m and 1 mm diameter. An equilibrium spatial distribution of dust was calculated, as in Backman et al. (1995), balancing the dust between production in planetesimal collisions, inward drift of dust via P-R radiation drag, and destruction by mutual collisions of dust yielding fragments smaller than the blowout size. The dust distribution was modeled both within the planetesimal zone at 40 50 AU and in a P-R induced “zodiacal” dust cloud extending inward and assumed completely truncated at 30 AU.
Results of the KB evolutionary model runs are presented in Table 6, where columns 3 and 4 are the predicted and observed 70 m excess fluxes of each source. Remarkably, although the solar system evolutionary model was tuned only to represent our KB, the results are within a factor of only 2 3 from the targets’ observed 70 m excesses, except for the HD 13974.
The solar system KB evolution model predicts a 70 µm excess of 21 mJy for the Sun observed from 30 pc at an age of 4.6 yrs (on top of 5 mJy photosphere). This predicted excess flux is less than any of the 5 detected excess sources, e.g., about 30 % of the dust flux at 70 µm observed for HD 145229 with 0.96 L☉ observed at 33 pc. Therefore the solar system present-day KB model has about 30 % of the dust mass of the HD 145229 cold dust. These calculations indicate the possibility that the target systems represent snap shots of the history of our own solar system suggesting that systems like our own might be common among G stars in the galactic disk.
5.3 HD 13974
HD 13974 is a short period binary system (period = 10 days, Duquennoy & Mayor 1988) with a G0V primary (Duquennoy & Mayor 1988) and a companion with spectral type between G9V (Duquennoy & Mayor 1988) and K4V (Hummel et al. 1995). HD 13974 at 11 pc is the only star in our FEPS sample to date with a 70 m detection that is consistent with “bare” photospheres within the calibration and Kurucz model uncertainties (Figure 2). A two-component Kurucz model was fitted to the observed SED with derived temperatures of 6215 K and 4493 K for the primary and secondary components respectively. The semi-major axis of these stars are 1.45 0.03 106 km and 1.62 0.04 106 km (Duquennoy & Mayor 1988). Such a close ( 1 AU) binary star system should not have a dramatic effect on the evolution of the circumbinary disk at distances greater than roughly twice the semi-major axis (e.g., Jensen et al. 1996; Artymowicz & Lubow 1994 ).
Adopting the blackbody grain model we have used the 1 uncertainty in the observed flux density at 70 m compared with the predicted Kurucz model flux to place an upper limit on the mass of dust log () at 55 K. The lower limit on is about 28 AU. The fractional dust luminosity log () of this system is interesting, as it is similar to the estimates for the current solar system Kuiper Belt. The solar system KB evolutionary model predicts 70 m excess flux density of HD 13974 at its age (1 3 Gyr) to be about 300 mJy, while the observed excess flux density limit is 20 mJy (Table 6). This system may not contain KB bodies, or perhaps there is not a perturbing planet like Neptune to stir up the system and cause collisional cascades.
5.4 Possible Planetary Architectures in the Five IR-Excess Stars
For the five systems in which 70 m excesses have been detected, the comparison between the disk mass estimate ( in Table 4), and the upper limit to the amount of warm dust ( in Table 5) located interior to the inner boundary of the dust ( in Table 4), indicates that the dust depletion inside is significant. Because grains not directly ejected by radiation pressure tend to spiral toward the star due to P-R drag, a central depletion would be filled in by dust on P-R timescales (Table 5) much shorter than the ages of these systems, unless some other mechanism intervenes to eliminate grains. We argue that ice sublimation and grain “blowout” both fail to explain the locations in these systems, and that a possible explanation for the dust spatial distribution is a sizable planet in each system limiting the inward drift of the grains by ejecting them out of the system via gravitational scattering.
An upper limit of the location () at which grains will sublimate can be calculated by assuming that they are composed of water ice with sublimation temperature 100 K. The maximum grain temperatures () observed in these systems presented in Table 4 are all well below the ice sublimation temperature. The presence of grains large enough to radiate efficiently at 70 m implies that their temperature will scale as (Backman & Paresce, 1993). The radius of ice sublimation will be of for in the range K. and thus sublimation is not a likely explanation for the inner depletion of the disk. The uncertainties in the temperature estimate are about 10% for individual sources.
Can these central zones that are relatively free of dust be explained as the result of dust grains in the outer rings being controlled by mutual collisions rather than P-R drag? Thus the inner edge of the dust distribution might be explained without invoking the existence of a planet to consume inward drifting grains. In their study of the age dependence of Vega-like excesses, Dominik & Decin (2003) argued that in dense enough disks, the collision time scale is much shorter than the P-R drag time scale. If grain collisions actually dominate P-R drag as the dominant dynamical process then grains could be ground to the blowout size, and would not drift radially. In that case, the inner edge to the dust distribution could represent the inner edge of the source bodies. The dust collision timescales () for the disks can be estimated as /9, where is the orbital period at and is the fractional surface density of the disks that is of order the value of (Backman & Paresce 1993; Backman 2004). The timescales for particles to drift via P-R drag over distances equal to 10% of the values in table 4 (i.e., an estimate of the time for grains to move from populated to relatively unpopulated regions) are about log 5.5 to 6.0 years. The grain-grain collision timescales for the same systems are about log 5.0 to 5.5 years. For ratios of this sort between and , a substantial fraction of grains would survive enough collision lifetimes to be able to drift from the disk into a central void. Note also that without knowing more about the disks (especially, their vertical extents) we do not know if grain-grain collisions would be at high enough speeds to destroy the grains. Thus we conclude that P-R drag is important in controlling the structures of these systems, especially in that a planetary barrier would be a plausible explanation for a central depletion.
Could these cold disks arise from grains generated recently from planetesimals located near and then ejected by radiation pressure from the system, again without needing a planet to explain the inner boundary of the disk? We note that these debris belts can be self-stirred without needing a planet to explain the collisional cascade itself (e.g., also Kenyon & Bromley 2004). Recent Spitzer observations of Vega at 24, 70, and 160 m show that the Vega debris disk has an inner boundary at 86 AU, and extends to distances much larger than those observed at submm and mm wavelengths (Su et al. 2005). The authors suggest that the grains in the Vega far-IR disk are produced close to the inner disk boundary and are unbound, flowing away from the star. In this scenario, the inner gap in the disk would simply represent a limit to the location of the parent bodies, rather than the location of a perturbing planet. However, Vega’s luminosity to mass ratio (L/M) is 24 in solar units, which makes even relatively large grains (like the 18 µm grains) to be unbound, with 0.5, if the grain’s porosity is 0.56. ( is the ratio of the radiation pressure force to the gravitational force). In contrast, for the G star systems we consider here with L/M 1, the 10 µm silicate grains that dominate the dust emission at 70 µm have 0.02. Therefore, we argue that grains in the five disks discussed here are bound and as such will drift toward the star due to P-R drag.
One explanation for the inner empty zones is that one or more massive planets dynamically deplete the dust generated by an outer belt of planetesimals (e.g., Liou & Zook 1999, Moro-Martín & Malhotra 2003, 2005). If we assume a single planet in a circular orbit about each of the five stars, then this mechanism can account for the large dust depletion factors inferred for the inner parts of these dust disks if the planet is 1 MJupiter (Moro-Martín and Malhotra 2005). The inner edge of the dust disk would be located between 0.8 and 1.25 , where is the semi-major axis of the planet. Therefore, a possible explanation is that the dust disk surrounding each of these five systems harbors a planet with an orbital radius of approximately 10 20 AU, together with a belt of dust-production planetesimals exterior to the planet’s orbit, and no asteroid belt with significant dust production interior to the planet’s orbit.
As noted in §4.1, the data are also consistent with a debris disk comprised of 1 µm sized grains, inconsistent with the assumptions required for blackbody emission discussed above, yet larger than the blowout size. In such a model, the timescale for mutual collisions is more than 100 times shorter than the timescale for P–R drag to significantly affect the orbital radius. This suggests that a ring such as inferred from the model could be maintained through mutual collisions with dust removal dominated by radiation pressure blowout of the smallest particles 1 m on short timescales. However, this requires the formation of a sun–like star lacking an inner disk, with a remnant planetesimal belt capable of generating dust through mutual collisions only outside of 200 AU with dust only at the smallest possible stable particle size. While the presence of a low mass companion could in principle explain such a large gap in the circumstellar environment, no wide stellar companions are known in these systems, and we do not expect many brown dwarfs (due to the observed lack of such systems) or giant planets (given current formation scenarios) at these radii. We believe that models requiring larger grains ( 10 µm) at smaller radii ( 30 AU) with the possible presence of a planet (or planetary system) interior to 30 AU are favored as they are consistent with the structure and extent of circumstellar disks observed around pre–main sequence stars during the epochs when planetary systems are thought to form. We hope to distinguish between these two hypotheses in the future through direct imaging of the outer edge of the disks in scattered light and placing strong constraints on the presence of very low mass companions at large separations (e.g. with NICMOS coronagraphy on HST and ground–based AO observations).
6 SUMMARY
We have presented Spitzer observations of five Sun-like stars that possess Kuiper Belt-like debris systems (HD 6963, HD 8907, HD 122652, HD 145229, and HD 206374). Of these two were previously suggested to have debris disks (HD 8907 and HD 122652), and three are newly discovered. The fractional luminosity () and ages of these newly identified disks illustrates the potential of the FEPS program to measure fainter debris systems, which will allow a more detailed census of their nature and evolution.
We summarize our results:
1. The five excess sources have SEDs that are consistent with photospheric models out to 33m, but show clear excesses at 70 m, which was the selection criterion. We find that these stars are all ”old” (four sources are in our 1 3 Gyr age bin, while one, HD 145229, is in the 0.3 1 Gyr age bin).
2. As seen in Figure 3, the improved sensitivity of Spitzer allows us to detect debris disk systems that are much fainter than those detected by IRAS and ISO. The overall impression is that KB-like systems detectable by Spitzer and considered in this paper are less massive and more distant than systems detected with IRAS and ISO.
3. Another star, HD 13974, has a MIPS 70 m flux consistent with photospheric emission within 1 total uncertainty. The upper limit of log() is , similar to that of inferred for the solar systems’ KB.
4. Simple blackbody grain modeling of our 5 excess SEDs yielded log() , color temperatures between 55 58 K, and inner radii of outer disks between 18 and 46 AU.
5. A solar system KB evolution model predicts Spitzer 70 m fluxes (Table 6) from hypothetical planetesimal assemblages around our target stars that are within factors of 2 3 of the observed fluxes. We infer that these systems have outer remnant planetesimal belts that are consistent in scale and starting masses to our Kuiper Belt.
6. The absence of a disk around the Gyr old star HD 13974 suggests that either this object does not contain the parent bodies that produce infrared-emitting debris, or perhaps the debris has been cleared out already.
7. We placed upper limits on warm dust masses interior to for each of these systems, and showed that the depletion of the disk is significant. We commented on several possible causes for . We speculate that the of exo-KBs presented in this study could be explained by the existence of one or more Jupiter mass planets at 10 20 AU from each star.
References
- Ardilla et al. (2004) Ardila, D. R., Golimowski, D. A., Krist, J. E. et al. 2004, ApJ, 617, L147
- Artymowicz (1988) Artymowicz, P. 1988, ApJ, 335, L79
- Artymowicz & Lubow (1994) Artymowicz, P. & Lubow, S. H. 1994, ApJ, 421, 651
- Auman et al. (1984) Aumann, H. H., et al. 1984, ApJ, 278, L23
- Backman et al. (2005) Backman et al. 2005, in prep.
- Backman et al. (1995) Backman, D. E., Dasgupta, A., & Stencel, R. E. 1995, ApJ, 450, L35
- Backman & Paresce (1993) Backman, D. E., & Paresce, F. 1993, in Protostars and Planets III, ed. E. Levy & J. I.Lunine (Tucson: Univ. Arizona Press), 1253
- Beichman et al. (2005) Beichman et al. 2005, ApJ, in press
- Bouwman et al. (2005) Bouwman, J., et al. 2005, in prep.
- Burns et al. (1979) Burns, J. A., Lamy, P. L., & Soter, S. 1979, Icarus, 40, 1
- Carpenter et al. (2005) Carpenter, J. M., Wolf, S., Schreyer, K., Launhardt, R., Henning, T. 2005, AJ, 129, 1049
- Chen et al. (2005) Chen, C. H., Jura, M., Gordon, K. D., & Blaylock, M. 2005, ApJ, in press
- Cohen et al. (2003a) Cohen, M., Megeath, S. T., Hammersley, P. L., Martiín-Luis, F., & Stauffer, J. 2003a, AJ, 125, 2645
- Cohen et al. (2003b) Cohen, M., Wheaton, W., & Megeath, S. T. 2003b, AJ, 126, 1090
- Decin et al. (2003) Decin, G., Dominik, C., Waters, L. B. F. M., & Waelkens, C. 2003, ApJ, 598, 636
- Dominik & Decin (2003) Dominik, C., & Decin, G. 2003, ApJ, 598, 626
- Donahue (1993) Donahue, R.A. 1993, Ph.D. Thesis, University of New Mexico
- Dohnanyi (1969) Dohnanyi, J. W. 1969, J. Geophys. Res, 74, 2531
- Draine & Lee (1984) Draine, B.T. & Lee, H.-M. 1984, ApJ, 285, 80
- Duquennoy & Mayor (1988) Duquennoy, A. & Mayor, M. 1988, A&A, 195, 129.
- Fazio et al. (2004) Fazio. G. G., et al. 2004, ApJS, 154, 10
- Gordon et al. (2004) Gordon, K. D., et al. 2004, in ”Optical, Infrared, and Millimeter Space Telescopes”, (SPIE vol. 5487), ed. J. C. Mather, 177
- Gordon et al. (2005) Gordon, K. D., et al. 2005, PASP, in press
- Greaves et al. (2004) Greaves, J. S., Wyatt, M. C., Holland, W. S., & Dent, W. R. F. 2004, MNRAS, 351, L54
- Habing et al. (1999) Habing, H., Dominik, C., Jourdain de Muizon, M., et al. 1999, Nature, 401, 456
- Higdon et al. (2004) Higdon, S. J. U. et. al. 2004, PASP, 116, 975
- Hines et al. (2004) Hines et al. 2004, FEPS Explanatory Supplement V1.1, SSC, Pasadena
- Hines et al. (2005) Hines, D. C., 2005, submitted
- Hillenbrand et al. (2005) Hillenbrand, L. A., et al. 2005, submitted
- Halbwachs et al. (2003) Halbwachs et al. 2003, A&A 397, 159
- Houck et al. (2004) Houck. J. R., et al. 2004, ApJS, 154, 18
- Hummel et al. (1995) Hummel, C. A., Armstrong, J. T., Buscher, D. F., Mozurkewich, D., Quirrenbach, A., & Vivekanand, M. 1995, AJ, 110, 376
- Jensen et al. (1996) Jensen, E. L. N., Koerner, D. W., & Mathieu, R. D. 1996, AJ, 111, 2431
- Jewitt & Luu (1993) Jewitt, D. & Luu, J. 1993, Nature, 362, 730
- Kenyon & Bromley (2004) Kenyon, S. J., & Bromley, B. C. 2004, ApJ, 602, L133
- Keorner et al. (1998) Koerner, D. W., Ressler, M. E., Werner, M. W., & Backman, D. E. 1998, ApJ, 503, L83
- Landgraf et al. (2002) Landgraf et al. 2002, AJ, 123, L285
- Laor & Draine (1993) Laor, A. & Draine, B.T. 1993, ApJ, 402, 441
- Levison et al. (2004) Levison, H. F., Morbidelli, A., & Dones, L. 2004, AJ, 128, L2553
- Liou & Zook (1999) Liou, J.-C. & Zook, H. A. 1999, AJ, 118. 580
- Luu & Jewitt (2002) Luu, J. X., & Jewitt, D. C. 2002, ARA&A, 40, 63
- Malhotra (1993) Malhotra, R. 1993, Nature, 365, 819
- Malhotra (1995) Malhotra, R. 1995, AJ, 110, 420
- Mamajek et al. (2002) Mamajek, E. E., Meyer, M. R., & Liebert, J. 2002, AJ, 124, 1670
- Mannings & Barlow (1998) Mannings, V. & Barlow, M. J. 1998, ApJ, 497, 330
- Marquardt (1963) Marquardt, D.W. 1963, Journal of the Society for Industrial and Applied Mathematics, vol. 11, pp. 431-441
- Metchev et al. (2004) Metchev, S. A., Hillenbrand, L. A., & Meyer, M. R. 2004, ApJ, 600, 435
- Moro-Martín & Malhotra (2003) Moro-Martín, A. & Malhotra, R. 2003, AJ, 125, 2255
- Moro-Martín & Malhotra (2003) Moro-Martín, A. & Malhotra, R. 2005, AJ, submitted
- Meyer & FEPS collaboration (2004) Meyer, M. R. et al. 2004, ApJS, 154, 422
- Meyer & FEPS collaboration (2005) Meyer, M. R. et al. 2005, in preparation
- Reach et al. (2003) Reach, W. T., Morris, P., Boulanger, F., Okumura, K. 2003, Icarus, 164, 384
- Rieke et al. (2004) Rieke, G. H., et al. 2004, ApJS, 154, 25
- Rodmann et al. (2005) Rodmann, J. et al. 2005, in preparation
- Schneider et al. (2001) Schneider, G., Becklin, E. E., Smith, B. A., Weinberger, A. J., Silverstone, M., & Hines, D. C. AJ, 121, 525
- Schneider & Stobie (2002) Schneider, G. & Stobie, 2002, ASP Conf. Ser. 281, Astronomical Data Analysis Software and System XI, ed. D. A. Bohlender, D. Durand, & T. H. Handley (San Francisco: ASP) version 2.9
- Silverstone et al. (2000) Silverstone, M.D. 2000, Ph. D. Thesis
- Silverstone et al. (2005) Silverstone, M.D. et al. 2005, submitted
- Spangler et al. (2001) Spangler, C., Sargent, A. I., Silverstone, M. D., Becklin, E. E., & Zuckerman, B. 2001, ApJ, 555, 932
- Stapelfeldt et al. (2004) Stapelfeldt, K. R. et al. 2004, ApJS, 154, 458
- Stern & Colwell (1997) Stern, S. A. & Colwell, J. E. 1997, AJ, 114, 841
- Su et al. (2005) Su, K. Y. L. et al. 2005, ApJ, in print
- Tanaka et al. (1996) Tanaka, H., Inaba, S., Nakazawa, K. 1996, Icarus, 123, 450
- Teplitz et al. (1999) Teplitz, V. L., Stern, S. A., Anderson, J. D., Rosenbaum, D., Scalise, R. I., & Wentzler, P. 1999, ApJ, 516, 425
- Weingartner & Draine (2001) Weingartner, J. C. & Draine, B. T. 2001, ApJ, 548, 296
- Welsh et al. (1998) Welsh, B. Y., Crifo, F., & Lallement, R. 1998, A&A, 333, 101
- Werner et al. (2004) Werner, M. W., et al. 2004, ApJS, 154, 1
- Williams et al. (2004) Williams, J. P., Najita, J., Liu, M. C., Bottinelli, S., Carpenter, J. M., Hillenbrand, L. A., Meyer, M. R., & Soderblom, D. R. 2004, ApJ, 604, 414
- Wolf & Hillenbrand (2003) Wolf, S., & Hillenbrand, L. A. 2003, ApJ, 596, 603 (WH03)
- Wolf & Hillenbrand (2005) Wolf, S., & Hillenbrand, L. A. 2005, Comp. Phys. Comp, in press
- Wolf & Voshchinnikov (2004) Wolf, S., & Voshchinnikov, N.V. 2004, Comp. Phys. Comm., 162, 113
- Zuckerman & Song (2004) Zuckerman, B. & Song, I. 2004, ARA&A, 42, 685
| Source | IRAC | IRS | MIPS | |||
|---|---|---|---|---|---|---|
| Obs. Date | AOR key | Obs. Date | AOR key | Obs. Date | AOR key | |
| HD 6963 | 8/06/04 | 5387776 | 8/07/04 | 5395968 | 8/18/04 | 5396224 |
| HD 8907 | 7/25/04 | 5361920 | 1/02/05 | 5362176 | 8/23/04 | 5362432 |
| HD 13974 | 8/14/04 | 5410816 | 8/07/04 | 5411072 | 8/27/04 | 5411328 |
| HD 122652 | 6/29/04 | 5427712 | 6/06/04 | 5427968 | 6/22/04 | 5428224 |
| HD 145229 | 7/19/04 | 5387264 | 7/17/04 | 5387520 | 8/06/04 | 5387776 |
| HD 206374 | 7/04/04 | 5414656 | 6/06/04 | 5414912 | 7/11/04 | 5415168 |
| Source | 3.6m | 4.5m | 8.0m | 24 m | 33mbb33m synthetic photometry from IRS low resolution spectra | 70 m |
|---|---|---|---|---|---|---|
| HD 6963 | 1263 126 | 729 73 | 255 26 | 31 3 | 19 3 | 32 7 |
| HD 8907 | 1985 199 | 1186 119 | 402 40 | 49 5 | 41 6 | 231 46 |
| HD 13974 | 15274 1527 | 8970 897 | 3079 308 | 360 36 | 186 28 | 44 10 |
| HD 122652 | 1307 131 | 771 77 | 265 27 | 34 3 | 21 3 | 67 14 |
| HD 145229 | 1167 117 | 695 70 | 237 24 | 29 3 | 22 3 | 56 12 |
| HD 206374 | 1445 145 | 842 84 | 292 29 | 34 3 | 18 3 | 22 6 |
| Source | RA | DEC | Dist. | Age | SpT | Teff | L |
|---|---|---|---|---|---|---|---|
| (J2000) | (J2000) | (pc) | (Gyr) | (K) | (L⊙) | ||
| HD 6963 | 01:10:41.91 | 42:55:54.50 | 27 | 1–3 | K0 | 5517 | 0.55 |
| HD 8907 | 01:28:34.35 | 42:16:03.70 | 34 | 1–3 | F8 | 6250 | 2.05 |
| HD 13974 | 02:17:03.23 | 34:13:27.32 | 11 | 1–3 | G0/(G9K4)aaReferences: Duquennoy & Mayor (1988), Hummel et al. (1995) | 6215/4493bbsee §5.3 for more discussion. | 1.18ccDust mass in debris disk |
| HD 122652 | 14:02:31.63 | 31:39:39.09 | 37 | 1–3 | F8 | 6157 | 1.55 |
| HD 145229 | 16:09:26.63 | 11:34:28.25 | 33 | 0.3–1 | G0 | 5893 | 0.96 |
| HD 206374 | 21:41:06.19 | 26:45:02.25 | 27 | 1–3 | G6.5 | 5580 | 0.74ccDust mass in debris disk |
| Source | aagrain radius used for blackbody models | bbStellar luminosity was estimated from mag, distance, and bolometric correction for the star’s temperature and spectral class. | log (/)ccDust mass in debris disk | log (/)ddFractional luminosity ratio | ee is color temperature estimated from 33m/70 m flux ratio. Uncertainty in is about 10%. | distance | SpT | References |
|---|---|---|---|---|---|---|---|---|
| (m) | (AU) | (K) | (pc) | |||||
| HD 6963 | 10 | 18 | 57 | 33 | G0 | This study | ||
| HD 8907 | 10 | 48ff 42.5 AU from more sophisticated debris disk modeling (see § 4.2). | 48 | 34 | F8 | This study, Silverstone (2000) | ||
| HD 13974ggThe 70m flux of HD 13974 is consistent with photospheric emission within a total (absolute calibration and random) uncertainty. | 10 | 28 | 55 | 22 | G0V | This study, photosphere | ||
| HD 122652 | 10 | 31 | 56 | 37 | F8 | This study | ||
| HD 145229 | 10 | 24 | 56 | 33 | G0 | This study | ||
| HD 206374 | 10 | 20 | hhFor HD 206374 is an upper limit. upper limit and known excess flux at 70 m correspond to lower limits on , because more dust would be needed to equal the 70 m flux if the actual is lower than 57 K, but to an upper limit on / because that scales as . | 57 | 27 | G6.5 | This study |
| Source | log | log | constraint | log ()aaTotal dust mass assuming grain radius of 10 m at R Rin, scaled by material density relative to 2.5 g cm-3. | |||
|---|---|---|---|---|---|---|---|
| (m) | (m) | (AU) | (yr) | (yr) | (M⊕) | ||
| HD 6963 | 0.35 | 1.1 | 18 | 7.0 | 6.5 | IRS 33 | |
| HD 8907 | 0.85 | 2.7 | 48 | 6.5 | 6.0 | IRS 33 | |
| HD 13974 | 0.58 | 1.9 | 28 | 7.0 | 6.5 | MIPS 70 | |
| HD 122652 | 0.68 | 2.2 | 31 | 6.8 | 6.3 | IRS 33 | |
| HD 145229 | 0.49 | 1.6 | 24 | 7.0 | 6.5 | IRS 33 | |
| HD 206374 | 0.43 | 1.4 | 20 | 6.9 | 6.4 | IRS 33 |
| Source | Age | (Toy S.S.)aaexcess fluxes | (Obs.)aaexcess fluxes |
|---|---|---|---|
| (Gyr) | (mJy) | (mJy) | |
| HD 6963 | 1.0–3.0 | 70 | 30 |
| HD 8907 | 1.0–3.0 | 170 | 225 |
| HD 13974 | 1.0–3.0 | 300 | 20 |
| HD 122652 | 1.0–3.0 | 20 | 65 |
| HD 145229 | 0.3–1.0 | 70 | 55 |
| HD 206374 | 1.0–3.0 | 58 | 22 |