11email: stritzin@mpa-garching.mpg.de 22institutetext: European Southern Observatory, Karl-Schwarzschild-Str. 2, 85748 Garching bei München, Germany
22email: bleibundgut@eso.org 33institutetext: Universitätssternwarte München, Scheiner-Str. 1, 81679 München, Germany
33email: swalch@usm.uni-muenchen.de
Constraints on the Progenitor Systems of Type Ia Supernovae
UVOIR bolometric light curves provide a valuable insight into the nature of type Ia supernovae. We present an analysis of sixteen well-observed SNe Ia. Constraints are placed on several global parameters concerning the progenitor system, explosion mechanism and subsequent radiation transport. By fitting a radioactive decay energy deposition function to the quasi-exponential phase (50 to 100 days after maximum light), it is found that the ejected mass varies by at least a factor of two. This result suggests that a sub Chandrasekhar mass white dwarf could be the progenitor system of some SNe Ia. We find that the range in the amount of synthesized indicates a significant variation in the burning mechanism. In order to explain a factor of ten range in the observed bolometric luminosity, more detailed modeling of the explosion mechanism is required.
Key Words.:
supernovae: general1 Introduction
Type Ia supernovae (hereafter SNe Ia) have become an exceptional tool in modern cosmology. Due to their large luminosity, they are used to place constraints on cosmological parameters, and as of yet, provide the only direct evidence for the existence of dark energy (Riess et al. 1998a; Perlmutter et al. 1999; Leibundgut 2001). Despite the insight SNe Ia have given us about the universe, several key issues related to the nature of their progenitor system(s) and the physics of the explosion mechanism(s) have remained unsolved (for reviews see Hillebrandt & Niemeyer 2000; Livio 2000).
Today it is commonly believed that SNe Ia emerge from the thermonuclear incineration of a carbon oxygen (C-O) white dwarf exploding near or at the Chandrasekhar mass (Nomoto, Thielemann, & Yokoi 1984; Woosley & Weaver 1986; Hillebrandt & Niemeyer 2000). The energy released from burning to nuclear statistical equilibrium (NSE) completely destroys the white dwarf. The optical/IR light curves are powered by the Comptonization of rays produced from the radioactive decay chain 56Ni 56Co 56Fe (Pankey 1962; Colgate & McKee 1969). Within this paradigm the C-O white dwarf accretes matter from an evolved massive star either via Roche lobe overflow or through stellar winds. With the detection of H in the well-observed SN 2002ic (Hamuy et al. 2003; Nomoto et al. 2004; Kotak et al. 2004) the single degenerate model has become favored over the double degenerate model.
It is clear that SNe Ia are not a homogeneous group of stellar explosions rather, they display a range in luminosity of a factor of ten or more (Suntzeff 1996; Contardo et al. 2000; Suntzeff 2003; Stritzinger 2005). In fact not one self-consistent explosion model has yet been presented that can successfully account for this observed range in luminosity. This lack of understanding of the progenitor systems is unsettling, and must be addressed, if we are to have confidence in the cosmological results provided by SNe Ia.
Fortunately, during the past decade, a number of observing campaigns (see Leibundgut 2000, for a list) have obtained excellent data sets for a large number of SNe Ia. With these data sets we are currently in a position to conduct a systematic investigation of their photometric and spectroscopic properties. The motivation of this work is to place further constraints on both the progenitor systems and explosion mechanisms with these observations. In particular, we construct UVOIR bolometric light curves from broad-band photometry of a number of SNe Ia. With the UVOIR light curve we determine several global parameters, e.g. total ejected mass, mass and the -ray escape fraction. Investigating the range of such parameters can provide insights into the nature of SNe Ia, and help differentiate between the various paths of stellar evolution that the progenitors follow, as well as the manner in which thermonuclear combustion occurs.
The structure of this paper is as follows. Sect. 2 discusses the observational data used and the UVOIR light curves. Sect. 3 describes our analysis of the UVOIR light curves. Sect. 4 contains the results of this analysis and we conclude in Sect. 5.
2 Observational data and UVOIR light curves
()-band observations for sixteen SN Ia have been procured from a variety of sources. Table 1 lists all events considered in this study along with references to the sources of the data, as well as a number of important parameters used and determined in this work. All events listed in Table 1 have excellent optical photometry that extends from pre-maximum out to days past maximum light. (See Stritzinger 2005 for more details concerning the method and sample.)
To determine the amount of produced in the explosion from the observed UVOIR flux, two parameters are required. They include an estimate for the total extinction and the distance to the host galaxy. Values listed for Galactic reddening are those given by the COBE dust maps of Schlegel et al. (1998). Host galaxy reddenings were selected from Phillips et al. (1999) for those SNe Ia that coincide with our sample. For more recent events we adopted host galaxy extinctions from the literature, with preference to those calculated by the Phillips method. The distances chosen depended mainly on what was available in the literature. For SNe Ia without a direct distance measurement, in this case, a Cepheid distance measurement or a surface brightness fluctuation (SBF) distance we used a Heliocentric velocity obtained from NED and converted this to the CMB reference frame.111Through out this work we have adopted H . For each CMB distance we have assumed an uncertainty of 300 km s-1.
With the advent of the Hubble Space Telescope (HST) there has been a substantial effort from two groups (namely the HST Key Project (HKP) and the Saha, Tammann and Sandage (STS) group) to obtain accurate Cepheid distance measurements to galaxies that have hosted SNe Ia. Typically these two independent groups determine different distances for any one galaxy, even though they use the same data and similar data reduction software. These differences are a reflection of assumptions made in their analysis. The main factor that contributes to these discrepancies is the exact - relation used, and several other subtle nuances exacerbate the problem. These include: (1) the criteria adopted to select the Cepheids used to determine the distance, (2) if and how metallicity corrections are applied, and (3) anomalies related to the camera(s) on HST (see Parodi et al. 2000; Gibson et al. 2000; Riess et al. 2005).
In short, the HKP obtains a short distance scale that leads to a value of H while the STS group determines a long distance scale that gives H . Riess et al. (2005) have reviewed this issue, in order to reconcile the distances obtained by the two groups to galaxies that have hosted a SN Ia.
Four of the SNe Ia used in our study have a direct Cepheid distance to their host galaxy and one has a Cepheid distance to its galaxy cluster. Whether the distance scale is long or short will depend on which data (i.e. from which of these two groups) we use. This in turn will lead to either an under or over estimate of the distance. This uncertainty in the distance will affect the mass we determine and hence the ejected mass.
To illustrate the effect of this on our results, we consider the galaxy NGC 3982. This galaxy has three independent Cepheid distance measurements, one from each of the two teams just mentioned and one from Riess et al. (2005) who have used a new calibration of the - relationship and an elegant metallicity correction.
The STS group has published a distance modulus of (Saha et al. 2001b), which is based on the Cepheid - relation published by Madore & Freedman (1991). Using a - relation based on 650 Cepheids located in the Large Magellanic Cloud that were observed by the Optical Gravitational Lensing Experiment (OGLE) (Udalski et al. 1999) the HKP team concluded that (Stetson et al. 2001). More recently Riess et al. (2005) used the Advanced Camera for Surveys on the HST to obtain a Cepheid distance. They used the - relation presented by Tammann & Reindl (2002) and Thim et al. (2003), based on only those Cepheids in the OGLE data set that have periods longer than 10 days. With this new - relation, and after applying a metallicity correction, Riess et al. found .
With the HKP distance modulus we obtain a mass that is 9% less compared to the STS distance modulus, and 4% less with the Riess et al. distance modulus. In turn the ejected mass derived with the HKP distance modulus is 22% greater compared to the STS distance modulus, and 13% greater compared to the Riess et al. distance modulus.
We have used a SBF distance for three SNe Ia in this sample. The zero-point for this method is based on an empirical relation derived from Cepheids, which can lead to a systematic under- or over- estimation of the distance, depending on whose Cepheids are used for the calibration. The three SBF distances we have used are calibrated with the HKP Cepheid distances of Ferrarese et al. (2000). As pointed out by Tonry et al. (2001) the zero-point for the SBF distance scale is still being improved. With the application of the Cepheids determined with the complete set of OGLE data the SBF distances used here would be 0.1 mag fainter. With this correction our derived masses would increase by 8% and the ejected masses would decrease by 16%.
Finally, in Table 1 we list two parameters calculated in this study: (1) an estimate of the amount of produced from burning to NSE (see Sect. 3.1), and (2) an estimate of the time when the ejecta makes the transition from being optically thick to optically thin (see Sect. 3.2).
To construct the UVOIR light curves we used the method already employed by Vacca & Leibundgut (1996, 1997), Contardo et al. (2000) and Stritzinger & Leibundgut (2005). We refer the reader to these articles for a more detailed description of this empirical fitting method, which we briefly summarize here.
Each filtered light curve is fitted with a ten-parameter function. This function consists of a Gaussian for the peak phase, a linear decline for the late-time decay (i.e. 56Co 56Fe), an exponentially rising function to fit the initial rise to maximum, and a second Gaussian for the inflection or secondary maximum that is observed in the -band light curves.
SNe Ia without a -band light curve, a correction was added, as described by Contardo et al. (2000). Contardo et al. used a correction based on SN 1994D (Richmond et al. 1995; Meikle et al. 1996; Smith et al. 2000), however, this event had an unusual blue color at maximum. For this reason, corrections based on SN 1994D tend to overestimate the fraction of flux associated with the -band photometry (Stritzinger 2005). Instead we employed a correction derived from SN 1992A (Suntzeff 1996). Although there are many well observed events, SN 1992A is one of the only normal SN Ia that does not suffer extinction due to host galaxy reddening.
Owing to a lack of data we did not include the fraction of flux associated with wavelengths above 10,000 Å. However, at maximum light the -bands contribute no more than (Suntzeff 1996) to the total bolometric flux. Around 60 days after maximum light, when the bolometric light curve follows nearly a linear decline, the infrared contribution rises to no more than of the total bolometric flux (Contardo 2001).
To produce the UVOIR light curve, each fitted light curve is converted to flux (ergs s-1). Next a reddening correction is applied, and then each filtered light curve is summed to obtain the total flux. Note that we do not normalize the flux to any decline rate relation (e.g. m15 (Phillips et al. 1999), MLCS (Riess et al. 1996) or stretch (Perlmutter et al. 1997; Nobili et al. 2005).
3 Determining global parameters of SNe Ia
In this section we describe the manner in which UVOIR light curves are used to determine the parameters of interest here.
3.1 mass
At maximum light the peak luminosity of a SN Ia is related, to first order, to the amount of produced during the explosion. The amount of synthesized from burning to NSE is itself thought to be largely dependent on the explosion mechanism. With the mass we are directly probing the most sensitive part of the explosion and can use observations to place constraints on the explosion mechanism.
Suntzeff (1996) showed that at maximum light 80% or more of the total flux from a SN Ia is emitted in the optical. Therefore with UVOIR light curves, constructed from broad-band photometry, one easily obtains a measure of the total flux and, through application of Arnett’s Rule, the mass. Arnett’s Rule states that at maximum light, the luminosity of a SN Ia is equal to the instantaneous energy deposition rate from the radioactive decays within the expanding ejecta (Arnett 1982; Arnett et al. 1985). To determine the mass we use the simple relation that gives for 1 M☉ of , a total luminosity at maximum light of
| (1) |
The error in Eq. (1) corresponds to a 3-day uncertainty in the adopted bolometric rise time of 19 days (see Sect. 4.1 of Stritzinger & Leibundgut 2005, for more details). As approximately 10% of the total flux at maximum light is emitted outside of the optical, each mass derived from Eq. (1) has been increased by a factor of 1.1. The dominant errors in the deduced mass are associated with the adopted distance to the host galaxy and the total extinction (Contardo et al. 2000).
3.2 Total ejected mass
To place constraints on the ejected mass we perform a least-squares fit of a radioactive beta-decay energy (RDE) deposition function to the post maximum phase UVOIR light curve. Prior works that discuss this method include the pioneering investigations of Colgate et al. (1980a, b), followed by the more sophisticated treatment presented by Jeffery (1999); (see also Cappellaro et al. 1997, Milne, The, & Leising 1999 and Milne, The, & Leising 2001 for similar methods and techniques.) However, as of yet, no attempt has been made to apply such a method to UVOIR light curves derived from real observations.
An expression for the energy deposition of NNi0 atoms of in the optically thin limit (i.e. when ) is represented by
| (2) |
and are the respective e-folding decay times of 8.8 and 111.3 days for 56Ni and 56Co. (1.75 MeV) is the energy released per 56Ni 56Co decay. (0.12 MeV) and (3.61 MeV) are the positron and -ray energies released per 56Co 56Fe decay (for a detailed discussion of the radioactive properties of this decay chain see, e.g. Nadyozhin 1994.) Note that throughout this work we assume that all neutrinos produced from the decay chain escape the ejecta entirely and do not contribute to the observed UVOIR flux.
As Eq. (2) is only applicable in the optically thin limit, when the thermalized photons can freely escape, it is safe to assume that at these epochs the majority of has decayed to 56Co, and therefore the remaining amounts of provides a negligible contribution to the energy deposition. At these epochs the UVOIR light curve appears to be nearly first order exponential, however it is more accurately described as ‘quasi-exponential’ (see Jeffery 1999, for a detailed discussion). With the presence of only one radioactive species, the mean optical depth has a simple t-2 dependence:
| (3) |
If we replace in Eq. (2) with Eq. (3), and then perform a least-squares fit of Eq. (2) to the UVOIR light curve (between 50 and 100 days past maximum light when Eq. (2) is valid), we can determine the ‘fiducial time’ t∘. It is at this time that the ejecta becomes optically thin.
Following the discussion of Jeffery (1999), one finds that t∘ can be expressed as
| (4) |
The variable Mej is the total ejected mass, is the -ray mean opacity, ve is the e-folding velocity of an exponential model’s density profile, and q is a general form factor that describes the distribution of in the ejecta.
During the optically thin phase for an all-metal ejecta (), is expected to be in the range 0.025 to 0.033 cm2 g-1 (see Swartz et al. 1995; Jeffery 1999, and references therein for a detailed discussion). We adopted the value of 0.025 cm2 g-1 as our fiducial -ray mean opacity.
Jeffery (1999) lists the model e-folding velocity of several successful 1-D explosion models consisting of 1.4 M☉ Chandrasekhar-size white dwarfs. These e-folding velocities are 2700 km s-1 for W7 (Nomoto, Thielemann, & Yokoi 1984), 2750 km s-1 for DD4 (Woosley & Weaver 1994a), and 3000 km s-1 for M36 (Höflich 1995). In addition Jeffery et al. (1992) found that the DD2 model of Woosley (1991) has a e-folding velocity of 3160 km s-1.
More recently Röpke & Hillebrandt (2004) published two full-star 3-D explosion models of a 1.4 M☉ white dwarf; with different ignition conditions: a centrally ignited configuration (c3_4) and a foamy multi-bubble flame structure (1). Using Eq. (A10) of Jeffery (1999) and parameters given in Table 1 of Röpke & Hillebrandt (2004), we have calculated the e-folding velocities for these two models. The e-folding velocities correspond to 1611 km s-1 for the c3_4 simulation and 1842 km s-1 for the 1 simulation. These values are substantially smaller than the previously cited 1-D models and reflect the difference between the density profiles generated by 1-D and 3-D simulations. Note that all these models are based on the explosion of a 1.4 M☉ Chandrasekhar-size white dwarf. In the calculations presented below we arbitrarily adopted 3000 km s-1 as our ‘average’ fiducial e-folding velocity.
The parameter q is equal to one for high concentrations of at the center of the ejecta, small for low concentrations within the center, and one-third for the case when the is evenly distributed throughout the ejecta (see Jeffery 1999, for a detailed discussion). There is mounting evidence that an appreciable amount of is moderately mixed within the ejecta. However, it is likely that the amount of mixing may vary significantly from supernova to supernova.
An analysis of early-time spectra of SN 1991T (Ruiz-Lapuente et al. 1992; Mazzali et al. 1995) indicates the existence of an outer shell of . In contrast, Georgii et al. (2002) presented observations of SN 1998bu obtained with COMPTEL. They concluded that their non-detection of rays from the decay chain indicates that there is no appreciable mixing of radioactive nuclides within the ejecta in the context of current models. More recently Stehle et al. (2005) have presented “abundance tomography” of SN 2002bo. With their unique technique they determined that the vast majority of was distributed between 3000 to 11,000 km s-1 for this particular event. Jeffery (1999) showed that for W7, the parameter q was equal to approximately one-third. As W7 has been able to quite successfully fit observed spectra for normal to bright SNe Ia (Harkness 1991; Mazzali et al. 1995; Mazzali 2001), we have adopted a q value of one-third in the calculations presented below.
3.3 -ray escape fraction
By comparing the UVOIR light curve to the enrgy input from the radioactive decays –for both cases of complete trapping of rays and complete escape of rays– we can obtain a quantitative description of the -ray escape fraction. An expression for the UVOIR light curve based on this prescription can be written as
| (5) |
In this expression LC(t)obs is the UVOIR light curve, LC(t)τ≫1 represents the energy input from the radioactive decays assuming complete trapping of rays, LC(t)τ≪1 represents the case of complete escape of rays, and (t) is the -ray escape fraction. Solving Eq. (5) for (t) we obtain the -ray escape fraction
| (6) |
4 Results
In Fig. 1 we present the least squares fits of Eq. (2) to several UVOIR light curves. The four events shown in Fig. 1 are representative of the complete population of SN Ia, ranging from the bright SN 1991T to the subluminous SN 1991bg. Also plotted are the energy deposition curves corresponding to the decay chain for the cases of complete -ray trapping (dash-dotted line) and complete -ray escape (dashed line). Table 1 lists the mass calculated for each event through Eq. (1), as well as the determined values of t∘. For this sample of SNe Ia, the mass varies by a factor of 10, while t∘ varies by a factor of 1.6.
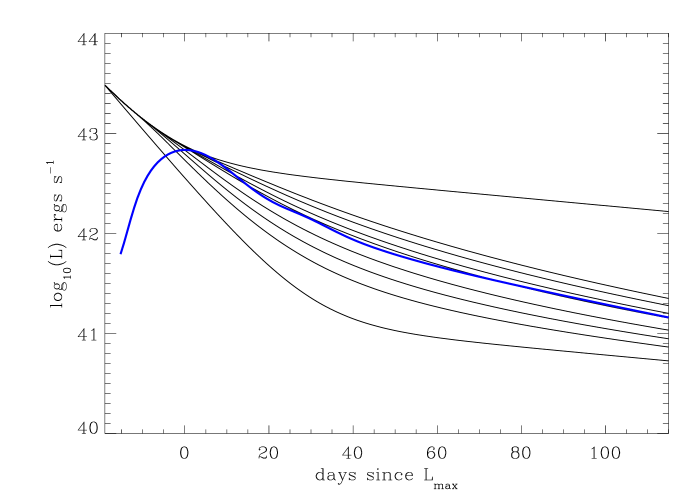
In order to give the reader a more intuitive feeling of how the RDE deposition curve depends on the value of t∘, we present Fig. 2. This figure contains the UVOIR light curve of SN 2003du, along with the energy deposition curves for different values of t∘ that vary, from top to bottom: , 45, 40, 35, 32.16, 25, 20, 15, and 0 days. As expected for a fixed mass, when t∘ is increased, the energy RDE deposition function evolves more slowly with respect to time. Physically this effect is associated with an increase in the diffusion time of the photons trapped within the ejecta.
In Fig. 3 we plot t∘ versus m.222By plotting m rather than the mass, we bypass the effect upon the luminosity (hence mass) associated with the uncertainty in the adopted distance to each event. Values for m have been determined from the UVOIR light curves. From this figure it is clear that there exists a correlation between these two parameters. This correlation is in accord with our expectations, as it is well established that more luminous SNe Ia have smaller decline rates, and thus the epoch in which their ejecta transform to the nebular phase occurs at a later time (see Pinto & Eastman 2001, and references within for a detailed discussion of the physics that describes the luminosity-width relation).
Armed with our values of t∘, we can now proceed to place constraints on the total ejected mass. Fig. 4 is a plot of our calculated ejected mass versus the mass. For the calculation of the ejected mass we have used q , ve 3000 km s-1 and 0.025 cm2 g-1.
The error bars that accompany each mass account for uncertainties in host galaxy reddening and the adopted distance (see Table 1). For events with a CMB distance we have assumed 300 km s-1 uncertainty for (random) peculiar velocities.
The ejected mass error bars include: (1) the uncertainty listed in Table 1 for each value of t∘, (2) a 300 km s-1 i.e. 10% uncertainty in ve, (3) a 10% uncertainty in and (4) a 30% uncertainty in the adopted value of q. These ‘1-’ error bars are not statistical but rather a sensible estimation of the possible range of each parameter.
Fig. 4 displays several striking features that are worthy of comment. First, this figure suggests that there exists a range in the ejected mass of about a factor of two. Three events (SN 1992A, SN 1994D, and SN 2000cx) that have moderate amounts of Mej (i.e. 0.4 - 0.6 M☉) are of particular interest. These events are located nearly 3- below the most massive events, which lie near the canonical value of 1.4 M☉. In order to increase the ejected mass of these three events to a Chandrasekhar mass, it is necessary to reduce either q (which is highly unlikely) or our fiducial value of by a factor of two, or increase either the value of t∘ by a factor of 1.3 or ve by a factor of 1.4 or more. Implementing any of these changes results in ejected masses for all the other ‘normal’ SNe Ia to be comparable to that of a neutron star mass. In other words, if we change any one of the parameters in Eq (4) while keeping all others constant, there will always exist a relative difference in the ejected mass of 2 between these three events shown in Fig. 4, as compared to the more massive SNe Ia. Of course this is the case if the changes are applied uniformly to the whole sample. In reality some events may have different values for the parameters listed in Eq (4) when compared to each other.
The problem can, of course, be inverted to derive mean values of q, , and ve for a fixed ejected mass. With an ejected mass of 1.4 M☉ we find mean values v km s-1, q , and cm2 g-1. If the two subluminous events (i.e. SN 1991bg and SN 1998de) are excluded, these parameters change to v = km s-1, q , and cm2 g-1.
This e-folding velocity may be slightly on the high side compared to what is predicted from successful 1-D explosion models. However, it is not radically different from our adopted e-folding velocity. An explosion model with the majority of the mixed in the outer layers, as implied by a q is most unlikely for the vast majority of robust explosion models. But this could be the case for a Chandrasekhar mass progenitor that produces a subluminous SN Ia. As mentioned before, in the optically thin limit ranges from 0.025 to 0.033 cm2 g-1. A factor of two (or even three) less of 0.025 cm2 g-1 is unlikely. At most one could conceive of to vary by .
To calculate the amount of intermediate mass elements (IMEs) produced during nuclear burning, we simply subtract the ejected mass from the amount of produced. Note this this value also includes any stable Fe group elements and remaining amount of unburned carbon and oxygen. These values are listed in Table 1. Excluding SN 1994D we find that the IMEs range from to .
In Fig. 5 we plot the ejected mass versus t∘, while holding the other parameters of Eq. (4) constant. The solid line (case 1) corresponds to all the fiducial values used to determine the ejected masses in Fig. 4. The dashed line (case 2) shows the effect of keeping q and fixed at the fiducial values while using ve 3625 km s-1. For the dash-dot-dot line (case 3) we used ve 3625 km s-1, 0.0084 cm2 g-1 and q 0.5. Finally the dash-dot line (case 4) corresponds to ve 3625 km s-1, q 1/3, and 0.0084 cm2 g-1. This figure illustrates the strong dependencies of the ejected masses. Masses much above the Chandrasekhar mass are achieved for only extreme cases. Both case 1 and case 2 provide ejected masses at or near the Chandrasekhar mass for events with large values of t∘ and substantially less for those events with values of t∘ 22-26 days.
Another interesting feature displayed in Fig. 4 is that there appears to be little or no correlation between the ejected mass and the amount of . This is not entirely unexpected because as even with the presumption that all SNe Ia originate from a Chandrasekhar-size white dwarf, there still exists a range of ten or more in amount of produced. Nevertheless this is additional evidence which suggests that there is a significant variation in the burning of SNe Ia.
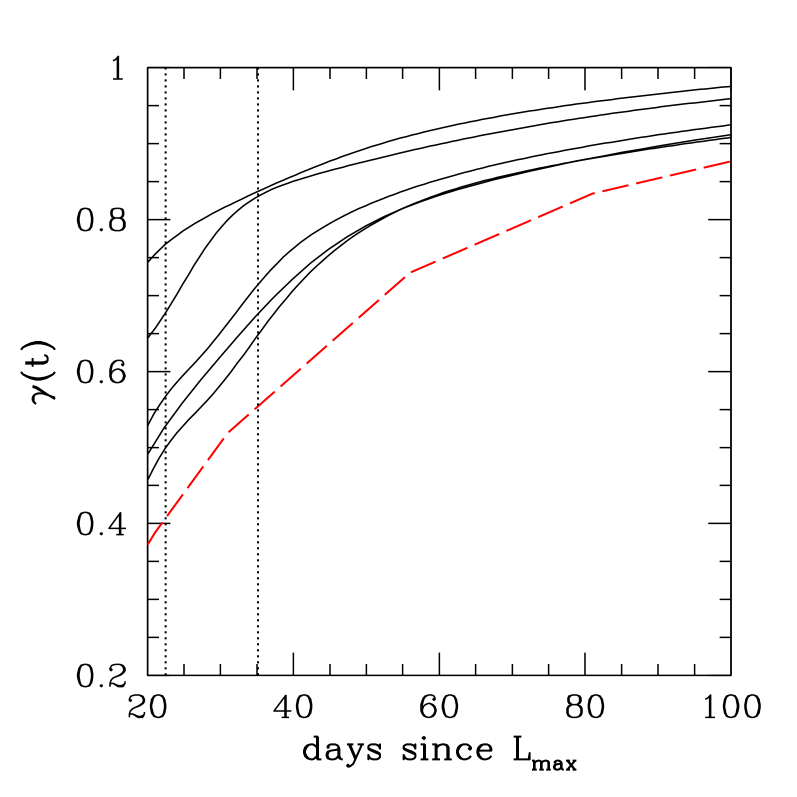
We now turn our attention to the issue of the -ray escape fraction. In Fig. 6 we present the -ray escape fraction as a function of time (determined from Eq. (6)) for five of the SNe Ia in our sample. As the ejecta of the supernova expands there is an increase in the -ray escape fraction. This can be attributed to the decrease in the column density, which is accompanied with the expansion of the ejecta. Most of the curves in this figure are accompanied by a ‘bump’ between 20 and 40 days past maximum light. Also included in Fig. 6 is the -ray escape fraction calculated from W7. The agreement between W7 and our calculated -ray escape fraction curves is encouraging, considering that we are not adjusting any parameters.333Note that we have assumed a rise time to bolometric maximum of 19 days. For the first three weeks after maximum light the -ray escape fraction from the UVOIR light curves is unreliable, as it is based on the assumption of , which clearly is not the case for t t∘.
From Fig. 6 it is clear that the -ray escape fraction evolves faster in time for less luminous events. This is confirmed by Fig. 7 where we plot the -ray escape fraction at sixty days past bolometric maximum light versus m. At this epoch more rays escape in the least luminous SNe Ia than in the brightest events. However, between 20 and 40 days past maximum light the differences are even more pronounced. This is expected, as at these epochs the UVOIR light curve has not yet reached its linear decline. In addition, the morphology of the secondary maximum can vary radically from SN to SN (Suntzeff 2003; Stritzinger 2005). This may then have a significant effect on the evolution of the -ray escape fraction during these phases.
5 Discussion
With the stipulation that the UVOIR light curve reasonably traces the true bolometric flux, from within the period of soon after explosion to one hundred days past maximum light, we have been able to derive constraints on several important global parameters that relate directly to the progenitor systems of SNe Ia. The appeal of our approach is that, with relative ease and simple assumptions, we have used existing data to gain a deeper understanding on the origins of SNe Ia as well as provide sorely needed constraints on current models.
As previously mentioned, it is commonly believed that SNe Ia are the result of the thermonuclear disruption of a C-O white dwarf. The premise that thermonuclear combustion occurs at the Chandrasekhar limit was invoked to address the issue of homogeneity. However, today it is well established that SNe Ia are not true standard candles as once thought in the past (e.g. Leibundgut 2004).444 Recently Krisciunas et al. (2004) have presented evidence that SNe Ia appear to be nearly ‘standard candles’ in the near-infrared. Therefore we now must carefully scrutinize the data at hand in order to find plausible explanations that can account for the radical differences observed between different SNe Ia.
We first showed that the mass (hence luminosity) ranges from to . This confirms results previously attained by several similar and independent methods (Bowers et al. 1997; Cappellaro et al. 1997; Contardo et al. 2000; Strolger et al. 2002; Suntzeff 2003). But this result is quite disheartening from earlier assertions that SNe Ia are standard candles. If all SNe Ia do indeed originate from a Chandrasekhar mass, an immediate question then is: What physical mechanism(s) can explain this range in luminosity?
There has been considerable effort on the part of modelers to address this question. Yet they have been met with little success to identify what parameter(s) can be tuned in order to account for a factor of ten in mass. Obvious candidates that may affect the production of are the initial parameters prior to explosion, e.g. metallicity, central density and ignition mechanism(s). Recently, Röpke & Hillebrandt (2004) have shown that the C-O ratio has essentially no effect on the amount of produced from burning to NSE. If prior to explosion there is a significant amount of alpha elements within the white dwarf, one may reasonably expect the production of more stable isotopes, thus reducing the amount of synthesized (Brachwitz et al. 2000). Moreover it has been shown that changes in the central density of the white dwarf do influence the robustness of the explosion. Nevertheless, it is unrealistic that any one of these parameters, or even a combination of the three, can account for a factor of ten range in the mass. In reality these parameters affect the production of by no more than .
More likely to influence the amount of synthesized is the explosion mechanism itself (see Stritzinger & Leibundgut 2005, and references within for a more detailed discussion). Currently the explosion mechanism and the subsequent evolution of the burning front is in open debate, and varies from a subsonic deflagration to a supersonic delayed detonation. Today the best Chandrasekhar mass models predict masses that range between to M☉. Due to computational limitations the state-of-the-art 3-D deflagration models (Reinecke et al. 2002a, b) do not produce copious amounts of (Travaglio et al. 2004), and have appreciable amounts of unburned carbon and oxygen left over in the inner ashes (Kozma et al. 2005). The delayed detonation models (Khokhlov 1991; Woosley 1990; Woosley & Weaver 1994a; Höflich & Khokhlov 1996), on the other hand, can account for some of the more luminous events, but this class of models requires an additional free parameter. This parameter is essential to force the transition of the flame propagation from a deflagration to a detonation, and is physically not understood (however, see Gamezo et al. 2004 and Golombek & Niemeyer 2005). The fact that there does not exist a single class of Chandrasekhar mass models that can account for the complete population of SNe Ia is quite dissatisfying and should be seriously addressed by theorists, if we are to insist that a Chandrasekhar-size white dwarf accounts for the progenitor system of all SNe Ia.
Under the main assumption that at times greater than fifty days past maximum light the energy deposition in the ejecta of a SN Ia is solely due to the decay chain, and thus the optical depth has a t-2 dependence, we can estimate (from the UVOIR light curve) the epoch when the photosphere transforms from being optically thick to optically thin. With this knowledge we can then use the parameterized SN Ia model of Jeffery (1999) to place constraints on the ejected mass.
The results presented in Fig. 4 provide us with evidence that not all SNe Ia originate from a Chandrasekhar-size white dwarf or other very severe differences in the explosions like the distribution of or kinetic energies (expansion velocities) exist. This would then immediately imply that some sort of sub-Chandrasekhar mass model is responsible for at least some SNe Ia. If true, this would be a radical change in thinking from the currently favored paradigm for the progenitor systems of SNe Ia. However, the suggestion that a sub-Chandrasekhar mass model may be a viable candidate for the progenitors of some SNe Ia is certainly not a new concept. Similar to Chandrasekhar mass models, previous attempts to simulate these systems have been plagued with their own problems. We refer the reader to Hillebrandt & Niemeyer (2000) and Livio (2000) for detailed reviews concerning this class of progenitor system; we briefly summarize them here.
Previous attempts to model sub-Chandrasekhar explosions (Woosley & Weaver 1994b; Livne & Arnett 1995; Höflich & Khokhlov 1996) have met with some success in reproducing the observed light curves. However, these models typically predict a high-velocity layer of and helium above the IMEs, which is not observed in any spectra. It must be noted that relatively little effort has been made to conduct detailed 3-D simulations of sub-Chandrasekhar mass models (but, see Garcia-Senz et al. 1999; Benz 1997). With more detailed modeling, this progenitor channel may provide an attractive alternative to the Chandrasekhar mass model. We also note that one appealing advantage offered by this model is the ability to obtain the progenitor statistics predicted by population synthesis calculations (see Livio 2000, and references within).
Previously, Cappellaro et al. (1997) employed a technique that used observations of SNe Ia to determine both the mass and the ejected mass. In their method they modeled the -band light curves of a small sample of SNe Ia using a simple Monte Carlo code. We find that our overall results are analogous to what they determined for both the range in the mass and the ejected mass. Contrary to their work we employed a different manner to determine these parameters and used UVOIR light curves rather than V-band light curves. By using the UVOIR light curve instead of the -band light curve, we circumvented the crude assumption that the latter is a close surrogate to the former during post maximum times. Indeed, a comparison between our UVOIR light curves to the -band light curves indicates that by fifty days past maximum light, the bolometric correction (mbol- mv) is mag or more. At later times this difference is amplified, as the near infrared passbands provide an increasing contribution to the bolometric flux (Sollerman et al. 2004).
Although we find that our conclusions are in line with to those presented in Cappellaro et al., there are subtle differences between the four events that coincide in both studies. The numbers we provide below for our results were obtained using Eq. (4) and the fiducial values quoted previously. Also, note that there are slight differences (no larger than ) in the distances used between our work and that of Cappellaro et al.
For SN 1991bg, Cappellaro et al. found a mass MNi M☉ and an ejected mass Mej M☉. This is quite comparable to our findings of M M☉ and M M☉. Furthermore, our MNi/Mej ratio of is larger compared to their . We found for SN 1992A, M M☉ and MM☉, as compared to their M M☉ and M M☉. This then gives us a MNi/Mej ratio of compared to their .
We find that our results with respect to the next two SNe Ia differ more than the first two stated events. For SN 1994D we calculated M M☉ and M M☉, compared to their values of M M☉ and M M☉. Thus we obtain a larger difference in our MNi/Mej ratio of 0.98 compared to their 0.57. The fact that we have calculated a mass that is equal to the ejected mass is questionable. To determine the mass of SN 19994D we used a new SBF distance (Ajhar et al. 2001) rather than the SBF distance (Tonry et al. 1997) used by Contardo et al. (2000) who determined a mass of 0.40 M☉. Using the distance modulus adopted by Cappellaro et al. we obtain a mass of 0.67 M. Recently Feldmeier, Jacoby & Phillips (2005) have calculated a planetary nebulae distance to the host galaxy of SN 1994D. In their study they have determined the distance modulus . This is comparable to the Tonry et al. (1997) distances modulus . Using the planetary nebulae distance the mass would be reduced to . Nonetheless the mass determined by us and Contardo et al. is less than the 0.8 M☉ calculated by Cappellaro et al. with their method. The discrepancies between these values of the mass underscores the effect of the uncertainty in the distances.
Finally, for SN 1991T Cappellaro et al. assumed Mej MNi where MNi 1.1 M☉. We, on the other hand, found M M☉ and Mej M☉. In summary we find the results presented by Cappellaro et al. to be in fair agreement with our calculations, although some discrepancies do exist.
We have presented an investigation of the bolometric behavior of sixteen SNe Ia. In particular we have provided important constraints on the progenitor system(s) of these stellar explosions. Our results suggest that some progenitor system(s) of SN Ia may emanate from the thermonuclear explosion of a sub Chandrasekhar-size white dwarf. This result may be difficult to reconcile with the current paradigm of the progenitor system of SNe Ia, i.e. a Chandrasekhar-size white dwarf. Moreover, our results suggest that the amount of produced during the explosion is most likely not dependent on the mass of the progenitor, but more likely on the manner in which nuclear burning is initiated and the subsequent dynamics of the flame propagation through the white dwarf. The range in synthesized possibly indicates that there are two different explosion mechanisms. Further modeling of the explosion mechanism is required in order to investigate how different initial conditions can affect the observed range in luminosity.
In Fig. 4 we see –in contrast to current thinking– that the mean ejected mass of many explosions is on the low side. A valid concern is that the parameters used to determine the ejected masses may not exactly represent those of a real SN Ia explosion. One parameter that could be in error, and does have a significant effect on our estimates of the ejected masses, is the adopted value of the e-folding velocity (see Fig 5). If we assume slightly larger values of ve, the mean ejected mass for our sample would be in better agreement with 1.4 M. How this parameter differs in 3-D simulations compared to 1-D simulations is not yet clear.
In addition, the simple assumption that any one of the parameters in Eq. (4) is unique for all events is probably incorrect. This may have a significant effect on the determined ejected mass for each event. However, this does not necessary imply that we would obtain larger ejected masses. It would be helpful if the theorists in the future provided values of ve and q from their simulations.
An acceptable argument concerning the results presented in this work is the validity of the model used to determine the ejected mass. There may be several assumptions built into the parameterized model of Jeffery (1999) which may be too naïve, and therefore the model may not adequately account for various complicated physical processes that occur within the progenitor of a SN Ia. However, there currently exists no other method to use observed photometry to place constraints on such a parameter.
In principle we would like to compare the UVOIR light curves to detailed NLTE modeled light curves. Unfortunately there has been little success in such an endeavor, owing to the complications in performing such time-dependent calculations as well as the limits of atomic line data, however see Kozma et al. (2005). The next step will be to fit UVOIR light curves to a grid of model light curves produced from 3-D radiative transfer calculations, and then place further constraints on the progenitor systems of SNe Ia.
Acknowledgements.
M.S. acknowledges the International Max-Planck Research School on Astrophysics for a graduate fellowship. M.S. is grateful for helpful discussions with Sergei Blinnikov, Wolfgang Hillebrandt, Gert Hütsi, Paolo Mazzali, Brian Schmidt, and the SNe Ia group at the MPA. This research has made use of the NASA/IPAC Extragalactic Database (NED), which is operated by the Jet Propulsion Laboratory, California Institute of Technology, under contract with the National Aeronautics and Space Administration.References
- Ajhar et al. (2001) Ajhar, E. A., et al. 2001, ApJ, 559, 584
- Arnett (1982) Arnett, W. D. 1982, ApJ, 253, 785
- Arnett et al. (1985) Arnett, W. D., Branch, D., & Wheeler, J. C. 1985, Nature, 314, 337
- Benz (1997) Benz, W. 1997, in: Thermonuclear Supernovae, Ruiz-Lapuente P., Canal R., Isern J. ed. Kluwer, Dordrecht, 457
- Bowers et al. (1997) Bowers, E.J.C., Meikle, W.P.S., Geballe, T.R., et al., MNRAS, 290, 663
- Brachwitz et al. (2000) Brachwitz, F., Dean, D.J., Hix, W.R., et al. 2000, ApJ, 536, 934
- Candia et al. (2003) Candia, P., et al. 2003, PASP, 115, 277
- Cappellaro et al. (1997) Cappellaro, E., Mazzali, P.A., Benetti, S., et al. 1997, A&A, 329, 203
- Colgate & McKee (1969) Colgate, S. A., & McKee, C. 1969, ApJ, 157, 623
- Colgate et al. (1980a) Colgate, S. A., Petschek, A. G., & Kriese., J. T. 1980a, in AIP Conference Proceedings, No. 63: Supernova Spectra, ed. R. Meyerott & G. H. Gillespie (New York: American Institute of Physics), 7
- Colgate et al. (1980b) Colgate, S. A., Petschek, A. G., & Kriese., J. T. 1980b, ApJ, 237L, 81
- Contardo (2001) Contardo, G. 2001, Technische Universität München Dissertation
- Contardo et al. (2000) Contardo, G., Leibundgut, B., & Vacca, W. D. 2000, A&A, 359, 876
- Filippenko et al. (1992) Filippenko, A. V., et al. 1992, AJ, 104, 1543
- Feldmeier, Jacoby & Phillips (2005) Feldmeier, J., Jacoby, G., & Phillips, M. M. 2005, in preparation
- Ferrarese et al. (2000) Ferrarese, L., et al. 2000, ApJ, 529, 745
- Garcia-Senz et al. (1999) Garcia-Senz, D., Bravo, E., Woosley, S W 1999, A&A, 349, 177
- Georgii et al. (2002) Georgii, R., et al. 2002, A&A, 394, 517
- Gamezo et al. (2004) Gamezo, V. N., Khokhlov, A. M., & Oran, E. S. 2004, Physical Review Letters, 92, 211102
- Gibson et al. (2000) Gibson, B. K., et al. 2000, ApJ, 529, 723
- Golombek & Niemeyer (2005) Golombek, I., Niemeyer, J. C. 2005, A&A, 438, 611
- Hamuy et al. (2003) Hamuy, M., Phillips M. M., Suntzeff, N. B., et al. 2003, Nature, 424, 651
- Harkness (1991) Harkness, R., in: Proceedings of the ESO/EPIC Workshop on SN 1987A and other Supernovae, ed. I.J. Danziger & K. Kjär (ESO, München, 1991), 447
- Hillebrandt & Niemeyer (2000) Hillebrandt, W., & Niemeyer, J. C. 2000, ARA&A, 38, 191
- Höflich (1995) Höflich, P. 1995, ApJ, 443, 89
- Höflich & Khokhlov (1996) Höflich, P., Khokhlov A. 1996, ApJ, 457, 500
- Iben & Tutukov (1984) Iben, I. J., Tutukov, A. V. 1984, ApJS, 54, 335
- Jeffery (1999) Jeffery, D. J. 1999, astro-ph/9907015
- Jeffery et al. (1992) Jeffery, D. J., et al. 1992, ApJ, 397, 304
- Jha (2002) Jha, S. 2002, Harvard University Dissertation
- Khokhlov (1991) Khokhlov, A. M. 1991, A&A, 245, 114
- Kotak et al. (2004) Kotak, R., et al. 2004, MNRAS, 354, 13
- Kozma et al. (2005) Kozma, C., et al. 2005, A&A, 437, 983
- Krisciunas et al. (2003) Krisciunas, K., et al. 2003, AJ, 125, 166
- Krisciunas et al. (2004) Krisciunas, K., Phillips, M., & Suntzeff, N. B. 2004, ApJ, 602L, 81
- Li et al. (2001) Li, W., et al. 2001, PASP, 113, 1178
- Lira et al. (1998) Lira, P., et al. 1998, AJ, 115, 234
- Leibundgut (2000) Leibundgut, B. 2000, A&A Rev., 10, 179
- Leibundgut (2001) Leibundgut, B. 2001, A&A Rev., 39, 67
- Leibundgut (2004) Leibundgut, B. 2004, Ap&SS, 290, 29
- Leibundgut et al. (1993) Leibundgut, B., et al. 1993, AJ, 105, 301
- Livio (2000) Livio, M. 2000, in: Type Ia Supernovae, Theory and Cosmology, ed. J.C. Niemeyer & J. W. Truran, Cambridge University Press, 33
- Livne & Arnett (1995) Livne, E., & Arnett, D. 1995, ApJ, 452, 62
- Madore & Freedman (1991) Madore, B. F., & Freedman, W. 1991, PASP, 103, 933
- Madore et al. (1999) Madore, B. F., et al. 1999, ApJ, 515, 29
- Mazzali et al. (1995) Mazzali, P. A., Danziger, I. J., Turatto, M. 1995, A&A, 297, 509
- Mazzali (2001) Mazzali, P. A. 2001, MNRAS, 321, 341
- Meikle et al. (1996) Meikle, W. P. S., Cumming R. J., Geballe T. R., et al. 1996, MNRAS, 281, 263
- Modjaz et al. (2001) Modjaz, M., et al. 2001, PASP, 113, 308
- Milne, The, & Leising (1999) Milne, P. A., The, L.-S., & Leising, M. D. 1999, ApJS, 124, 503
- Milne, The, & Leising (2001) Milne, P. A., The, L.-S., & Leising, M. D. 2001, ApJ, 559, 1019
- Nadyozhin (1994) Nadyozhin, D. K. 1994, ApJS, 92, 527
- Nobili et al. (2005) Nobili, S., et al. 2005, A&A, 437, 789
- Nomoto (1980) Nomoto, K. 1980, Space Sci. Review, 27, 563
- Nomoto (1982) Nomoto, K. 1982, ApJ, 253, 798
- Nomoto, Thielemann, & Yokoi (1984) Nomoto, K., Thielemann, F.-K., & Yokoi, K. 1984, ApJS, 286, 644
- Nomoto et al. (2004) Nomoto, K., Tomoharu, S., Deng, J., Uenishi, T., Hachisu, I., Mazzali, P. 2004, in: Frontier in Astroparticle Physics and Cosmology, ed. K. Sato & S. Nagataki, Tokyo:Universal Academy Press, 323
- Pankey (1962) Pankey, T. 1962, Howard University Dissertation
- Parodi et al. (2000) Parodi, B., Saha, A., Sandage, A., Tammann, A.G. 2000, ApJ, 540, 634
- Perlmutter et al. (1997) Perlmutter, S., et al. 1997, ApJ, 483, 565
- Perlmutter et al. (1999) Perlmutter, S., et al. 1999, ApJ, 517, 565
- Phillips (2003) Phillips, M M. (private communication)
- Phillips et al. (1999) Phillips, M. M. 2003, in: From Twilight to Highlight, The Physics of Supernovae, ed. W. Hillebrandt & B. Leibundgut, Heidelberg:Springer, 193
- Pinto & Eastman (2001) Pinto, P. A., & Eastman, R. G. 2001, New Astronomy, 6, 307
- Reinecke et al. (2002a) Reinecke, M., Hillebrandt, W., & Niemeyer, J. C. 2002a, A&A, 386, 936
- Reinecke et al. (2002b) Reinecke, M., Hillebrandt, W., & Niemeyer, J. C. 2002b, A&A, 391, 1167
- Richmond et al. (1995) Richmond, M. W., Treffers, R. R., Filippenko, A. V., et al. 1995, AJ, 109, 2121
- Riess et al. (1996) Riess, A. G., Press, W. H., & Kirshner, R. P. 1996, ApJ, 473, 88
- Riess et al. (1998a) Riess, A. G., et al. 1998a, AJ, 116, 1009
- Riess et al. (1999a) Riess, A. G., Kirshner, R. P., Schmidt, B. P., et al. 1999a, AJ, 117, 707
- Riess et al. (2005) Riess, A. G., et al. 2005, ApJ, 627, 579
- Röpke & Hillebrandt (2004) Röpke, F., Hillebrandt, W. 2004, A&A, 420L, 1
- Röpke & Hillebrandt (2004) Röpke, F., Hillebrandt, W. 2005, A&A, 431, 635
- Ruiz-Lapuente et al. (1992) Ruiz-Lapuente, P., et al. 1992, ApJ, 387L, 33
- Saha et al. (1999) Saha, A., et al. 1999, ApJ, 522, 802S
- Saha et al. (2001a) Saha, A., et al. 2001, ApJ, 551, 973S
- Saha et al. (2001b) Saha, A., et al. 2001, ApJ, 562, 314
- Salvo et al. (2001) Salvo, M. E., et al. 2001, MNRAS, 321, 254
- Swartz et al. (1995) Swartz, D. A., Sutherland, P. G., & Harkness, R. P. 1995, ApJ, 446, 766
- Schlegel et al. (1998) Schlegel, D. J., Finkbeiner, D. P., & Davis, M. 1998, ApJ, 500, 525
- Sadakane (1996) Sadakane, K., et al. 1996, PASJ, 48, 51
- Smith et al. (2000) Smith, C., et al. (private communication)
- Sollerman et al. (2004) Sollerman, J., et al. 2004, A&A, 428, 555
- Stanishev et al. (2005) Stanishev, V., et al. 2005, in preparation
- Stehle et al. (2005) Stehle, M., et al. 2005, MNRAS, 357, 200
- Stetson et al. (2001) Stetson, P. B., & Gibson, B. K. 2001, MNRAS, 328, L1
- Strolger et al. (2002) Strolger, L. G., et al. 2002, AJ, 124, 2905
- Stritzinger (2005) Stritzinger, M. D. 2005, Technische Universität München Dissertation
- Stritzinger & Leibundgut (2005) Stritzinger, M. D., & Leibundgut, B. 2005, A&A, 431, 423
- Suntzeff (1996) Suntzeff, N. B. 1996, in: IAU Colloquium 145, Supernovae and Supernova Remnants, ed. R. McCray, & Z. Wang, Cambridge University Press, Cambridge, 41
- Suntzeff (2003) Suntzeff, N. B. 2003, in: From Twilight to Highlight, The Physics of Supernovae, ed. W. Hillebrandt & B. Leibundgut, Heidelberg:Springer, 183
- Sutherland & Wheeler (1984) Sutherland, P. G., Wheeler, C. 1984, ApJ, 280, 282
- Tammann & Reindl (2002) Tammann, G. A., & Reindl, B. 2002, Ap&SS, 280, 165
- Thim et al. (2003) Thim, F., et al. 2003, ApJ, 590, 256
- Travaglio et al. (2004) Travaglio, C., et al. 2004, A&A, 425, 1029
- Tonry et al. (1997) Tonry, L. L., et al. 1997, ApJ, 475, 399
- Tonry et al. (2001) Tonry, J. L., et al. 2001, ApJ, 546, 681
- Turatto et al. (1996) Turatto, M., et al. 1996, MNRAS, 283, 1
- Udalski et al. (1999) Udalski, A., et al. 1999, Acta Astron., 49, 223
- Vacca & Leibundgut (1996) Vacca, W. D., & Leibundgut, B. 1996, ApJ, 471, L37
- Vacca & Leibundgut (1997) Vacca, W. D., & Leibundgut B. 1997, in: Thermonuclear Supernovae, Ruiz-Lapuente P., Canal R., Isern J. ed. Kluwer, Dordrecht, 65
- Wells et. (1994) Wells, L., et al. 1994, AJ, 108, 2233
- Weaver & Woosley (1980) Weaver, T. A., Woosley, S. W. 1980, in: AIP Conf. Proc. 63. Supernovae Spectra. La Jolla, Ca, 15
- Woosley (1990) Woosley, S. W. 1990, in: Supernovae, eds, A. Petschek, Berlin:Springer-Verlag, 182
- Woosley (1991) Woosley, S. W. 1991, in: Gamma-Ray Line Astrophysics, ed. P. Durouchoux & N. Prantzos (Paris:AIP), 270
- Woosley et al. (1980) Woosley, S. W., Weaver, T. A., Taam., R E. 1980, in: Texas Workshop Type Ia Supernovae, ed. C Wheeler, Austin, TX: Univ. Texas, 96
- Woosley & Weaver (1986) Woosley, S. W., Weaver, T. A. 1986, ARA&A, 24, 205
- Woosley & Weaver (1994a) Woosley, S. W., Weaver, T. A. 1994, in: Supernovae, Les Houches Session LIV, eds, J. Audouze, S. Bludman, R. Mochovitch, J. Zinn-Justion, Amsterdam:Elsevier, 63
- Woosley & Weaver (1994b) Woosley, S. W., Weaver, T. A. 1994, ApJ, 423, 371
| SN | Filters | Ref. | E(B-V) | E(B-V)host | vel | Ref.b | MNi | t0 | Mej | MIME | |
|---|---|---|---|---|---|---|---|---|---|---|---|
| (km s-1) | (M☉) | (days) | (M☉) | (M☉) | |||||||
| SN1989B | 1 | 0.032 | 0.340(0.04) | 30.22(0.12) | 797 | 21 | 0.64(0.18) | 32.23(0.12) | 1.06(0.32) | 0.42 | |
| SN1991T | 2 | 0.022 | 0.140(0.05) | 30.74(0.12) | 1012 | 22 | 0.93(0.30) | 34.44(0.23) | 1.21(0.36) | 0.28 | |
| SN1991bg | 3, 4, 5 | 0.040 | 0.030(0.05) | 31.32(0.11) | 1322 | 23 | 0.11(0.03) | 21.62(0.11) | 0.48(0.14) | 0.37 | |
| SN1992A | 6 | 0.017 | 0.000(0.02) | 31.35(0.07) | 1341 | 24 | 0.40(0.03) | 26.58(0.10) | 0.72(0.22) | 0.32 | |
| SN1994D | 7, 8, 9 | 0.022 | 0.000(0.02) | 31.08(0.20) | 1184 | 25 | 0.64(0.13) | 25.31(0.11) | 0.65(0.20) | 0.01 | |
| SN1994ae | 10 | 0.031 | 0.120(0.03) | 32.29(0.06) | 2067 | 13 | 0.84(0.13) | 32.33(0.13) | 1.07(0.32) | 0.23 | |
| SN1995D | 10, 11 | 0.058 | 0.040(0.02) | 32.50(0.26) | 2272 | CMB | 0.66(0.23) | 35.15(0.12) | 1.26(0.38) | 0.60 | |
| SN1995E | 10 | 0.027 | 0.740(0.03) | 33.42(0.18) | 3478 | CMB | 0.88(0.26) | 31.49(0.11) | 1.01(0.30) | 0.13 | |
| SN1996X | 10, 12 | 0.069 | 0.010(0.02) | 32.40(0.20) | 2174 | 12 | 0.73(0.21) | 28.70(0.10) | 0.84(0.25) | 0.11 | |
| SN1998aq | 13 | 0.014 | 0.002(0.05) | 31.66(0.09) | 1547 | 13 | 0.68(0.18) | 28.88(0.17) | 0.85(0.25) | 0.17 | |
| SN1998de | 14 | 0.060 | 0.000(0.05) | 34.05(0.14) | 4653 | CMB | 0.09(0.03) | 27.80(0.10) | 0.68(0.20) | 0.59 | |
| SN1999ac | 15 | 0.046 | 0.120(0.05) | 33.06(0.21) | 2949 | CMB | 0.67(0.29) | 33.24(0.11) | 1.13(0.34) | 0.46 | |
| SN1999dq | 16 | 0.024 | 0.139(0.05) | 33.74(0.16) | 4029 | CMB | 0.80(0.29) | 34.91(0.14) | 1.24(0.37) | 0.44 | |
| SN2000cx | 16, 17, 18 | 0.082 | 0.000(0.05) | 31.90(0.20) | 1727 | 23 | 0.38(0.16) | 25.40(0.09) | 0.66(0.20) | 0.28 | |
| SN2001el | 19 | 0.014 | 0.206(0.05) | 30.83(0.54) | 1053 | CMB | 0.40(0.38) | 31.94(0.12) | 1.04(0.31) | 0.64 | |
| SN2003du | 20 | 0.010 | 0.000(0.05) | 32.23(0.30) | 2011 | CMB | 0.38(0.21) | 32.16(0.13) | 1.05(0.32) | 0.67 |
References. — (1) Wells et. (1994), (2) - Lira et al. (1998), (3) - Filippenko et al. (1992), (4) - Leibundgut et al. (1993), (5) - Turatto et al. (1996), (6) - Suntzeff (1996), (7) - Richmond et al. (1995), (8) - Meikle et al. (1996), (9) - Smith et al. (2000), (10) - Riess et al. (1999a), (11) - Sadakane (1996), (12) - Salvo et al. (2001), (13) - Riess et al. (2005), (14) - Modjaz et al. (2001), (15) - Phillips (2003), (16) - Jha (2002), (17) - Li et al. (2001), (18) - Candia et al. (2003), (19) - Krisciunas et al. (2003), (20) - Stanishev et al. (2005), (21) - Saha et al. (1999), (22) - Saha et al. (2001a), (23) - Tonry et al. (2001), (24) - Madore et al. (1999), (25) - Ajhar et al. (2001).


Solid horizontal line indicates the Chandrasekhar mass. Slanted line has a slope of 1.