11email: L.Hadfield@sheffield.ac.uk 22institutetext: Institut für Astronomie, ETH-Zentrum, CH 8092 Zürich, Switzerland 33institutetext: Physikalisch-Meteorologisches Observatorium, CH-7260 Davos, Switzerland
A Spectroscopic Search for the non-nuclear Wolf-Rayet Population of the metal-rich spiral galaxy M 83 ††thanks: Based on observations made with ESO Telescopes at the Paranal Observatory under programme ID 69.B-0125
We present a catalogue of non-nuclear regions containing Wolf-Rayet stars in the metal-rich spiral galaxy M 83 (NGC 5236). From a total of 283 candidate regions identified using He ii 4686 imaging with VLT-FORS2, Multi Object Spectroscopy of 198 regions was carried out, confirming 132 WR sources. From this sub-sample, an exceptional content of 1035300 WR stars is inferred, with N(WC)/N(WN)1.2, continuing the trend to larger values at higher metallicity amongst Local Group galaxies, and greatly exceeding current evolutionary predictions at high metallicity. Late-type stars dominate the WC population of M 83, with N(WC8–9)/N(WC4–7)=9 and WO subtypes absent, consistent with metallicity dependent WC winds. Equal numbers of late to early WN stars are observed, again in contrast to current evolutionary predictions. Several sources contain large numbers of WR stars. In particular, #74 (alias region 35 from de Vaucouleurs et al.) contains 230 WR stars, and is identified as a Super Star Cluster from inspection of archival HST/ACS images. Omitting this starburst cluster would result in revised statistics of N(WC)/N(WN)1 and N(WC8–9)/N(WC4–7)6 for the ‘quiescent’ disk population. Including recent results for the nucleus and accounting for incompleteness in our spectroscopic sample, we suspect the total WR population of M 83 may exceed 3000 stars.
Key Words.:
galaxies: individual: M 83 – stars: Wolf-Rayet1 Introduction
Massive stars play a major role in the ecology of galaxies via radiative, mechanical and chemical feedback (Smith, 2005). Wolf-Rayet (WR) stars in particular, albeit rare and short-lived, make a significant contribution to their environment via the mechanical return of nuclear processed material to the interstellar medium (ISM) through their exceptionally powerful stellar winds.
Metallicity, , is a key factor in determining the number and subtype distribution of a WR population. Although the metallicity dependence of WR wind properties still remains unclear, mass-loss prior to this phase has been established to depend on metallicity, with the latest models predicting Ṁ for O stars (Vink et al., 2001). Evolutionary models for single stars predict that the minimum mass cut-off required for WR formation should decrease as metal content increases. It is anticipated that the minimum mass required for progression to the WR phase decreases from for a SMC-like metallicity to for super-Solar metallicity (Meynet & Maeder, 2004). Single star predictions are broadly consistent with the initial masses of WR stars in the Milky Way, LMC and SMC inferred from cluster membership (Massey et al., 2000, 2001). The fractional distribution of carbon-rich (WC) to nitrogen-rich (WN) stars is also known to increase with metallicity, such that empirically one would expect to observe a large WC population in a metal-rich environment (Massey & Johnson, 1998). The formation of WR stars at low metallicity is anticipated primarily via close binary Roche Lobe Overflow (RLOF), yet the observed WR binary fraction in the SMC does not differ from that of the Milky Way (Foellmi et al., 2003).
With the aim of substantiating such predictions, surveys of WR stars in Local Group galaxies (typically 0.2–1Z⊙) have been carried over the last two decades. At sub-Solar metallicities, the LMC and SMC have been well sampled (Breysacher et al., 1999; Massey et al., 2003), as has M 33 (Massey & Johnson, 1998; Abbott et al., 2004). In contrast, M 31 is the only Local Group member with super-Solar metallicity, but its unfavourable inclination and large spatial extent makes surveying the complete WR population very challenging. In order to increase the variety of galaxies sampled, our group has begun to look beyond the Local Group (e.g. NGC300, Schild et al., 2003).
Galaxies hosting substantive WR populations are known as ‘WR galaxies’ (Kunth & Sargent, 1981; Schaerer et al., 1999b), where the number of WR stars ranges from 35 in NGC1569-A (Gonzalez Delgado et al., 1997) to 2 in Mrk 309 (Schaerer et al., 2000). Within specifically metal-rich environments, previous studies of WR populations have generally been restricted to integrated spectra from bright star forming knots (e.g. Schaerer et al., 1999a) or H ii regions (e.g. Pindao et al., 2002). Here we present the results of a deep imaging and spectroscopic survey of the disk WR population within the metal-rich galaxy M 83, in which WR signatures have previously been identified by Rosa & Richter (1988) and Bresolin & Kennicutt (2002).
M 83 (NGC 5236) is a massive, grand-design southern spiral (SBc(s) II) with on-going star formation in its spiral arms plus an active nuclear starburst (Elmegreen et al., 1998; Harris et al., 2001). M 83 is the principal member of a small galaxy group ( members) within the Centaurus A complex (Karachentsev et al., 2002). Located at a distance of 4.50.3Mpc (Thim et al., 2003), its favourable inclination and apparently high metal abundance of log(O/H)+12=9.2 (Bresolin & Kennicutt, 2002) makes M 83 an ideal candidate for studies of massive stellar populations at high metallicity.
More recently, oxygen abundances in metal-rich galaxies have been revised downward (Pilyugin et al., 2004; Bresolin et al., 2004), such that M 83 may have a metal abundance closer to log(O/H)+12=9.0 (Bresolin, 2004, priv. comm.), i.e. approximately twice the Solar oxygen abundance of log(O/H)+12=8.66 recently derived by Asplund et al. (2004).
We present the results of an imaging and spectroscopic survey of the WR content of M 83 using the ESO Very Large Telescope (VLT). The present paper complements the initial findings of this study reported in Crowther et al. (2004, hereafter Paper I). In Sect. 2 we briefly describe the observations and data reduction techniques employed. Section 3 discusses the method followed to obtain a global WR population of M 83. Sect. 4 discusses the properties of metal rich WR stars with those of Local Group galaxies and evolutionary models. Finally, conclusions are drawn in Sect. 5.
2 Observations and data reduction
We have observed M 83 with the ESO Very Large Telescope UT4 (Yepun) and Focal Reduced/Low Dispersion Spectrograph #2 (FORS2). The detector consists of a mosaic of two MIT/LL CCDs which in conjunction with the standard collimator provides a field-of-view and an image scale of 0.126′′/pixel. Photometric observations of M 83 were made between May–June 2002 with follow-up spectroscopic data being acquired during April–June 2003.
2.1 Imaging
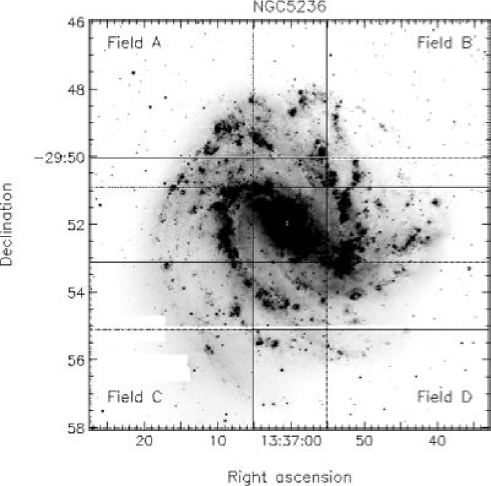
M 83 subtends 12.9′ by 11.5′ on the sky, preventing it being imaged by a single FORS2 frame. In order to obtain complete coverage, the galaxy was divided into four overlapping regions, covering the NE (Field A), NW (B), SE (C) and SW (D) as indicated in Fig. 1. Occulting bars were positioned in Field C to prevent detector saturation by bright foreground stars. The central 15′′ appears saturated on all images obtained, and as a result the WR population of the nucleus can not be discussed further.
FORS2 was used on 2 June 2002 to obtain narrow-band images with central wavelengths 4684Å, 4781Å and band widths of 66Å and 68Å respectively. These were obtained consecutively for each Field in seeing conditions between 0.6 – 0.8′′1110.8′′ corresponds to a linear scale of 18pc at the distance of M 83 (Thim et al., 2003) with individual exposures of 1800s. The 4684 filter is coincident with the strong WR emission features which incorporates the N iii (Å), C iii (Å) and He ii (Å) emission lines, whereas the latter samples a wavelength region relatively free from emission, providing a measure of the continuum level. In addition to these, 2 exposures (60s and 600s) were taken using narrow-band on- and off- filters ) on 16 May 2002. Finally, in order to supplement the primary dataset, 2 exposures (60s and 120s) were also acquired using a Bessell B filter on 21 May 2002.
2.2 Photometry
Images were prepared following standard procedures i.e. debiased, flat field corrected and cosmic ray cleaned. Photometry of individual sources within M 83 was performed using the package daophot, a point-spread function (PSF) fitting routine within iraf. Absolute photometry in the broad-band B filter was achieved with the aid of photometric standard fields Ru 152 and PG 1528+062 (containing a total of 10 photometric standards, 11.9 B 16.3). For the narrow-band images such standards are not available and photometric zero-points have been obtained by observing spectrophotometric standards LTT7987 (B = 12.2) and G138-31 (B = 16.5).
The majority of our sources appear point-like on the ground-based images. However, a number of bright sources are surrounded by a faint, extended halo, which was not accounted for in the PSF photometry and as a result only a lower limit to the magnitude is given, based on PSF photometry. A further subset of the bright sources are spatially extended, indicating that PSF photometry is inappropriate, as indicated in Table A1 in the appendix.
Typical formal photometric errors range between 0.02 mag (18 mag), 0.05 mag (20 mag) and 0.08 mag (22 mag). Significantly higher errors, of up to 0.15 mag, are obtained for regions of the galaxy where the background levels are high, or they are located in spatially crowded regions.
As a consistency check we have compared results obtained for the two Bessell B exposures (for which the PSF model was based on different template stars) and also derived magnitudes for objects which appear in multiple fields. Excellent agreement was observed in both cases, with results agreeing to within the formal errors. In a minority of cases this was not achieved due to severe crowding.
2.3 Candidate Selection
WR candidates were identified by searching for He ii / C iii excess emission (at 4684) relative to the continuum (4781), i.e. a negative value of = - . The optimal method of identifying suitable candidates was found to be via ‘blinking’ individual 4781 and 4684 frames together with the difference image obtained by subtracting the 4781 image from the 4684 frame. In total, 283 candidate 4684 emission sources were identified.
For 75% of our candidates we have obtained a magnitude in at least the 4684 filter. For cases where we did not obtain photometry, the object was either too faint or was located in a spatially crowded region. In addition, for a significant fraction of the fainter sources it was not possible to measure a 4871 magnitude.
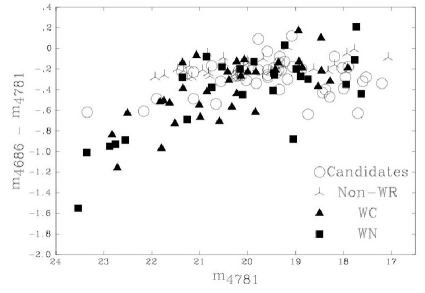
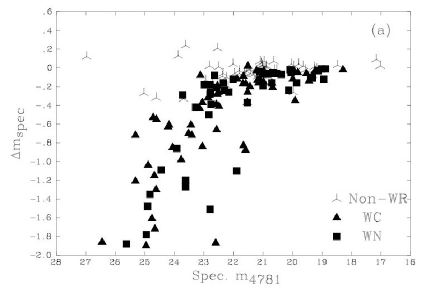
Candidates were grouped according to continuum brightness, , and association with underlying H ii regions. To ensure we spectroscopically observed a representative sample, a selection from each group was chosen for spectroscopic follow up. In Fig. 2 we show as a function of continuum magnitude for the sources in which WR signatures were either spectroscopically confirmed, rejected or no spectroscopy was obtained, i.e. the remaining candidates. The majority of confirmed sources have a 4684 excess between –1.5 –0.4 mag, although a few do exhibit rather smaller values of . In contrast, all rejected regions have –0.2 mag, suggesting that remaining candidates which display a moderate 4684 excess should represent regions that genuinely host WR stars, together with a subset of those for with 0.0 mag.
2.4 Spectroscopy
Spectroscopic data was obtained using FORS2 with the Multi Object Spectroscopy (MOS) mode. MOS datasets of individual WR candidates were obtained during seeing conditions of 0.5–1.0′′, using a slit width of . The CCD was binned by a factor of 2 in the dispersion direction, resulting in a dispersion of 3.3Å pixel-1 with the 300V grism and a spectral resolution of Å, as measured from comparison arc lines. The wavelength range of individual targets depended on their position within the MOS mask but typical wavelength coverage was 3700Å to 7500Å .
MOS allows the spectra of up to 19 candidates to be recorded simultaneously. However, due to positional limitations this was generally restricted to 15, supplemented where possible by H ii regions. In total, 198 candidates have been spectroscopically observed using 17 different MOS masks. To maximise continuum S/N, sources were grouped according to brightness, with total on-source integration times ranging from 720s for the brightest objects to 4800s for the faintest. Details of the spectroscopic log can be found in Table 1, and includes DIMM seeing measurements. The MOS masks were labelled according to the region of M 83 in which they were observed, i.e. Field A was observed using 5 different masks labelled A1 to A5.
| Date | MOS | Exposure | DIMM Seeing |
|---|---|---|---|
| Mask | (sec) | (′′) | |
| 2003-04-06 | D2 | 0.6 | |
| 2003-04-07 | D1 | 0.5 | |
| D4 | 0.5 | ||
| 2003-04-13 | D1 | 0.7 | |
| D3 | 0.7 | ||
| D5 | 0.5 | ||
| 2003-05-20 | C1 | 1.0 | |
| 2003-05-21 | C2 | 0.9 | |
| C3 | 0.9 | ||
| 2003-05-24 | A1 | 0.6 | |
| A3 | 0.5 | ||
| 2003-05-26 | A2,B2 | 0.7, 0.8 | |
| A5 | 0.8 | ||
| A4 | 0.6 | ||
| 2003-06-17 | A1 | 0.6 | |
| B1 | 0.6, 0.5 | ||
| B3 | 0.7 | ||
| B4 | 0.5 |
Datasets were prepared and processed using standard iraf and figaro packages i.e. the data were bias subtracted, flat field corrected, spectra were traced, extracted, and subsequently wavelength and flux calibrated. For very faint sources, where no continuum was evident, identification was made solely on the basis of strong emission lines, a neighbouring continuum source was used as the trace.
Spectroscopic magnitudes (hereafter mspec) were obtained by convolving the individual spectra with the transmission curves of the imaging filters. A comparison between the spectroscopic and the PSF photometry at permitted absolute flux calibration. For 160 sources brighter than 24 mag the average slit correction factor was found to be 3.1 (). This large factor is due in part to the often crowded nature of sources, such that the full profile extent was not extracted. For 20 spectroscopically observed regions, where photometry was unavailable, we corrected the spectroscopy by a factor of 31.5.
The blue (4500Å) continuum S/N ranged from 80 for the brightest sources, to 1 for the faintest sources. Nevertheless, lines were typically detected even in the faintest sources at the 5–10 level, and a source was only confirmed if WR emission lines were detected at a level.
3 The Wolf-Rayet Population of M 83
The WR content of the disk of M 83 has been determined by visually inspecting the extracted spectra for the characteristic WR emission signatures, i.e. N iii 4634–41, N v 4603–20, C iii – He ii blend (hereafter blue WR features) and/or C iii 5696, C iv features (hereafter yellow WR features).
Of the 198 sources spectroscopically observed, 132 contain WR emission features at a 3 level. These are presented in a catalogue in Table A1, in the Appendix, which includes coordinates, PSF (or spectroscopic) photometry, interstellar reddening, line measurements and WR populations. Deprojected distances are included using M 83 properties presented in Table 1 of Lundgren et al. (2004). We present finding charts for all confirmed sources in the (electronic only) Appendix, Figures B1–B17.
Of the remaining 66 sources, 40 displayed an early-type spectrum with no WR emission present, 16 resembled that of a late-type carbon star, while 10 sources revealed WR features below the 3 level, or lacked the blue region necessary for WN identification. The latter two groups, along with the 79 regions which were not spectroscopically observed, are given in our candidate list (Table A2 in the Appendix).
3.1 Interstellar reddening
Estimates of the interstellar reddening for our confirmed WR sources have generally been derived using measurements of the nebular H (accounting for nearby [N ii] emission) and H features present in the extracted spectra.
Assuming Case B recombination theory for typical electron densities of and a temperature of (Hummer & Storey, 1987), we obtain 0.2E(B-V)=c(H)/1.46 0.8 mag for the majority of the sources, with a few outliers, and typical formal uncertainty of 0.02 mag. Where Balmer emission was observed, typical H equivalent widths lay in the range Å. Consequently, the underlying stellar absorption components (1Å at H) are neglected.
In 41 sources no nebular lines were observed. For those with a well defined continuum, E(B–V) was estimated by assuming an intrinsic optical flux distribution equivalent to a late O-type star, with typical uncertainty of 0.05–0.1 mag. In 15 cases, the continuum S/N was insufficient for this comparison and an average reddening of E(B–V)= 0.50.3 was adopted. Correction for reddening adopt a standard Seaton (1979) extinction law with R=3.1=/E(B-V).
3.2 Spectral classification
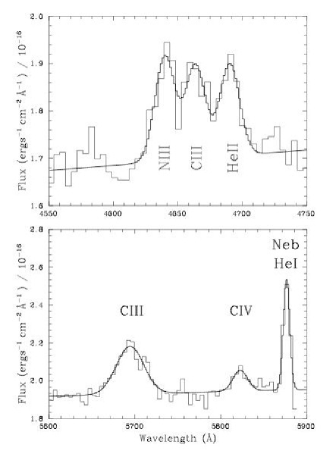
In order to classify and quantify the WR population within each region, we have fit Gaussian line profiles to the blue and yellow WR features, revealing line fluxes, equivalent widths and FWHM. An example of the fits to the blue and yellow WR features is presented in Fig. 3, where a source (#74) hosting a mixed WN and WC population is presented.
In general, it was straightforward to distinguish between WN (strong He ii ) and WC subtypes (strong C iii 4650 and C iii 5696 and/or C iv 5801-12). The following classification scheme was applied for further subdivision. In a minority of cases it was not possible to separate the 4650 – 4686 features into individual components, and as a result an overall blend was measured. Since WC subtypes were assigned on the basis of and features, this did not prevent accurate classification.
Late and early WN subtypes were assigned if He ii emission was accompanied by N iii or N v emission, respectively. If nitrogen lines were undetected, we assigned a WNE subtype if FWHM (He ii ) 20Å, and WNL otherwise. For WC stars, WC4 – 6 was assigned if C iv was present along with either weak or absent C iii . For (C iii 5696/C iv 5801-12) sources were classified WC7, and WC8–9 if C iii was present, with C iv weak or absent.
 |
 |
 |
To ensure consistency with previous studies (e.g. Schaerer et al., 1999a; Bresolin & Kennicutt, 2002; Chandar et al., 2004) we have derived WR populations based on individual line fluxes adapted from Schaerer & Vacca (1998). As discussed in Paper I, we adopt He ii 4686 lines fluxes of 5.2 erg s-1 and 1.6 erg s-1 for WN2-5 and WN6-10 stars, respectively. For WC stars, we adopt C iv 5801 line fluxes of 1.6 erg s-1 and 1.4 erg s-1 for WC4–6 and WC7 stars, respectively, and a C iii 5696 line flux of 7.1 erg s-1 for WC8–9 stars. WR contents of individual sources then follow, with populations rounded to the nearest integer (1). In one source (#117), we were unable to reliably extract the spectrum since it was located at the very edge of the slit, and so a measure of the reddening/line flux was not possible. Nevertheless, broad He ii 4686 is clearly present, with no WC signature, such that we indicate a population of early-type WN star.
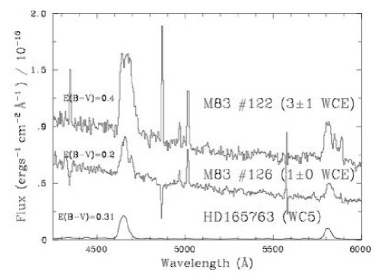
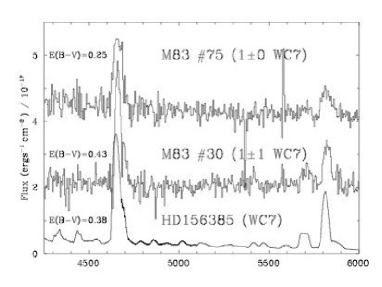
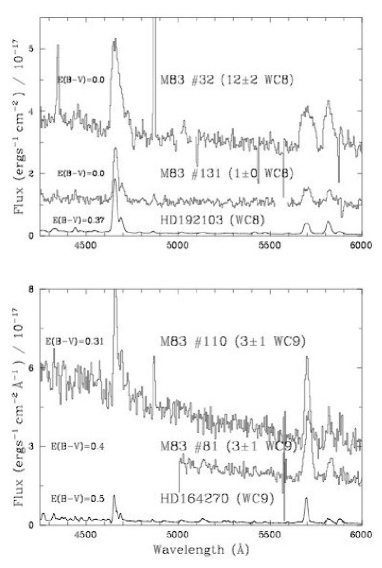
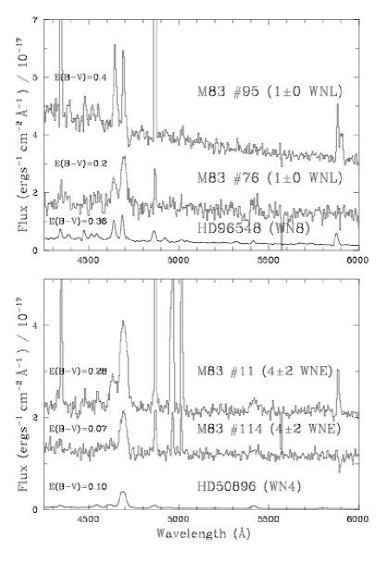
In Fig. 4 we compare sources containing representative late, mid and early WC stars from M 83 with extinction corrected Milky Way counterparts, scaled to the distance of M 83. Large line widths amongst M 83 members hosting late WC stars are apparent, particularly for #32 versus HD 192103 (WC8) and #81 versus HD 164270 (WC9). In contrast, sources containing WC4–7 stars indicate similar line widths to individual Galactic counterparts. Comparisons between sources containing WNL and WNE stars in M 83 and two Galactic counterparts are shown in Fig. 5, revealing similar spectral morphologies. Other examples of sources hosting WN and WC populations are presented in Fig.1 of Paper I.
3.3 The M 83 WR population – individual stars, binaries, complexes or clusters?
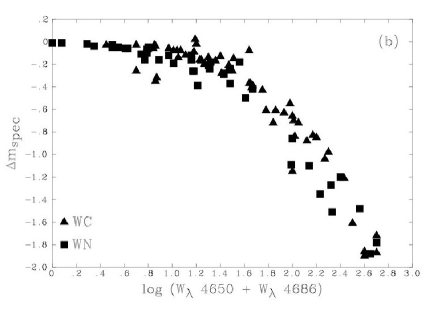
What is the nature of the 132 sources in M 83 that are known to host WR stars? In Fig. 6(a) we compare the spectroscopic continuum magnitude to the spectroscopic excess, – , for all sources. This is more complete than Fig. 2, since it was generally possible to estimate the spectral magnitude for the fainter sources, where PSF-photometry was not available.
|
The brightest confirmed WR sources in our sample (20 mag) exhibit –0.3 0.0 mag. Such values are consistent with luminous complexes, greatly diluting the WR emission signature. In contrast, the faintest confirmed sources (25 mag) possess large spectroscopic excesses of –2 –0.5 mag, consistent with isolated, single or binary WR systems. Intermediate brightness sources span the full range in excess, corresponding to less luminous regions hosting a few WR stars to those containing large WR populations.
Fig. 6(b) compares the spectroscopic excess to the C iii 4650/He ii 4686 equivalent width, confirming the expected tight correlation between line strength and , where the scatter indicates the observational accuracy. Typical excesses of –0.2 mag equate to small line equivalent widths of 10Å, whilst an excess of –1.0 mag corresponds to 100Å, and the largest excesses equate to 500Å. For comparison, single Galactic and LMC WR stars possess C iii 4650/He ii 4686 equivalent widths of 10–500Å (WN subtypes) or 150–2000Å (WC subtypes).
3.4 The global disk WR population of M 83
We identify 1035300 WR stars, comprising 564170 WC and 471130 WN stars, within our 132 spectroscopically observed regions, where errors quoted here were obtained from simply adding individual uncertainties for all regions.
The most important discovery of our spectroscopic survey is the dominant late-type WC population of M 83. Over half of the spectroscopically identified WR stars in M 83 fall into the WC8–9 subtype, with few WC4–7 stars identified. For comparison, no WC8–9 stars are observed in the SMC, LMC or M 33 and the total number of such stars in the Milky Way and M 31 is less than 50 (van der Hucht, 2001; Moffat & Shara, 1987). The distribution among late- and early-type WN stars is more even, with WNL/WNE . This value is much greater than that observed in the SMC (0) and LMC (0.25), but comparable to that of determined for the Milky Way (van der Hucht, 2001).
How robust is this derived WR population for M 83? For each source, we have propagated uncertainties in the distance, reddening, photometry and line flux measurements. Together, these translate to a typical uncertainty of %, or somewhat higher for regions in which an interstellar reddening or a slit loss correction factor have been adopted.
One of the main limitations in estimating the content of an unresolved WR population is the conversion from WR line flux to WR content. Given the large late WC population identified in M83, we have reconsidered the line flux of individual WC8–9 stars determined by Schaerer & Vacca (1998). From unpublished data for 5 Galactic, and 2 M 31 WC8–9 stars, each with well derived distances, we find a mean flux of and respectively. This is 30% lower than Schaerer & Vacca, and suggests that, if anything, we may be underestimating the true WC population of M 83.
We have also estimated the WC population using the alternative C iii line. Based on individual WR line fluxes of for individual WC4–6, WC7 and WC8–9 subtypes, respectively (Schaerer & Vacca, 1998), populations of individual sources were found to agree to within a factor of 2, relative to the yellow features. The total WC population was calculated to be 594 using C iii 4650, in excellent agreement with that of 564 obtained from C iii and C iv 5808.
Turning to the candidates for which spectroscopy was not obtained, all regions in Fig. 2 with –0.3 mag correspond to spectroscopically confirmed WR complexes. Therefore, we would expect that at least 25 out of the 49 candidates, for which 4684 and 4781 photometry is available, also possess WR stars. Adopting the same fraction for regions where PSF photometry is not available, we expect 50 of the remaining 89 candidate regions to contain WR stars. Indeed, #159 has already been observed by Bresolin & Kennicutt (2002). Designated M83-5 in their study, WR emission is spectroscopically confirmed and a population of 2 WCL and 6 WNL stars (scaled to a distance of 4.5Mpc) is inferred from its line luminosity. On average, our confirmed sources host 5 WR stars, such that we expect 250 WR stars await identification in M 83, bringing the total disk population to 1300.
The inferred WR population of M 83 is greater than that known in the entire Local Group, to date (Massey & Johnson, 1998). As anticipated from Figs. 2 and 6, some sources host a single WR star, whilst others contain larger WR populations (). Regions which contain an exceptionally large WR population will be discussed in more detail in the next section.
3.5 Complexes hosting large WR populations
In the Milky Way, the most massive open clusters (e.g. Arches, Westerlund 1) host at most 10–20 WR stars (Blum et al., 2001; Negueruela & Clark, 2005). Similar numbers are observed in the largest H ii regions of M 33, and 30 Doradus in the LMC. We identify 10 regions in M 83 with large (20), or mixed, WR populations. Mixed WN and WC populations are observed in a total of 5 complexes, #66 (82 WNL, 41 WC7), #38 (72 WNL, 216 WCL), #41 (144 WNL, 136 WC7), #86 (94 WNL, 2410 WCL) and #74 which will be discussed separately.
Are the sources that host WR stars in M 83 compact clusters (e.g. Arches) or extended, giant H ii regions (30 Doradus)? Massive compact clusters are generally rare in normal disk galaxies, although M 83 is known to host many examples, from HST imaging (Larsen, 2004). Of the 60 bright H ii regions in M 83 identified by de Vaucouleurs et al., between 28–38 host WR populations. Indeed, the 3 complexes hosting the largest WR populations are all associated with H ii regions identified by de Vaucouleurs et al.. Optical spectroscopy of these were presented in Paper I, together with an estimate of their O star population.
3.5.1 Source #74
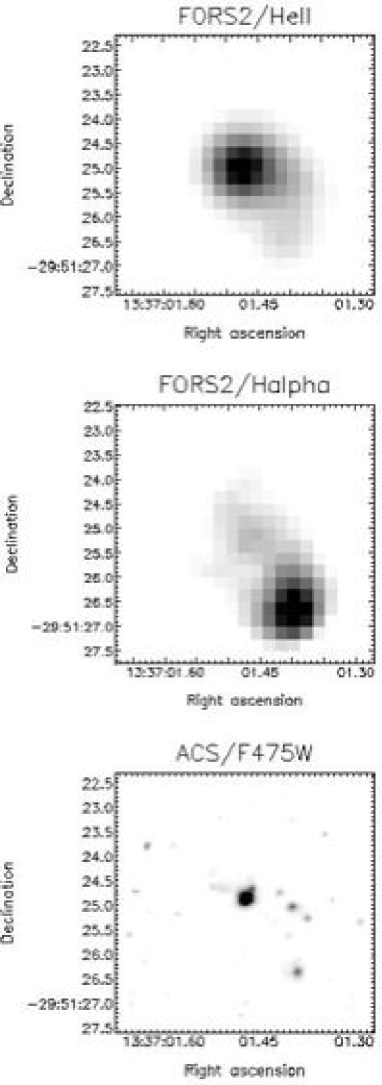
From our sample #74 is exceptional, with 23050 late-type WN and WC stars inferred from the de-reddened line fluxes (recall Fig.3). This source has the highest interstellar reddening of our entire sample with E(B-V)=1.00.03, although it is closest to the nucleus. However, the H/H nebular value is supported from fitting its stellar continuum to a young (4 Myr) instantaneous burst model at Z=0.04 from Starburst99 (Leitherer et al., 1999). In Paper I, we estimated a Lyman continuum flux of 8 s-1 from the de-reddened H flux, such that #74 has an ionizing flux equivalent to the giant H ii region 30 Doradus. However, it possesses a WR content which is a factor of ten times larger, i.e. N(WR)/N(O)0.25 versus 0.02 in 30 Doradus.
We have inspected archival HST/Advanced Camera for Surveys (ACS) Wide Field Camera (WFC) F475W datasets of M 83 (Proposal 9299, P.I. H. Ford). This revealed that #74 is very compact, with a FWHM of 0.2 arcsec or 4.5 pc (for a distance of 4.5Mpc). For H ii regions with solar or super-solar metallicities, WR signatures are expected to be present in bursts of age 3–6Myr. We have compared the absolute F475W magnitude of #74 with evolutionary synthesis models for an instantaneous burst of age 3–5Myr (Leitherer et al., 1999), from which we estimate a mass of 1.4–2. Therefore, its mass and size indicate that it is a young massive compact cluster, or Super Star Cluster (Whitmore, 2003).
In Fig.7 we present arcsec ( pc) images of #74 obtained with FORS2 and ACS. It is apparent that the peak H source, i.e. H ii region #35 from de Vaucouleurs et al. (1983), lies 2 arcsec to the S-W of the brightest continuum source (the WR cluster). The spectrum presented in Fig.2 of Paper I is that of the WR cluster, whilst the H flux, and corresponding O7V star content of 810 represents the integrated total from both regions. The WR cluster provides approximately 1/3 of the total H ii luminosity, such that the WR/O ratio of this region approaches unity, comparable to the WR cluster NGC 3125-1 (Chandar et al., 2004).
3.5.2 Other Clusters in M 83
Larsen (2004) has identified 80 young massive clusters in M 83 based on HST/WFPC2 images. Three such regions are in common with our catalogue of sources containing WR stars, namely n5236-607 (#61), -617 (#73) and -277 (#79), although none host more than a few WR stars. Larsen (priv. comm.) has compared the UBVI colours of these clusters with Solar metallicity Bruzual & Charlot (1993) models, suggesting age estimates of 0.51, 6.900.54 and 9.891.87, respectively. The first two are fully consistent with a young cluster which contains WR stars, while the third suggests a dominant old population.
Five additional clusters from Larsen (2004) are also in common with our remaining candidates, namely n5236-169 (#193), -805 (#179), -818 (#163), -1011 (#157) and -1027 (#173). Of course, such candidates have the potential to also host a large WR population - indeed three of these clusters appear young (1.5–6Myr) from UBVI photometry (Larsen, priv. comm.), i.e. #193, #179 and #157. Note that #179 is one of two clusters for which dynamical mass estimates has been made by Larsen & Richtler (2004). Follow-up spectroscopic observations would be required for the identification of additional WR rich clusters.
3.6 Comparisons with previous studies
To date, there have only been two previous studies relating to WR stars within M 83. Rosa & Richter (1988) and Bresolin & Kennicutt (2002) have both studied stellar populations within M 83 and identify six H ii regions which exhibit WR characteristics. Four of these have been re-examined in this study. Rosa & Richter obtain optical spectra with very poor signal-to-noise preventing a quantitative discussion, consequently we shall restrict any comparisons solely to results obtained by Bresolin & Kennicutt (2002).
Both studies followed a similar methodology in estimating the WR population, except that Bresolin & Kennicutt adopted a distance of 3.2Mpc to M 83 (versus 4.5Mpc adopted here). This introduces a factor of 2 between intrinsic line luminosities observed in this study and that by Bresolin & Kennicutt.
-
•
#40 (M83-2) – The derived WR population for this region is estimated to be 62 WC8–9, contrasting that of 1–2 WNL obtained by Bresolin & Kennicutt. We achieve a 3 detection for the and carbon features, suggesting that poor signal-to-noise in the original investigation prevented positive WC identification.
-
•
#41 (M83-3) – We confirm the detection of 144 WNL stars identified in region M83-3. In addition we estimate the presence of 136 WC7 stars. Bresolin & Kennicutt state that C iii may be present, but not at a significant level (versus here).
-
•
#74 (M83-8) – Bresolin & Kennicutt failed to detect any WR emission in this H ii region. However, we find the largest individual WR population of any source, namely 230 stars. As stated in Sect.3.5 the WR emission is offset by several arc-secs to the N-E of the peak emission. Since the Bresolin & Kennicutt concentrated on bright H ii regions, their slit was probably centred on the peak emission, such that the WR signature was missed.
-
•
#103 (M83-9) – Both investigations infer a late WN population. The present study obtains a population of 299 WNL stars, in agreement with that estimated by Bresolin & Kennicutt after allowing for differences in the assumed distance.
4 Discussion
We have identified up to 200 regions in the disk of M 83 that host WR stars. We now compare the properties of WR stars at the high metallicity of M 83 with those of Local Group galaxies, attempt to explain the dominant late subtypes amongst WC stars, and make comparisons with current evolutionary models.
4.1 Properties of WR stars at high metallicity
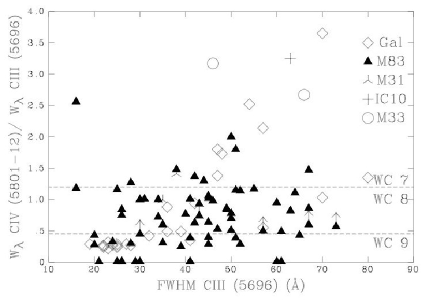
How do the line strengths and widths of sources containing WR stars in M 83 compare with those of other galaxies? In Fig. 8, we show the classification ratio (C iv 5808) / (C iii 5696) versus FWHM (C iii 5696). Data for WC7–9 stars in four Local Group galaxies are included, along with subtype boundaries as derived by Crowther et al. (1998). This figure highlights the dominance of WC8 and WC9 subtypes, which comprise 95% of the total WC content of M 83, by number.
The Galactic WC9 population is very homogeneous, centred on a FWHM of 25Å and (C iv 5808) / (C iii 5696) 0.3. In contrast, the WC9 population of M 83 is very heterogeneous, spanning a wide range of both FWHM and (C iv 5808) / (C iii 5696), with the maximum FWHM reaching Å, 2.5 times greater than the typical Galactic WC9 star. Line widths of sources hosting WC8 stars are much greater than typical Galactic WC8 stars, whilst the few sources containing WC7 subtypes are more indicative of Milky Way counterparts.
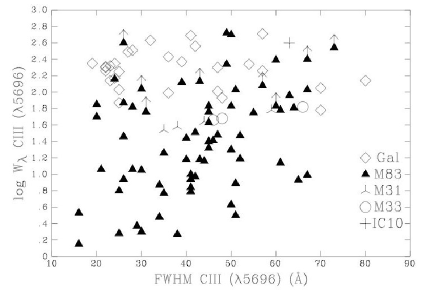
In Fig. 9 we present C iii 5696 line width versus line strength for WCL stars observed in M 83, along with data for single or binary WCL stars in Local Group galaxies. The majority of WR complexes observed in M 83 display evidence for line dilution from underlying stellar continua, since line strengths fall well below those observed in Local Group counterparts. Some WR complexes in M 83 do display similar line strengths to those in the Milky Way or M31/M33, suggesting little evidence of line dilution in those cases.
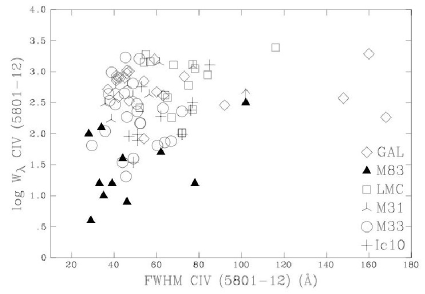
In Fig. 10 we compare (C iv ) to FWHM (C iv ) for early-type WC stars in M 83, with (mostly single) Galactic and LMC counterparts. Again, the observed line strengths of sources containing early WC stars in M 83 fall below those of Galactic and LMC stars. This is again attributed to line dilution by the underlying continua from early-type stars.
From Fig. 10, the observed WCE line widths of M 83 members are generally comparable to, or lower than, those of other Local Group members, in contrast with WC8, and especially, WC9 subtypes. Indeed, there are no cases for which FWHM (C iv 5808) 100Å, corresponding to WO subtypes in the Milky Way/LMC (Kingsburgh et al., 1995; Drew et al., 2004), except possibly #6 for which no evidence of O vi 3811-34 is observed.
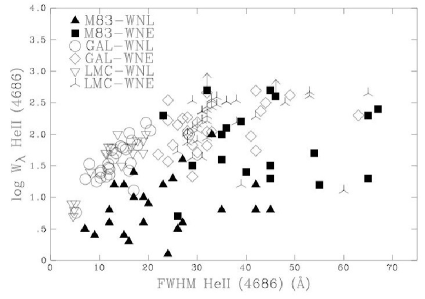
Finally, in Fig.11 we compare the equivalent width and FWHM of He ii 4686 for all WN sources identified in M 83. Again, we have included data for single/binary Galactic and LMC WN stars. Aside from the effect of line dilution, some late-type WN stars in M 83 possess unusually large line widths. In some M83 complexes hosting multiple WN stars, line widths are a factor of two greater than Galaxy or LMC counterparts. These are reminiscent of observations of broad, strong N iii 4640 in unresolved WR galaxies (Schmutz & Vacca, 1999).
4.2 Origin of late WC stars at high metallicity?
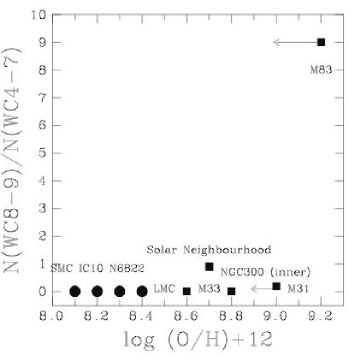
In Fig. 12 we compare the fractional distribution of WC8–9 to WC4–7 stars in galaxies with a wide range of metallicity. This clearly illustrates the extreme WCL population hosted by M 83, indicating that WCL stars are uniquely associated with metal-rich environments. In M 83 the relative number of late to early WC stars is found to be , much greater than 0.9 and observed for the Milky Way and M 31 respectively. C iii 5696 has been observed in a small number of metal-rich WR galaxies (Phillips & Conti, 1992; Pindao et al., 2002), but as these represent integrated populations, the ‘average’ WC subtype is generally WC7–8.
It has long been recognised that Milky Way WC9 stars are universally observed towards the Galactic Centre. Smith & Maeder (1991) argued that the apparent trend towards later subtypes was due to heavy mass-loss, revealing WC subtypes at an earlier evolutionary phase, assuming the surface (C+O)/He ratio decreases from early to late WC subtypes. However, subsequent spectral analysis failed to confirm any systematic trend in C/He with subtype (Kosterke & Hamann, 1995), arguing against late WC stars being exposed earlier due to prior mass-loss.
Instead, Crowther et al. (2002) claimed that WC subtypes resulted from primarily metallicity-dependent wind strengths. They suggested that the strength of C iii 5696 scales very sensitively with wind density. If wind strengths increase with increasing (heavy element) metallicity, as already established for OB stars, stars which are otherwise identical will only reveal strong C iii 5696 emission at high metallicities, with a corresponding late subtype.
Indeed, late-type WC stars are observed across the disk of M 83 at a lower average galactocentric distance of 2.9 0.9 arcmin ( = 0.4 0.1 ) versus 3.6 0.9 arcmin ( = 0.5 0.1 ) for early-type WC stars. This can be explained by the weak metallicity gradient observed in M 83 (Pilyugin et al., 2004) since stars at smaller galactocentric distances will be more metal-rich than those at larger galactocentric distances.
As discussed in the introduction, the lower mass limit for stars that ultimately become WR stars decreases with increasing metal content, i.e. the lifetimes of low (initial) mass WR stars are greatly enhanced relative to those at lower metallicity. Could late WC stars be the descendants of such (low initial mass) stars, such that they greatly outnumber the (initially more massive) early WC stars?
In this scenario, one would expect late WC stars to be observed in Milky Way clusters with low mass turn-off’s. Schild & Maeder (1986) identified the Galactic WC stars WR77 (WC8) and WR95 (WC9) in open clusters with progenitor masses as low as 35, whilst early WC stars appear to originate from more massive progenitors ( 60). More recently, Massey et al. (2001) identified the late WC WR93 (WC7) with a very high progenitor mass of , comparable to or higher than early WC subtypes. Unfortunately, WC8–9 stars were not included in their study. In addition, the late WC component of WR11 ( Vel, WC8+O7.5) originates from a mass somewhat in excess of 30, the current mass of the O star companion (De Marco & Schmutz, 1999). Overall, there is limited evidence for a distinction between the progenitor masses of early and late WC stars. Since nebular H emission scales inversely with age, the complexes hosting early- and late-type WC stars appear to be located in both young and old clusters, such that they do indeed originate from the same parent population.
Consequently, the observed WC population in M 83 can most naturally be explained if WC winds are metallicity dependent. Increased mass-loss would elevate the strength of the classification line C iii 5696 resulting in predominantly late WC subtypes. Increased mass-loss rates would, of course, have implications for the life-times of WC stars. For an initial mass of 40 M⊙ and , a WR star would spend 50% less time in the WC phase with a metal dependent stellar wind (See Meynet & Maeder, 2004). At the current stage, however, it is not possible to firmly exclude different progenitor masses for early and late WC populations.
Finally, a similar metallicity effect was earlier proposed by Crowther (1998), i.e. WO subtypes would be restricted to environments with weak winds (i.e. low metallicities) due to the inverse sensitivity of O vi 3811-34 with increased mass-loss. The absence of WO stars in M 83 is also consistent with the inverse sensitivity of the classification line O vi 3811-34 to increasing wind strength due to higher metallicity.
4.3 Comparison with evolutionary predictions
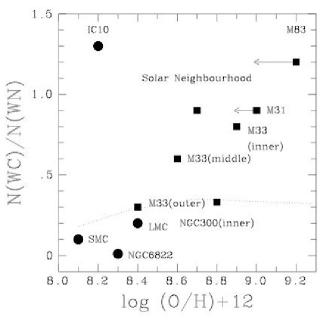
Surveys for WR stars in Local Group galaxies over the past three decades have revealed a strong correlation between the relative number of WC to WN stars and oxygen content of the host galaxy (Massey, 1996). Extrapolating from previous observations, one would expect N(WC)/N(WN) for a galaxy forming stars continuously with twice the Solar oxygen content (Massey & Johnson, 1998).
A summary of results for the disk population of M 83 are presented in Table 2 together with Local Group members, such that the observed N(WC)/N(WN) ratio is presented in Fig.13. Indeed, M 83 continues the observed trend rather well with N(WC)/N(WN)1.2. Undoubtedly, completeness should obviously be kept in mind given that WC stars are more readily identified in external galaxies than WN stars due to their intrinsically stronger lines. Nevertheless, our approach is optimised for net emission at 4686, such that we achieve cases of 4 spectroscopic WNL detections with (He ii 4686) 1Å.
Recent bursts of star formation may cause strong deviations from the general trend via a strong enhancement of the WC population at an age of 5Myr (Pindao et al., 2002). Consequently, galaxies in which there is a significant recent starburst episode may strongly deviate from this correlation. IC 10 strongly deviates from the overall trend in Fig. 13 due to an apparent ‘galaxy-wide’ starburst (Crowther et al., 2003), although the WN population may be significantly incomplete (Massey & Holmes, 2002).
In the case of M 83, since we have no information on the nuclear starburst, the above statistics should be reasonable for the quiescent star forming regions, except that the presence of a recent starburst in #74 represents a non-negligible fraction of the total disk WR population. If we were to exclude #74 from our statistics, we would obtain N(WC)/N(WN)=1 (equivalent to the Milky Way) and N(WC8–9)/N(WC4–7)=6 (vs 0.9 in the Milky Way) for the quiescent disk. The subtype ratios remain far from current evolutionary predictions at high metallicity (Meynet & Maeder, 2004).
Recently, Meynet & Maeder (2004) have constructed a set of evolutionary models for rotating (initially km s-1) massive stars from =0.004 (SMC) to 0.04 (M 83). For low metallicity Local Group galaxies, predictions from rotating models are in good agreement with observed WC to WN ratios (see Fig. 13). However, at higher metallicities, even allowing for metallicity dependent WR winds, evolutionary models fail and dramatically underestimate the number of WC stars, i.e. WC/WN=0.36 at =0.04. In fact, non-rotating models provide a better match to our observations of M 83, although such models are unsuccessful in predicting the correct fraction of Type Ib/c to Type II Supernovae at high metallicity. Consequently, there remains a significant discrepancy between the observed and predicted WR populations above Solar metallicities.
Evolutionary models distinguish between late and early WN subtypes via the presence or absence of hydrogen, whilst spectroscopic definitions relate to the observed ionization of nitrogen lines. Determinations of hydrogen content are possible for Local Group WN stars, but the strong nebulosity and potential multiplicity for sources at the distance of M 83 prevent such measurements. For a twice Solar metallicity (=0.04), Meynet & Maeder (2004) predicts WNL/WNE 4 by number, allowing for metallicity dependent WR wind strengths. This should provide a reasonable analogue to the observational statistics for M 83, on the basis of a good correspondence between late WN stars (with hydrogen) and early WN stars (without hydrogen) in the Milky Way. Consequently, as with the WC to WN ratio, the predicted distribution amongst WN subtypes (4) differs from observations (1) by a significant factor.
Nitrogen in WN stars is of course partially processed from carbon and oxygen, such that the CNO equilibrium abundance linearly scales with metallicity. As a consequence, the abundance of nitrogen in M 83 WN stars will exceed that in the Milky Way and other Local Group galaxies. Crowther (2000) demonstrated that for otherwise identical parameters, N iii 4634–41 reacts more sensitively than N iv 4058 to increased nitrogen content, i.e. a later WN subtype results. If WN winds are also metallicity dependent, the effect will be magnified such that one will expect a predominantly late WN population at high metallicities.
Indeed, given the weak metallicity gradient of M 83 (Pilyugin et al., 2004), late-type WN stars are located within the inner regions of M 83, at an average galactocentric distance of 2.20.9 arcmin ( = 0.30.1 ) versus 3.51.3 arcmin ( = 0.50.2 ) for early-type WN stars.
5 Summary
Our analysis of the VLT/FORS2 imaging and spectroscopic data indicates that the disk of M 83 hosts a large WR population. Using narrow-band optical images we have identified 283 candidate WR regions within M 83, of which 198 have been spectroscopically observed. Of these we find that 132 regions contain WR stars. Absolute WR populations have been derived using line flux conversions adapted from Schaerer & Vacca (1998). We estimate a total WR population of 1035300, consisting of 564170 WC and 471130 WN stars from this population, i.e. a quiescent N(WC)/N(WN) ratio of 1.2, or 1.0 excluding the starburst cluster #74. This differs greatly from current evolutionary predictions at high metallicity, which suggest N(WC)/N(WN)0.36, even allowing for metallicity dependent WR mass-loss rates (Meynet & Maeder, 2004).
The observed statistics exclude both the potentially large WR population in the central starburst, plus the population of perhaps 250 WR stars resulting from remaining candidates. Pellerin (2004) has carried out spectral synthesis of observations of the nucleus of M 83(30) suggesting a mass of 1.5 and age 3.5 Myr, with an inferred WR population of 1700. This appears plausible given that the nuclear starburst has a star formation rate approaching that of the disk (Harris et al., 2001; Bell & Kennicutt, 2001). Consequently, the total WR population of M 83 may exceed 3000.
Using the WR population derived in this study, the global surface density of M 83 is found to be 3 WR/kpc2, typical of that observed in the Solar Neighbourhood and M33 (Massey & Johnson, 1998). If the nucleus and remaining candidates are accounted for this likely to increase this by a factor of 3.
The WC population of M 83 is dominated by late-type stars. The relative number of WC8–9 to WC4–7 stars is found to be (or 6 excluding cluster #74), outnumbering that of any other Local Group galaxy tenfold, as illustrated in Fig. 12. WO stars are not observed in M 83 suggesting that there is a genuine trend to later subtype at higher metallicities. Observed line widths in early WC subtypes appear to be comparable to those observed in the Milky Way and LMC. This population is most readily explained by a metallicity dependent wind strength amongst WC subtypes.
M 83 has a substantial WN population, evenly split between early and late subtypes. The high WNL population likely results from the sensitivity of nitrogen diagnostics to the high global metallicity, whilst evidence in favour of metallicity dependent winds amongst WN subtypes is less clear. Evolutionary models, in contrast, predict a far higher late WN population at high metallicities, with WNL/WNE4–5 (Meynet & Maeder, 2004).
From the present study we infer 9 complexes in M 83 which contain a large WR population (), with #74 hosting over 200 late-type WN and WC stars, outnumbering 30 Doradus tenfold. HST/ACS images indicate that #74 is a compact cluster, whilst several other massive compact clusters from Larsen (2004) host more modest WR populations.
Within galaxies located at up to 10 Mpc, how unusual are the sources in M 83 with regard to WR content? Schaerer et al. (1999a) identified 40 WN and WC stars in clusters A and B of NGC 5253, similar to #41 in M 83, whilst He 2–10 dwarfs even #74, with 1100 WN and 250 WC stars. Recently, Chandar et al. (2004) use HST/STIS UV spectroscopy to claim NGC 3125-1 hosts 5000 WNL stars, a factor of ten times greater than optically derived by Schaerer et al. (1999a), and comparable to the global WR population in M 83. Consequently, the WR population of M 83, and source #74 in particular, is extreme only with respect to Local Group galaxies. Where our results for M 83 stand out from previous studies is the ability to resolve the disk WR population into 200 regions.
Given such a large WR population in the optically visible disk of M 83, it is likely that one such massive star will undergo a core-collapse each century, given typical WR lifetimes of 105 yr. Indeed, SN1983N (Porter & Filippenko, 1987), one of the six optically visible SN that have been reported in M83 since 1923, was a type Ib SN, for which WR stars are considered as the most probable precursors.
In order to directly witness a WR explode as a supernova on a shorter timeframe of a decade or so, a survey of the WR population in 10–20 nearby (10Mpc) massive star forming galaxies would be required. The present observational program will continue towards this goal, complementing existing broad-band pre-Supernova surveys (Smartt et al., 2003; Van Dyk et al., 2003).
Acknowledgements.
LH acknowledges financial support from PPARC and a Royal Society summer studentship award, PAC acknowledges financial support from the Royal Society. We thank Soeren Larsen for providing ages estimates of clusters from broad-band photometry. Some of the data presented in this paper were obtained from the Multimission Archive at the Space Telescope Science Institute (MAST). STScI is operated by the Association of Universities for Research in Astronomy, Inc., under NASA contract NAS5-26555. Support for MAST for non-HST data is provided by the NASA Office of Space Science via grant NAG5-7584 and by other grants and contracts.Appendix A Catalogue
Tables A1 and A2 list properties of confirmed and candidate regions containing WR stars in M 83.
Appendix B Finding charts (electronic only)
Fig. B1 provides a master key to individual finding charts B2–B17, obtained from FORS2 4684 images.
References
- Abbott et al. (2004) Abbott, J. B., Crowther, P. A., Drissen, L., Dessart, L., Martin, P., & Boivin, G. 2004, MNRAS, 350, 552
- Asplund et al. (2004) Asplund, M., Grevesse, N., Sauval, A., Allende Prieto, C., & Kiselman, D. 2004, A&A, 417, 751
- Bell & Kennicutt (2001) Bell, E. & Kennicutt, R. 2001, ApJ, 548, 681
- Blum et al. (2001) Blum, R. D., Schaerer, D., Pasquali, A., Heydari-Malayeri, M., Conti, P. S., & Schmutz, W. 2001, AJ, 122, 1875
- Bresolin et al. (2004) Bresolin, F., Garnett, D. G., & Kennicutt, R. C. 2004, ApJ, 615, 228
- Bresolin & Kennicutt (2002) Bresolin, F. & Kennicutt, R. C. 2002, ApJ, 572, 838
- Breysacher et al. (1999) Breysacher, J., Azzopardi, M., & Testor, G. 1999, A&AS, 137, 117
- Bruzual & Charlot (1993) Bruzual, A. & Charlot, S. 1993, ApJ, 405, 538
- Chandar et al. (2004) Chandar, R., Leitherer, C., & Tremonti, C. A. 2004, ApJ, 604, 153
- Conti & Massey (1989) Conti, P. S. & Massey, P. 1989, ApJ, 337, 251
- Crowther (1998) Crowther, P. A. 1998, in Wolf-Rayet Phenomena in Massive Stars and Starburst Galaxies, Proc IAU Symp 193, ed. K. van der Hucht, G. Koenigsberger, & P. Eenens (San Francisco: ASP), 116
- Crowther (2000) Crowther, P. A. 2000, A&A, 356, 191
- Crowther et al. (1998) Crowther, P. A., De Marco, O., & Barlow, M. J. 1998, MNRAS, 296, 367
- Crowther et al. (2002) Crowther, P. A., Dessart, L., Hillier, D., Abbott, J., & Fullerton, A. W. 2002, A&A, 392, 653
- Crowther et al. (2003) Crowther, P. A., Drissen, L., Abbott, J. B., Royer, P., & Smartt, S. J. 2003, A&A, 404, 483
- Crowther et al. (2004) Crowther, P. A., Hadfield, L. J., Schild, H., & Schmutz, W. 2004, A&A, 419, L17
- Crowther & Smith (1997) Crowther, P. A. & Smith, L. J. 1997, A&A, 320, 500
- De Marco & Schmutz (1999) De Marco, O. & Schmutz, W. 1999, A&A, 345, 163
- de Vaucouleurs et al. (1983) de Vaucouleurs, D., Pence, W., & Davoust, E. 1983, ApJS, 53, 455
- Drew et al. (2004) Drew, J. E., Barlow, M. J., Unruh, Y. C., Parker, Q. A., Wesson, R., Pierce, M. J., Masheder, M. R. W., & Phillipps, S. 2004, MNRAS, 351, 206
- Elmegreen et al. (1998) Elmegreen, D. M., Chromey, F. R., & Warren, A. R. 1998, AJ, 116, 2834
- Foellmi et al. (2003) Foellmi, C., Moffat, A., & Guerrero, M. 2003, MNRAS, 338, 360
- Gonzalez Delgado et al. (1997) Gonzalez Delgado, R. M., Leitherer, C., Heckman, T., & Cervino, M. 1997, ApJ, 483, 705
- Harris et al. (2001) Harris, J., Calzetti, D., Gallagher III, J. S., Conselice, C. J., & Smith, A. D. 2001, AJ, 122, 3046
- Hummer & Storey (1987) Hummer, D. & Storey, P. J. 1987, MNRAS, 224, 801
- Karachentsev et al. (2002) Karachentsev, I. D., Sharina, M. E., Dolphin, A. E., Grebel, E. K., Geisler, D., Guhathakurta, P., Hodge, P., Karachentseva, V. E., Sarajedini, A., & Seitzer, P. 2002, A&A, 385, 21
- Kingsburgh et al. (1995) Kingsburgh, R., Barlow, M. J., & Storey, P. 1995, A&A, 295, 75
- Kosterke & Hamann (1995) Kosterke, L. & Hamann, W.-R. 1995, A&A, 299, 503
- Kunth & Sargent (1981) Kunth, D. & Sargent, W. 1981, A&A, 101, L5
- Larsen (2004) Larsen, S. 2004, A&A, 416, 537
- Larsen & Richtler (2004) Larsen, S. & Richtler, T. 2004, A&A, 427, 495
- Leitherer et al. (1999) Leitherer, C., Schaerer, D., Goldader, J. D., Gonzalez Delgado, R. M., & Carmelle, R. 1999, ApJS, 123, 3
- Lundgren et al. (2004) Lundgren, A. A., Wikland, T., Olofsson, H., & Rydbeck, G. 2004, A&A, 413, 505
- Massey (1996) Massey, P. 1996, in Wolf-Rayet stars in the Framework of Stellar Evolution, ed. J.-. Vreux, C. W. H. et al. De Loore, & A. Willis (Univerity of Liege: Liege), 361
- Massey & Holmes (2002) Massey, P. & Holmes, S. 2002, ApJ, 580, L35
- Massey & Johnson (1998) Massey, P. & Johnson, O. 1998, ApJ, 505, 793
- Massey et al. (2003) Massey, P., Olsen, K. A. G., & Parker, J. W. 2003, PASP, 115, 1265
- Massey et al. (2000) Massey, P., Waterhouse, E., & DeGioia-Eastwood, K. 2000, AJ, 119, 2214
- Massey et al. (2001) —. 2001, AJ, 121, 1050
- Meynet & Maeder (2004) Meynet, G. & Maeder, A. 2004, A&A, 429, 581
- Moffat & Shara (1987) Moffat, A. F. J. & Shara, M. M. 1987, ApJ, 320, 266
- Negueruela & Clark (2005) Negueruela, I. & Clark, J. S. 2005, A&A, astro-ph/0503303
- Pellerin (2004) Pellerin, A. 2004, PhD thesis, Université Laval, Quebec
- Phillips & Conti (1992) Phillips, A. & Conti, P. 1992, ApJ, 385, L91
- Pilyugin et al. (2004) Pilyugin, L. S., Contini, T., & Vilchez, J. M. 2004, A&A, 423, 427
- Pindao et al. (2002) Pindao, M., Schaerer, D., Gonzalez Delgado, R. M., & G., S. 2002, A&A, 394, 443
- Porter & Filippenko (1987) Porter, A. C. & Filippenko, A. V. 1987, AJ, 93, 1372
- Rosa & Richter (1988) Rosa, M. & Richter, O. G. 1988, A&A, 192, 57
- Schaerer et al. (1999a) Schaerer, D., Contini, T., & Kunth, D. 1999a, A&A, 341, 399
- Schaerer et al. (1999b) Schaerer, D., Contini, T., & Pindao, M. 1999b, A&AS, 136, 35
- Schaerer et al. (2000) Schaerer, D., Guseva, N., Izotov, Y., & Thuan, T. 2000, A&A, 362, 53
- Schaerer & Vacca (1998) Schaerer, D. & Vacca, W. D. 1998, ApJ, 497, 618
- Schild et al. (2003) Schild, H., Crowther, P. A., Abbott, J. B., & Shmutz, W. 2003, A&A, 397, 859
- Schild & Maeder (1986) Schild, H. & Maeder, A. 1986, A&A, 136, 237
- Schmutz & Vacca (1999) Schmutz, W. & Vacca, W. D. 1999, New Ast. Rev., 4, 197
- Seaton (1979) Seaton, M. J. 1979, MNRAS, 187, 73p
- Smartt et al. (2003) Smartt, S. J., Maund, J. R., Gilmore, G. F., Tout, C., Kilkenny, D., & Benetti, S. 2003, MNRAS, 343, 735
- Smith & Maeder (1991) Smith, L. F. & Maeder, A. 1991, A&A, 241, 77
- Smith (2005) Smith, L. J. 2005, in Formation and Evolution of Young Massive Clusters, ed. H. J. G. L. M. Lamers, A. Nota, & L. J. Smith, Vol. 233 (San Francisco: ASP), 159
- Thim et al. (2003) Thim, F., Tammann, G. A., Saha, A., Dolphin, A., Sandage, A., Tolstoy, E., & Labhardt, L. 2003, ApJ, 590, 256
- van der Hucht (2001) van der Hucht, K. A. 2001, New Ast. Rev., 45, 135
- Van Dyk et al. (2003) Van Dyk, S., Li, W., & Filippenko, A. 2003, PASP, 115, 1
- Vink et al. (2001) Vink, J. S., de Koter, A., & Lamers, H. J. G. L. M. 2001, A&A, 369, 574
- Whitmore (2003) Whitmore, B. 2003, in A Decade of HST Science, Proc. STScI Symp Series Vol 14, ed. M. Livio & et al. (Cambridge: CUP), 153
Table A1. Catalogue of sources with confirmed WR spectroscopic
signatures in M 83. Errors are indicated on the second row for each
source. Note and MB shown in parentheses
correspond to spectroscopic photometry. De-projected distances are
expressed as a fraction of the Holmberg radius , equivalent widths and FWHM are
in Å and observed line fluxes, , are expressed in
. The number of, and error in, WR
stars in each source are estimated from the line luminosities
indicated in Sect 3.2 and a distance of 4.50.3 Mpc
(Thim et al., 2003).
Cat
RA
Dec
DeV
C iii 4650/He ii 4686
C iii 5696
C iv 5808
WN
WC
MOS
#
J2000
mag
mag
mag
mag
FWHM
FWHM
FWHM
2–5
6–10
4–6
7
8–9
Mask
1a
13:36:40.28
-29:51:21.1
0.65
Extended
0.50
1
3
15
3.8
3
D5,B5
0.01
1.5
1
2
13:36:41.04
-29:51:55.9
0.63
18.2
-0.2
0.54
-11.8
6
15
6.1
1
15
2.5
2
35
2.9
2
D4
0.0
0.1
0.01
0.2
2.9
7.0
9.1
1
3a
13:36:41.14
-29:51:48.8
0.62
(24.6)
(-1.9)
0.41
(-5.3)
400
20
1.8
400
25
2.4
300
20
5.6
2
D2
0.02
6.8
7.8
3.3
1
4
13:36:41.16
-29:52:21.7
0.63
21.1
-0.3
0.70
-9.8
35
35
3.0
16
D2
0.1
0.1
0.05
0.3
6.7
5
5
13:36:41.28
-29:52:24.4
0.63
19.6
-0.2
0.39
-9.9
20
35
1.2
15
50
7.8
4
30
4.0
8
B2
0.1
0.1
0.03
0.2
1.1
1.1
1.1
1
6
13:36:41.64
-29:48:24.6
0.75
23.0
(-0.5)
0.50b
(-5.0)
300
100
6.0
3
B4
0.1
0.30
1.5
3
7
13:36:43.40
-29:52:24.1
0.56
17.7
-0.1
0.56
-12.5
3
1
10
4.3
5
B3
0.1
0.1
0.01
0.2
1.7
2
8a
13:36:43.46
-29:52:08.3
0.55
(23.6)
(-0.6)
0.20
(-6.2)
90
30
3.4
50
20
1.2
15
10
2.5
1
D1
0.05
3.0
1.8
1.4
0
9
13:36:43.86
-29:52:36.4
0.55
20.8
-0.7
0.55
-8.8
10
40
2.5
1
D3
0.1
0.1
0.05
0.3
7.3
0
10
13:36:44.17
-29:52:26.8
0.54
22.4
(-0.6)
0.50b
(-7.1)
70
25
2.8
60
60
1.5
30
35
6.8
2
D1
0.1
0.30
3.5
3.9
2.4
2
11
13:36:45.21
-29:51:05.5
0.50
22.6
(-1.8)
0.28
(-5.6)
500
45
3.4
4
D1
0.1
0.02
1.6
2
12
13:36:45.85
-29:53:35.0
0.55
23.2
(-0.9)
0.33
(-5.6)
100
35
1.1
2
D1
0.2
0.01
1.1
0
13
13:36:45.87
-29:52:37.8
0.49
19.2c
-0.6
0.38
-10.1
20
75
1.9
3
D3
0.1
0.1
0.01
0.2
3.2
1
14
13:36:45.98
-29:49:17.1
0.58
22.5
(-1.5)
0.50
-6.9
350
35
4.3
120
60
2.4
60
29
1.2
4
B1-2
0.1
0.30
1.2
5.3
5.4
3.3
3
15
13:36:46.06
-29:53:40.3
0.55
20.4
-0.4
0.22
-8.5
20
55
7.2
20
30
2.9
1
D3,B4
0.1
0.1
0.02
0.2
2.0
4.9
0
16
13:36:47.53
-29:53:47.3
0.52
22.0
(-0.8)
0.56
-7.4
150
40
5.6
90
30
3.0
2
D2
0.1
0.01
0.2
6.0
3.2
0
17
13:36:47.78
-29:51:25.9
0.41
18.0c
-0.3
0.25
-9.7
5
20
1.9
2
40
9.5
3
40
6.1
6
B4
0.1
0.2
0.05
0.3
4.4
3.4
2.3
2
18
13:36:47.92
-29:51:30.3
0.41
21.3
(-1.9)
0.45
(-7.1)
500
40
1.6
245
60
5.1
230
40
4.8
6
B1
0.1
0.05
3.9
5.6
4.7
1
19
13:36:48.08
-29:51:32.4
0.40
22.0
-0.8
0.30
-6.9
40
25
2.4
10
30
5.8
15
25
5.1
1
D1
0.1
0.1
0.03
0.2
1.3
1.2
9.5
1
20
13:36:48.50
-29:51:52.4
0.39
22.0
(-1.1)
0.35
-7.0
150
20
4.8
75
25
1.7
60
30
1.2
2
D1
0.0
0.05
0.3
1.4
1.3
1.4
0
a) He ii PSF or spectroscopic photometry was unavailable and the average slit loss correction factor has been assumed, b) the average E(B–V) value has been assumed, c) photometry corresponds to a lower limit as the region is extended.
Table A1. (continued)
Cat
RA
Dec
DeV
C iii 4650/He ii 4686
C iii 5696
C iv 5808
WN
WC
MOS
#
J2000
mag
mag
mag
mag
FWHM
FWHM
FWHM
2–5
6–10
4–6
7
8–9
Mask
21
13:36:48.54
-29:51:11.4
0.39
21.9
-0.6
0.20
-6.7
70
30
4.7
45
45
2.0
45
25
1.6
1
D2
0.0
0.1
0.05
0.3
8.7
1.0
4.1
1
22
13:36:48.90
-29:51:44.2
0.37
22.2
(-1.5)
0.19
-5.7
350
45
4.8
4
B1
0.1
0.04
0.2
4.7
1
23
13:36:49.22
-29:50:56.4
0.38
18.8
-0.1
0.31
-10.4
10
65
1.1
4
30
4.1
1
B3
0.1
0.1
0.02
0.2
2.0
1.2
0
24
13:36:49.28
-29:50:52.8
0.38
21.7
(-0.6)
0.50b
-7.9
100
30
6.3
70
45
3.0
25
30
1.0
4
B4
0.0
0.30
0.3
6.2
3.8
2.7
4
25
13:36:49.77
-29:51:19.8
0.35
19.7
-0.4
0.43
-10.2
4
10
20
6.1
4
D3
0.0
0.0
0.02
0.2
7.2
1
26
13:36:49.86
-29:52:10.0
0.35
19.7
-0.1
0.48
-10.3
3
25
2.4
2
B2
0.1
0.1
0.01
0.2
3.4
0
27
13:36:50.34
-29:52:13.6
0.33
21.2
(-1.0)
0.50b
(-8.0)
200
30
1.3
55
55
4.4
65
40
4.8
6
B1
0.1
0.30
3.5
7.5
5.7
8
28
13:36:50.41
-29:52:19.1
0.34
19.8c
0.1
0.50b
-11.1
10
25
5.0
10
30
4.5
8
D3
0.1
0.1
0.30
0.3
7.3
8.6
6
29
13:36:50.57
-29:52:58.6
0.37
20.8
(-0.1)
0.60
-9.4
15
40
3.2
3
15
6.0
10
45
1.2
1
D1
0.1
0.01
0.2
3.8
1.4
2.6
0
30
13:36:50.78
-29:54:46.4
0.54
(24.0)
0.50b
2000
30
4.4
500
50
1.3
1000
45
2.6
1
D1
0.30
6.3
2.7
2.4
1
31
13:36:50.87
-29:50:33.1
0.36
17.7c
-0.2
0.60
-12.4
6
10
40
3.2
4
50
2.4
2
30
7.1
42
B4
0.1
0.1
0.05
0.2
1.7
1.3
3.8
8
32
13:36:50.88
-29:50:07.4
0.39
20.9
(-0.8)
0.54
-9.0
120
40
1.5
110
70
8.2
90
45
6.2
12
B1
0.1
0.01
0.2
9.6
1.2
8.6
2
33
13:36:51.05
-29:52:37.0
0.33
20.4
-0.2
0.55
-9.7
2
10
8.1
1
B1
0.1
0.1
0.01
0.2
1.5
0
34
13:36:51.19
-29:50:11.2
0.38
20.2
-0.2
0.60
-10.4
7
5
35
2.4
7
40
1.8
7
45
1.5
3
B2
0.1
0.2
0.05
0.3
5.2
4.4
6.1
1
35
13:36:51.45
-29:53:12.9
0.36
20.6
(-0.1)
0.55
-9.5
15
55
4.3
14
D1
0.1
0.01
0.2
7.4
3
36
13:36:51.51
-29:53:13.3
0.36
20.6
0.2
0.60
-9.7
20
30
5.1
15
60
3.1
5
D2
0.1
0.1
0.01
0.2
1.3
6.1
1
37
13:36:52.20
-29:51:22.1
0.28
19.2c
-0.1
0.45
-10.4
10
30
1.0
10
25
3.5
4
D5
0.1
0.1
0.05
0.3
1.6
6.6
1
38
13:36:52.35
-29:53:15.2
0.34
16.9c
-0.8
0.78
-13.5
5
15
3.0
2
25
7.6
2
8.2
7
21
D4
0.1
0.1
0.01
0.2
8.2
1.9
2.1
2
6
39
13:36:52.59
-29:51:08.5
0.28
20.0
(-0.1)
0.47
(-9.8)
15
35
1.6
10
35
3.2
2
B2
0.1
0.02
2.5
3.2
1
40
13:36:52.61
-29:53:03.1
0.32
19.2
-0.2
0.42
-10.0
10
30
75
2.5
8
50
5.6
15
60
6.8
6
D3
0.1
0.1
0.02
0.2
2.4
1.5
1.1
2
a) He ii PSF or spectrscopic photometry was unavailable and the average slit loss correction factor has been assumed, b) the average E(B–V) value has been assumed, c) photometry corresponds to a lower limit as the region is extended.
Table A1. (continued)
Cat
RA
Dec
DeV
C iii 4650/He ii 4686
C iii 5696
C iv 5808
WN
WC
MOS
#
J2000
mag
mag
mag
mag
FWHM
FWHM
FWHM
2–5
6–10
4–6
7
8–9
Mask
41a
13:36:52.64
-29:51:47.5
0.26
Extended
0.52
12
5
20
1.5
2
30
1.4
2
45
1.9
14
13
B3
0.02
3.9
3.5
9.0
4
6
42a
13:36:52.86
-29:52:50.0
0.29
Extended
0.51
13
1
25
5.9
5
B3
0.01
2.5
2
43
13:36:52.89
-29:51:15.2
0.26
20.8
-0.1
0.50b
-9.1
15
15
2.9
3
B2
0.1
0.1
0.30
0.3
3.8
3
44
13:36:53.34
-29:51:30.0
0.24
18.4
-0.3
0.31
-10.9
16
5
10
1.2
5
D4
0.0
0.0
0.01
0.2
8.9
0
45
13:36:53.36
-29:51:52.9
0.23
22.4
-1.0
0.56
-7.7
10
20
3.6
1
B2
0.2
0.5
0.02
0.2
8.6
0
46
13:36:53.60
-29:52:52.8
0.28
22.1
(-0.7)
0.41
-7.6
100
35
2.4
350
75
2.7
200
35
9.1
3
B1
0.3
0.03
0.2
6.3
8.4
2.5
1
47
13:36:53.72
-29:51:31.2
0.23
21.6
(-0.4)
0.75
-8.4
50
45
4.1
20
40
1.1
1
D2
0.1
0.02
0.2
8.4
3.4
0
48
13:36:53.87
-29:51:03.0
0.24
20.2
(-1.3)
0.31
-8.6
210
65
3.2
44
B1
0.1
0.03
0.2
2.9
6
49
13:36:53.92
-29:48:49.6
0.48
18.2
-0.4
0.40
-11.5
19
10
30
2.7
7
35
1.3
5
30
9.2
13
B3
0.1
0.1
0.03
0.2
1.4
1
50
13:36:53.98
-29:51:05.3
0.24
19.2
-0.2
0.61
-11.1
14
35
6.5
8
D5
0.1
0.1
0.01
0.2
2.0
3
51
13:36:54.48
-29:55:55.0
0.62
21.8
-0.9
0.45
-8.2
30
20
1.6
1
C2-3
0.1
0.1
0.05
0.3
3.6
0
52
13:36:54.93
-29:55:35.1
0.57
21.5
(-0.2)
0.81
-10.0
20
65
2.2
18
D2
0.1
0.01
0.2
4.6
4
53
13:36:54.94
-29:55:54.7
0.62
22.0
(-1.6)
0.24
(-6.6)
350
25
8.5
220
50
3.6
190
35
2.9
2
D1
0.0
0.03
1.8
7.3
5.9
1
54
13:36:55.32
-29:49:47.8
0.34
21.8
(-1.2)
0.52
(-7.4)
100
30
6.9
135
45
4.1
100
30
1.7
6
B1,A5
0.1
0.03
1.5
5.9
4.0
1
55
13:36:55.43
-29:48:05.7
0.56
21.9
-0.9
0.76
-8.4
50
55
3.0
20
B1
0.0
0.1
0.02
0.2
6.0
4
56
13:36:55.81
-29:50:17.8
0.27
21.9
-1.6
0.59
-7.9
30
20
3.9
15
A3
0.1
0.6
0.01
0.3
4.6
2
57
13:36:56.00
-29:49:53.8
0.32
20.0c
(-0.5)
0.43
-9.7
24
40
30
1.3
9
A3,B2
0.1
0.01
0.2
1.1
2
58
13:36:56.20
-29:49:33.3
0.36
21.7
(-1.0)
0.50
(-7.4)
185
35
7.4
65
65
4.0
70
45
4.0
5
B1-2,A2
0.1
0.01
1.4
7.6
5.6
1
59
13:36:56.95
-29:52:48.0
0.18
20.0
-0.2
1.08
-12.5
25
4
10
2.1
14
B2,A3
0.1
0.1
0.01
0.2
2.7
2
60a
13:36:57.06
-29:50:19.2
0.25
(22.1)
(-0.2)
0.32
(-8.4)
20
45
4.0
6
A2
0.01
1.8
3
a) He ii PSF or spectroscopic photometry was unavailable and the average slit loss correction factor has been assumed, b) the average E(B–V) value has been assumed, c) photometry corresponds to a lower limit as the region is extended.
Table A1. (continued).
Cat
RA
Dec
DeV
C iii 4650/He ii 4686
C iii 5696
C iv 5808
WN
WC
MOS
#
J2000
mag
mag
mag
mag
FWHM
FWHM
FWHM
2–5
6–10
4–6
7
8–9
Mask
61
13:36:57.95
-29:52:55.0
0.17
18.6c
0.1
0.40
-11.7
4
30
8.3
2
30
3.0
2
50
4.1
2
D4
0.1
0.1
0.05
0.3
1.8
6.0
7.9
1
62
13:36:58.24
-29:48:16.4
0.53
19.8
-0.4
0.45
-9.9
20
50
7.6
10
70
3.6
15
50
3.7
4
B2
0.1
0.1
0.05
0.3
1.4
7.3
7.6
1
63
13:36:58.51
-29:55:19.9
0.50
22.1
(-0.7)
0.91
-9.1
85
30
3.9
30
50
1.2
35
40
1.5
5
D1,C1-3
0.1
0.08
0.4
4.5
1.8
1.9
2
64
13:36:58.72
-29:48:06.1
0.55
19.9
-0.3
0.59
27
15
40
8.1
10
B3,A3-4
0.1
0.1
0.01
2.3
3
65a
13:36:58.86
-29:50:11.9
0.25
Extended
0.42
45
30
7.3
25
45
3.5
25
60
2.9
4
A5
0.02
2.7
1.3
1.2
2
66
13:36:59.17
-29:54:27.0
0.37
17.3
-0.3
0.23
-11.4
29
5
30
2.3
3
50
7.2
3
50
8.9
8
4
D4
0.1
0.1
0.02
0.2
4.6
2.0
1.9
2
1
67
13:36:59.41
-29:54:23.1
0.36
21.1
(-0.6)
0.33
100
30
9.9
90
65
6.2
75
50
5.5
5
D2
0.0
0.02
1.2
1.3
1.1
1
68
13:36:59.95
-29:48:42.6
0.46
18.7c
-0.2
0.55
-11.6
32
10
80
1.7
2
35
2.5
3
30
4.0
3
B2
0.1
0.1
0.01
0.2
1.7
5.4
6.7
1
69
13:37:00.18
-29:55:39.9
0.54
22.5
(-0.6)
0.30
-6.0
70
20
2.4
145
25
2.7
50
40
9.3
2
D1
0.0
0.05
0.3
4.4
3.4
4.4
0
70
13:37:00.27
-29:48:04.0
0.56
20.4
-0.6
0.24
-8.4
30
35
1.5
9
40
3.3
10
40
3.4
2
A2,B2
0.1
0.1
0.01
0.2
9.4
6.1
7.0
0
71a
13:37:00.40
-29:54:13.2
0.33
22.1
(0.0)
0.50b
20
20
2.7
40
1.9
15
7.9
3
D1
0.1
0.30
8.6
6.6
3.5
3
72
13:37:00.41
-29:52:54.1
0.14
19.9
-0.2
0.02
-8.1
10
20
5.6
10
20
2.4
1
A1
0.1
0.2
0.02
0.2
7.5
3.6
73
13:37:01.18
-29:52:53.9
0.14
19.2
-0.3
0.21
-9.6
5
20
5.8
2
D5
0.1
0.1
0.02
0.2
9.7
0
74
13:37:01.42
-29:51:25.8
0.08
17.5c
-0.1
1.00
-14.2
35
5
20
1.0
6
40
3.5
2
40
1.4
52
179
B4
0.1
0.1
0.03
0.2
2.1
7.1
2.9
12
42
75
13:37:02.49
-29:48:27.4
0.51
22.3
(-1.3)
0.25
(-5.7)
375
60
6.1
100
30
7.2
250
60
2.6
1
A2,B1
0.1
0.05
8.1
2.1
2.8
0
76
13:37:02.56
-29:50:37.4
0.20
22.1
(-1.1)
0.20
(-5.8)
100
30
2.9
1
A2,B2
0.0
0.04
2.9
0
77
13:37:02.84
-29:49:15.3
0.40
22.1
(-0.4)
0.60
(-8.1)
45
20
2.3
25
45
9.2
25
35
7.9
2
A5
0.1
0.05
2.1
2.4
2.1
0
78
13:37:03.06
-29:50:49.5
0.18
17.9c
-0.3
0.35
-11.4
38
3
15
1.1
6
35
1.2
2
35
5.0
11
B4
0.1
0.1
0.05
0.1
2.1
1.3
1.7
2
79a
13:37:03.10
-29:54:26.2
0.36
(22.8)
(-0.7)
0.58
(-8.3)
100
35
6.2
70
50
3.2
50
30
1.7
5
C1
0.1
0.02
3.3
1.4
8.5
2
80
13:37:03.83
-29:55:29.8
0.51
21.7
-0.6
0.39
0
0
2.1
1
C2-3
0.0
0.1
0.01
4.1
0
a) He ii PSF or spectroscopic photometry was unavailable and the average slit loss correction factor has been assumed, b) the average E(B–V) value has been assumed, c) photometry corresponds to a lower limit as the region is extended.
Table A1. (continued)
Cat
RA
Dec
DeV
C iii 4650/He ii 4686
C iii 5696
C iv 5808
WN
WC
MOS
#
J2000
mag
mag
mag
mag
FWHM
FWHM
FWHM
2–5
6–10
4–6
7
8–9
Mask
81
13:37:03.88
-29:54:31.1
0.37
21.6
-1.2
0.40
-7.7
No Data
130
40
3.4
35
30
9.1
3
D1
0.0
0.1
0.05
0.3
1.4
1.2
1
82
13:37:03.97
-29:52:47.5
0.15
20.2
-0.8
0.24
-8.6
45
30
1.2
30
40
6.0
20
30
3.2
4
A2,C3
0.0
0.0
0.04
0.2
8.3
3.3
2.6
1
83
13:37:04.39
-29:48:26.9
0.52
21.0
-0.6
0.40
-8.6
25
30
4.1
20
45
1.8
5
15
5.7
2
A5
0.1
0.1
0.01
0.2
3.1
4.6
1.3
1
84
13:37:04.56
-29:49:21.8
0.40
20.8
(-0.8)
0.40
(-8.2)
43
475
45
1.5
70
20
8.6
30
5.7
9
A3
0.1
0.05
5.3
2.5
1.5
3
85
13:37:04.58
-29:54:17.1
0.35
21.9
(-1.2)
0.20
(-6.0)
270
20
6.7
110
30
6.8
50
35
4.5
4
C1
0.1
0.05
1.3
1.4
8.6
1
86a
13:37:04.65
-29:50:58.4
0.19
16.2c
(-0.0)
0.32
-13.1
42
2
20
2.0
2
30
2.9
9
24
B4
0.04
0.2
8.5
1.1
4
10
87
13:37:05.34
-29:48:20.4
0.55
20.0
-0.2
0.36
-9.5
25
80
1.2
20
80
7.3
3
A4
0.1
0.1
0.01
0.2
2.0
2.1
1
88
13:37:05.53
-29:48:19.9
0.55
21.9
(-0.6)
0.22
(-6.8)
60
20
3.2
60
30
1.3
60
25
1.0
1
A5
0.2
0.03
3.2
2.6
2.4
0
89
13:37:05.74
-29:53:41.2
0.28
21.3
(-0.4)
0.50b
(-8.4)
44
55
35
6.5
20
30
1.7
3
C1
0.1
0.30
1.6
6.1
4.1
4
90
13:37:06.10
-29:53:43.5
0.29
20.4
(-0.1)
0.32
44
10
55
3.4
8
65
1.8
4
45
1.4
2
C3
0.2
0.02
5.1
3.8
9.8
0
91
13:37:06.36
-29:49:03.7
0.46
20.9
-0.5
0.43
-8.4
15
40
4.9
15
40
2.6
3
A3
0.1
0.1
0.01
0.2
1.2
6.5
1
92
13:37:06.60
-29:54:51.6
0.44
21.8
(-1.7)
0.31
(-6.4)
600
45
1.0
250
70
3.5
150
40
3.8
3
C1
0.1
0.01
3.5
7.4
7.2
1
93a
13:37:06.62
-29:56:48.2
0.71
(23.8)
(-1.9)
0.50b
(-5.8)
450
30
3.4
10
C1
0.30
1.3
8
94a
13:37:07.10
-29:50:25.2
0.31
(19.2)
(-0.1)
0.36
(-11.7)
5
25
1.4
23
A1
0.01
7.0
12
95
13:37:07.35
-29:49:39.2
0.40
21.9
(-0.4)
0.40
(-10.4)
15
15
1.2
1
A1
0.1
0.02
1.3
0
96
13:37:07.54
-29:52:53.6
0.24
19.3
0.0
0.27
-9.9
4
30
3.9
2
C2
0.2
0.2
0.02
0.2
9.9
1
97a
13:37:07.55
-29:51:06.3
0.25
(20.1)
(-0.0)
0.67
46
2
15
3.3
5
A5
0.01
1.5
2
98
13:37:07.58
-29:54:11.2
0.37
19.9
-0.3
0.30
-9.4
20
30
9.7
15
45
5.4
15
35
3.2
4
C2
0.0
0.1
0.05
0.3
1.4
4.9
3.7
1
99
13:37:07.96
-29:52:07.9
0.22
20.9
(-0.2)
0.28
(-8.0)
20
30
2.8
1
A3,C2
0.1
0.03
9.7
0
100
13:37:08.25
-29:51:13.6
0.27
20.6
-0.7
0.63
-10.2
15
25
3.6
5
C2
0.1
0.1
0.02
0.2
9.7
1
a) He ii PSF or spectroscopic photometry was unavailable and the average slit loss correction factor has been assumed, b) the average E(B–V) value has been assumed, c) photometry corresponds to a lower limit as the region is extended.
Table A1. (continued).
Cat
RA
Dec
DeV
C iii 4650/He ii 4686
C iii 5696
C iv 5808
WN
WC
MOS
#
J2000
mag
mag
mag
mag
FWHM
FWHM
FWHM
2–5
6–10
4–6
7
8–9
Mask
101a
13:37:08.25
-29:53:30.5
0.31
(22.5)
(-0.3)
0.55
(-8.7)
30
40
3.3
11
C1
0.05
1.0
5
102
13:37:08.40
-29:52:54.9
0.27
18.1
-1.0
0.34
-11.1
48
6
40
1.8
9
A4,C3
0.1
0.2
0.01
0.2
3.1
2
103
13:37:08.53
-29:52:12.0
0.24
18.7
-0.3
0.78
-13.2
49
6
40
1.2
29
A4,C3
0.0
0.1
0.02
0.2
3.3
9
104
13:37:08.55
-29:49:06.5
0.49
19.7
-0.6
0.36
-9.4
30
40
1.8
10
40
3.6
3
A4
0.1
0.1
0.01
0.2
5.0
8.3
1
105
13:37:08.70
-29:52:28.9
0.25
17.5
-0.4
0.39
-12.1
50
6
45
1.4
8
A4
0.1
0.1
0.01
0.2
4.6
3
106
13:37:08.91
-29:52:05.7
0.26
20.7
(-0.1)
0.50b
(-9.3)
20
40
5.2
20
50
3.5
15
50
2.9
6
C1
0.1
0.30
8.0
8.0
6.7
5
107a
13:37:09.02
-29:52:45.2
0.28
21.5
0.50b
0
40
4.6
15
C1
0.1
0.30
1.5
10
108
13:37:09.80
-29:52:36.2
0.29
20.3
-0.5
0.35
-9.3
10
20
3.2
2
A3
0.1
0.1
0.01
0.2
3.4
1
109
13:37:10.42
-29:51:28.0
0.32
19.9
-0.7
0.00
-8.0
105
30
3.3
110
50
2.1
40
35
7.9
7
C2
0.1
0.2
0.03
0.2
5.6
2.5
1.5
1
110a
13:37:10.77
-29:50:56.6
0.36
(22.7)
(-0.4)
0.31
(-7.6)
45
30
4.1
65
30
4.2
20
25
1.3
3
A2
0.05
1.5
1.3
6.9
1
111
13:37:10.87
-29:54:22.2
0.45
20.1
-0.3
0.30
-9.3
10
30
4.8
3
C2-3
0.1
0.1
0.02
0.2
7.6
1
112
13:37:11.03
-29:49:49.1
0.46
20.8
(-0.1)
0.12
45
30
1.1
15
45
3.5
20
40
3.6
2
A2
0.1
0.02
1.8
1.2
9.4
1
113
13:37:11.03
-29:55:43.7
0.61
21.9
(-0.8)
0.50b
-6.2
100
40
4.9
70
¡60
2.7
5
C1
0.1
0.30
1.2
5.3
5.6
6
114
13:37:11.11
-29:48:24.1
0.63
22.4
(-1.4)
0.30
(-8.6)
170
0
3.0
4
A1
0.0
0.10
2.4
2
115
13:37:11.24
-29:49:42.0
0.48
20.9
-0.1
0.50b
-9.0
20
40
4.0
20
35
2.6
10
30
1.3
4
A5
0.1
0.1
0.30
1.2
4.4
4.9
3.9
1
116
13:37:11.46
-29:49:52.9
0.47
17.1
-0.5
0.39
-12.4
57
3
0
2.0
12
A4
0.1
0.1
0.01
0.2
3.3
2
117
13:37:11.67
-29:49:18.1
0.53
22.5
(-0.1)
58
No Data
1
A2
0.1
118
13:37:12.37
-29:50:21.6
0.45
19.2c
(-0.1)
0.38
-10.2
10
35
9.3
10
40
6.3
6
A1
0.1
0.01
0.2
1.3
1.5
1
119
13:37:12.45
-29:52:03.7
0.37
21.2
-0.6
0.35
-8.3
25
2
3.8
30
25
2.7
2
A1
0.0
0.0
0.01
0.2
5.5
1.8
0
120
13:37:12.58
-29:51:07.0
0.40
21.8
(-1.2)
0.17
-5.9
230
65
7.5
6
A3,C1
0.0
0.02
0.2
4.7
0
a) He ii PSF of spectroscopic photometry was unavailable and the average slit loss correction factor has been assumed, b) the average E(B–V) value has been assumed, c) photometry corresponds to a lower limit as the region is extended.
Table A1. (continued)
Cat
RA
Dec
DeV
C iii 4650/He ii 4686
C iii 5696
C iv 5808
WN
WC
MOS
#
J2000
mag
mag
mag
mag
FWHM
FWHM
FWHM
2–5
6–10
4–6
7
8–9
Mask
121
13:37:12.64
-29:49:50.1
0.50
21.1
(-1.1)
0.46
-8.2
7.1
17
A1
0.1
0.02
0.2
7.9
2
122
13:37:12.68
-29:54:47.4
0.53
20.8
-1.0
0.40
-8.3
100
57
1.4
50
60
7.0
3
C2-3
0.0
0.0
0.01
0.2
1.1
1.4
1
123a
13:37:13.05
-29:51:37.7
0.39
(21.5)
(0.0)
0.40
(-9.5)
15
27
5.7
6
25
1.5
2
A4
0.01
1.8
6.9
2
124a
13:37:15.50
-29:52:26.7
0.46
21.2
-0.6
0.41
-8.4
No Data
30
50
3.2
16
35
1.3
3
A5,C2
0.1
0.1
0.01
0.2
1.2
5.9
1
125
13:37:16.29
-29:53:09.8
0.51
21.4
(-0.7)
0.39
(-7.6)
115
27
8.5
60
45
2.9
35
45
3.0
3
C1
0.1
0.03
7.7
5.7
5.4
1
126a
13:37:16.33
-29:50:56.4
0.52
20.7
(-0.4)
0.20
(-10.3)
45
40
8.4
20
45
3.8
1
A1
0.1
0.05
2.4
1.4
0
127a
13:37:16.93
-29:50:43.5
0.55
(20.7)
(-0.9)
0.00
(-8.0)
130
28
4.9
135
35
1.8
3
A1,A3
0.05
1.4
6.7
1
128
13:37:17.18
-29:51:28.0
0.53
21.1c
(-0.3)
0.30
-7.9
40
25
4.5
30
40
2.3
20
30
1.3
2
A1-2
0.1
0.05
0.3
2.6
2.1
1.7
0
129
13:37:17.52
-29:51:25.2
0.54
19.7
-0.3
0.70
-11.0
15
0
1.0
8
45
3.7
4
A3
0.0
0.1
0.05
0.3
3.8
9.2
1
130
13:37:18.08
-29:48:04.5
0.81
23.0
(-1.5)
0.15
-4.9
215
25
1.8
1
A1
0.0
0.02
0.2
1.8
0
131
13:37:18.63
-29:51:41.3
0.57
22.1
(-1.9)
0.00
530
25
6.2
525
50
2.8
440
55
2.3
1
A1
0.0
0.05
4.3
3.5
3.5
0
132
13:37:23.66
-29:48:53.8
0.88
22.2
(-0.4)
0.56
(-8.1)
30
30
1.5
1
A2
0.1
0.04
4.1
0
a) He ii PSF or spectrscopic photometry was unavailable and the average slit loss correction factor has been assumed, b) the average E(B–V) value has been assumed, c) photometry corresponds to a lower limit as the region is extended.
Table A2. Catalogue of sources with candidate WR
signatures in M 83, either from narrow-band imaging or for which MOS spectroscopy was ambiguous.
| Cat | RA | Dec | Dev | Cat | RA | Dec | Dev | ||||||
|---|---|---|---|---|---|---|---|---|---|---|---|---|---|
| J2000 | J2000 | J2000 | J2000 | ||||||||||
| 133 | 13:36:44.01 | –29:51:47.1 | 0.53 | – | – | 178 | 13:37:01.25 | –29:52:52.8 | 0.13 | 19.2 | –0.2 | ||
| 134 | 13:36:44.02 | –29:52:26.5 | 0.54 | 21.7 | – | 179 | 13:37:01.91 | –29:52:13.2 | 0.05 | – | – | ||
| 135 | 13:36:44.48 | –29:52:10.5 | 0.52 | – | – | 180l | 13:37:02.04 | –29:55:30.2 | 0.51 | 16.9 | –0.3 | 36 | |
| 136 | 13:36:44.51 | –29:53:22.1 | 0.57 | 19.2 | –0.2 | 181 | 13:37:02.19 | –29:57:20.2 | 0.77 | 20.6 | –0.2 | ||
| 137 | 13:36:44.55 | –29:52:10.0 | 0.52 | – | – | 182 | 13:37:02.24 | –29:55:33.8 | 0.52 | 19.9 | –0.3 | ||
| 138 | 13:36:46.05 | –29:52:49.7 | 0.49 | 19.9 | –0.2 | 183 | 13:37:02.64 | –29:49:40.8 | 0.34 | 18.0 | –0.4 | 39 | |
| 139 | 13:36:48.07 | –29:53:11.3 | 0.45 | 19.2 | –0.1 | 184 | 13:37:02.84 | –29:54:05.5 | 0.31 | 21.2 | – | ||
| 140 | 13:36:48.29 | –29:52:44.9 | 0.42 | 19.9 | 0.1 | 185 | 13:37:02.90 | –29:50:50.8 | 0.18 | 18.0 | –0.4 | 38 | |
| 141 | 13:36:49.35 | –29:55:28.4 | 0.65 | 21.2 | –0.2 | 186p | 13:37:03.00 | –29:49:44.4 | 0.33 | – | – | 39 | |
| 142 | 13:36:49.63 | –29:51:19.5 | 0.36 | 21.4 | –0.5 | 5 | 187 | 13:37:03.01 | –29:48:38.8 | 0.48 | 20.1 | –0.5 | |
| 143 | 13:36:49.74 | –29:50:15.9 | 0.41 | – | – | 188l | 13:37:03.20 | –29:55:23.5 | 0.49 | 19.3 | –0.1 | ||
| 144 | 13:36:50.05 | –29:52:14.6 | 0.35 | 17.7 | –0.2 | 189l | 13:37:03.38 | –29:51:00.3 | 0.16 | 18.9 | –0.3 | ||
| 145p | 13:36:50.72 | –29:54:05.1 | 0.46 | 17.8 | –0.5 | 190 | 13:37:03.44 | –29:51:02.9 | 0.16 | 17.3c | –0.3 | 41 | |
| 146 | 13:36:51.06 | –29:50:39.4 | 0.35 | – | – | 191 | 13:37:03.79 | –29:54:14.3 | 0.33 | – | – | ||
| 147 | 13:36:51.34 | –29:50:10.2 | 0.38 | 18.1c | –0.6 | 192 | 13:37:04.08 | –29:53:54.7 | 0.29 | 19.1 | –0.1 | ||
| 148p | 13:36:52.11 | –29:52:35.2 | 0.30 | – | – | 9 | 193l | 13:37:04.20 | –29:55:29.1 | 0.51 | 19.6 | 0.0 | |
| 149 | 13:36:52.14 | –29:51:20.4 | 0.28 | – | – | 194l | 13:37:04.81 | –29:49:24.8 | 0.40 | 17.6 | 0.3 | 43 | |
| 150 | 13:36:52.46 | –29:52:48.7 | 0.30 | 19.6 | – | 195 | 13:37:05.07 | –29:50:59.0 | 0.20 | – | – | ||
| 151 | 13:36:52.53 | –29:52:43.9 | 0.29 | – | – | 196 | 13:37:06.62 | –29:50:51.4 | 0.25 | 19.5 | –0.3 | ||
| 152 | 13:36:52.54 | –29:51:09.5 | 0.28 | 19.4 | –0.2 | 14 | 197 | 13:37:07.19 | –29:51:28.1 | 0.22 | 18.1 | –0.1 | |
| 153 | 13:36:52.82 | –29:51:15.8 | 0.26 | – | – | 198 | 13:37:07.62 | –29:52:51.4 | 0.24 | 17.1 | –0.6 | ||
| 154 | 13:36:53.02 | –29:52:28.6 | 0.26 | 20.0 | –0.2 | 199 | 13:37:07.68 | –29:49:13.9 | 0.46 | 19.3 | –0.2 | ||
| 155 | 13:36:53.08 | –29:55:48.8 | 0.63 | – | – | 200p | 13:37:07.71 | –29:51:14.9 | 0.25 | 19.7 | –0.3 | ||
| 156 | 13:36:53.21 | –29:52:58.5 | 0.29 | 17.3 | –0.3 | 201 | 13:37:07.76 | –29:49:18.1 | 0.46 | 22.1 | – | ||
| 157 | 13:36:53.21 | –29:51:30.7 | 0.24 | 18.9 | –0.2 | 16 | 202 | 13:37:08.26 | –29:54:01.7 | 0.36 | – | – | |
| 158 | 13:36:53.31 | –29:49:55.9 | 0.36 | 22.1 | – | 203 | 13:37:09.01 | –29:50:07.6 | 0.38 | 18.7 | –0.2 | ||
| 159 | 13:36:53.34 | –29:53:25.8 | 0.33 | – | – | 204 | 13:37:09.15 | –29:49:20.6 | 0.48 | – | – | ||
| 160 | 13:36:54.90 | –29:53:09.4 | 0.27 | – | – | 22 | 205 | 13:37:09.18 | –29:51:10.1 | 0.30 | – | – | |
| 161 | 13:36:55.06 | –29:48:49.0 | 0.47 | 22.1 | – | 206 | 13:37:09.31 | –29:51:50.6 | 0.27 | 17.8 | –0.2 | ||
| 162 | 13:36:55.15 | –29:49:50.5 | 0.34 | 23.2 | – | 207 | 13:37:09.38 | –29:52:20.0 | 0.27 | 19.2 | 0.1 | ||
| 163 | 13:36:55.20 | –29:52:13.6 | 0.18 | – | – | 208 | 13:37:09.48 | –29:52:22.2 | 0.28 | 20.6 | –0.5 | ||
| 164 | 13:36:55.31 | –29:48:10.0 | 0.55 | 22.7 | –0.6 | 209l | 13:37:09.48 | –29:52:38.1 | 0.28 | 23.3 | – | ||
| 165p | 13:36:55.61 | –29:54:15.5 | 0.38 | 17.6 | –0.4 | 210 | 13:37:09.63 | –29:49:56.4 | 0.42 | – | – | ||
| 166 | 13:36:55.71 | –29:55:40.3 | 0.57 | – | – | 211 | 13:37:09.67 | –29:49:01.7 | 0.52 | – | – | ||
| 167 | 13:36:55.85 | –29:47:47.5 | 0.60 | – | – | 212 | 13:37:09.75 | –29:49:08.0 | 0.51 | – | – | ||
| 168 | 13:36:56.06 | –29:52:52.5 | 0.21 | – | – | 213 | 13:37:09.87 | –29:50:10.5 | 0.40 | 20.0 | –0.3 | ||
| 169 | 13:36:56.32 | –29:54:55.6 | 0.46 | – | – | 214 | 13:37:10.02 | –29:49:13.4 | 0.51 | 18.9 | –0.4 | ||
| 170 | 13:36:56.75 | –29:52:12.7 | 0.14 | – | – | 215 | 13:37:10.88 | –29:49:54.7 | 0.45 | – | – | ||
| 171 | 13:36:56.87 | –29:52:48.7 | 0.18 | 20.0 | –0.3 | 216 | 13:37:12.01 | –29:51:48.3 | 0.36 | – | – | ||
| 172p | 13:36:57.14 | –29:54:49.2 | 0.44 | 19.1 | –0.2 | 217 | 13:37:12.60 | –29:55:37.9 | 0.62 | 23.1 | – | ||
| 173 | 13:36:57.23 | –29:51:26.3 | 0.13 | 19.3 | –0.3 | 218 | 13:37:16.07 | –29:50:56.4 | 0.52 | – | – | ||
| 174p | 13:36:58.55 | –29:48:12.0 | 0.54 | 21.6 | –0.6 | 219 | 13:37:16.37 | –29:50:59.2 | 0.52 | 20.2 | –0.3 | ||
| 175 | 13:36:58.95 | –29:51:26.5 | 0.09 | 19.3c | –0.3 | 28 | 220 | 13:37:16.69 | –29:50:54.5 | 0.54 | 20.9 | –0.2 | |
| 176 | 13:37:00.64 | –29:54:23.0 | 0.35 | 20.9 | – | 221 | 13:37:24.08 | –29:48:52.6 | 0.89 | 23.2 | – | ||
| 177 | 13:37:01.19 | –29:52:52.3 | 0.13 | 19.6 | –0.2 |
Insufficient S/N for classification,
insufficient spectral coverage for WN identification, c) photometry corresponds to a lower limit as the region is extended.
![[Uncaptioned image]](/html/astro-ph/0506343/assets/x17.png)
Fig. B1: Master finding chart, indicating location of confirmed WR sources in M 83 (+) and corresponding finding chart. North is up and east to the left on this 4684 narrow-band FORS2 image of M 83 (1212 arcmin).
![[Uncaptioned image]](/html/astro-ph/0506343/assets/x18.png)
Fig. B2: Finding chart 1. North is up and east to the left on this 4684 narrow-band FORS2 image, with the scale indicated.
![[Uncaptioned image]](/html/astro-ph/0506343/assets/x19.png)
Fig. B3: Finding chart 2. North is up and east to the left on this 4684 narrow-band FORS2 image, with the scale indicated. The FORS2 CCD detector gap runs along the bottom of the image.
![[Uncaptioned image]](/html/astro-ph/0506343/assets/x20.png)
Fig. B4: Finding chart 3. North is up and east to the left on this 4684 narrow-band FORS2 image, with the scale indicated.
![[Uncaptioned image]](/html/astro-ph/0506343/assets/x21.png)
Fig. B5: Finding chart 4. North is up and east to the left on this 4684 narrow-band FORS2 image, with the scale indicated.
![[Uncaptioned image]](/html/astro-ph/0506343/assets/x22.png)
Fig. B6: Finding chart 5. North is up and east to the left on this 4684 narrow-band FORS2 image, with the scale indicated.
![[Uncaptioned image]](/html/astro-ph/0506343/assets/x23.png)
Fig. B7: Finding chart 6. North is up and east to the left on this 4684 narrow-band FORS2 image, with the scale indicated.
![[Uncaptioned image]](/html/astro-ph/0506343/assets/x24.png)
Fig. B8: Finding chart 7. North is up and east to the left on this 4684 narrow-band FORS2 image, with the scale indicated.
![[Uncaptioned image]](/html/astro-ph/0506343/assets/x25.png)
Fig. B9: Finding chart 8. North is up and east to the left on this 4684 narrow-band FORS2 image, with the scale indicated.
![[Uncaptioned image]](/html/astro-ph/0506343/assets/x26.png)
Fig. B10: Finding chart 9. North is up and east to the left on this 4684 narrow-band FORS2 image, with the scale indicated.
![[Uncaptioned image]](/html/astro-ph/0506343/assets/x27.png)
Fig. B11: Finding chart 10. North is up and east to the left on this 4684 narrow-band FORS2 image, with the scale indicated.
![[Uncaptioned image]](/html/astro-ph/0506343/assets/x28.png)
Fig. B12: Finding chart 11. North is up and east to the left on this 4684 narrow-band FORS2 image, with the scale indicated.
![[Uncaptioned image]](/html/astro-ph/0506343/assets/x29.png)
Fig. B13: Finding chart 12. North is up and east to the left on this 4684 narrow-band FORS2 image, with the scale indicated. The feature on the west side of the image is a chip defect.
![[Uncaptioned image]](/html/astro-ph/0506343/assets/x30.png)
Fig. B14: Finding chart 13. North is up and east to the left on this 4684 narrow-band FORS2 image, with the scale indicated. The FORS2 CCD detector gap runs along the centre of the image.
![[Uncaptioned image]](/html/astro-ph/0506343/assets/x31.png)
Fig. B15: Finding chart 14. North is up and east to the left on this 4684 narrow-band FORS2 image, with the scale indicated.
![[Uncaptioned image]](/html/astro-ph/0506343/assets/x32.png)
Fig. B16: Finding chart 15. North is up and east to the left on this 4684 narrow-band FORS2 image, with the scale indicated. The FORS2 CCD detector gap runs along the top of the image.
![[Uncaptioned image]](/html/astro-ph/0506343/assets/x33.png)
Fig. B17: Finding chart 16. North is up and east to the left on this 4684 narrow-band FORS2 image, with the scale indicated. The bright feature in the north west corner of the image is a chip defect.