A comparative analysis of empirical calibrators for nebular metallicity
Abstract
We present a new analysis of the main empirical calibrators of oxygen abundance for ionised gas nebulae. With that aim we have compiled an extensive sample of objects with emission line data including the near IR [SIII] lines and the weak auroral lines which allow for the determination of the gas electron temperature. For all the objects the oxygen abundances have been derived in a homogeneus way, using the most recent sets of atomic coefficients and taking into the account the effect of particle density on the temperature of O+. The residuals between directly and empirically-derived abundances as a function of abundance have been studied. A grid of photo-ionisation models, covering the range of physical properties of the gas, has been used to explain the origin of the uncertainties affecting each abundance calibrator. The range of validity for each abundance parameter has been identified and its average uncertainty has been quantified.
keywords:
ISM: abundances – HII regions: abundances1 Introduction
HII regions, from diffuse HII regions in the Galaxy to Extragalactic HII Regions (GEHR) as well as HII Galaxies, have been for many years, the main source of information about metallicity in distant galaxies. Their bright emission line spectra are visible in all kinds of objects where there are recent episodes of star formation. The analysis of these nebular spectra constitutes the best method, if not the only one, for the determination of the chemical abundances of elements such as: He, N, O, Ne, Ar, S having optical emission lines corresponding to different ionization states. An accurate knowledge of these abundances is essential for a complete understanding of the evolution of stars and stellar systems and has allowed some light to be shed on several questions concerning the chemical evolution of galaxies in the Local Universe. They are now becoming even more relevant with the regard to the younger Universe.
Recombination lines yield the most accurate abundances because of their weak dependence on nebular temperature. In fact, helium abundances can be derived to an accuracy better than 5 %. Unfortunately, most of the observed emission lines in ionised nebulae are collisionally excited and their intensities depend exponentially on temperature. In principle, this temperature can be determined from appropriate line ratios, the most widely used being that of [OIII] Å/ Å Å) although, recently, the improved sensitivity of new detectors in larger telescopes allows for the measurement of other auroral lines, which are less temperature sensitive (Kinkel & Rosa 1994; Castellanos, Díaz & Terlevich 2002; hereinafter CDT02).
All these ratios involve the detection and measurement of one intrinsically weak line which in many objects is too faint to be observed. This is the case for regions with high metal content – where the efficient cooling exerted by metallic ions renders weak lines undetectable –, HII regions in distant galaxies and objects with low surface brightness. In these cases, empirical methods based on the intensities of strong, easily observable, optical lines have been developed and are nowadays widely used.
The so called “empirical methods” are based on the cooling properties of ionised nebulae which ultimately translate into a relationship between emission line intensities and oxygen abundance. In fact, when the cooling is dominated by oxygen, the electron temperature depends inversely on oxygen abundance. Since the intensities of collisionally excited lines depend exponentially on electron temperature, a relation is expected to exist between these intensities and oxygen abundances.
According to Pagel et al. (1979), under the assumptions that a) the nebula is ionisation bounded, b) the region can be represented by small clumps of gas with a given electron density surrounded by a much less dense material, so that the degree of ionisation is proportional to ( where is the clump electron density, is the number of hydrogen ionising photons and is the filling factor and c) the cooling is fixed by oxygen abundance, we can consider that the emission line spectrum of the nebula will depend on: the energy distribution of the ionising radiation field, the ionisation parameter and the oxygen abundance . Therefore, if a single relation between the chosen calibrator and the oxygen abundance is sought, further assumptions are needed implying that either the hardness of the radiation field or the degree of ionisation or both depend on oxygen abundance.
Following these ideas, several abundance calibrators have been proposed involving different emission line ratios: among others, [OIII] 5007 Å/H (Jensen, Strom & Strom 1976; [OIII] 5007 Å/ [NII] 6584 Å(Alloin et al. 1979) and ([OII] 3727 Å + [OIII] 5007 Å)/ H (R23; Pagel et al. 1979) . The advantages and drawbacks of the different calibrators have been discussed by several authors (see Pagel, Edmunds & Smith 1980; Kennicutt & Garnett 1996; Kewly & Dopita 2002). Although abundances derived through the use of these calibrations are recognised to suffer from considerable uncertainties, they are still believed by many authors to trace large-scale trends in galaxies. Empirical methods have been used to derive abundances in objects as different as dwarf irregular galaxies (e.g. Skillman, Kennicutt & Hodge 1989), individual HII regions in spiral galaxies (e.g. Oey & Kennicutt 1993), low surface brightness galaxies (McGaugh 1994), nuclear starbursts (e.g. Storchi-Bergmann, Calzetti & Kinney 1994) and even active galactic nuclei (Storchi-Bergmann et al. 1998). They have also been employed in the derivation of abundance distributions in the discs of spiral galaxies (e.g. Belley & Roy 1992; van Zee et al. 1998) and emission line galaxies at intermediate redshift (e.g. Kobulnicky & Kewley 2004)
In this work we perform a comparative analysis of the principal empirical calibrations of abundances which are based on the intensities of the nebular lines of oxygen, nitrogen and sulphur, visible in the optical and far red spectral regions. All these calibrations present a considerable scatter, usually larger than that associated with observational errors and probably related to the assumptions mentioned above. The aim of our work is to understand the reasons for this scatter and, whenever possible, to find ways of improving the empirical derivation of abundances.
In order to do that, we have compiled a large sample of emission line objects (HII galaxies, GEHR and diffuse HII regions in the Galaxy and the Local Group) with a direct determination of the total oxygen abundance through the measurement of the auroral lines of [OIII]4363 Å, [OII] 7327 Å or [SIII]6312 Å and we have constructed a complete sequence of photo-ionisation models, covering the main physical properties of these objects.
In the next section we describe the sample of objects and the process of determination of the oxygen abundance. In Section 3 , we summarize the main properties of the photoionisation models used for our analysis which is then presented in Section 4. Finally, Section 5 summarizes our results and the main conclusions reached.
| Reference111Those references marked with an ∗, give fluxes of the emission lines of [SIII] in the near IR | Object type222GEHR denotes Giant Extragalactic HII Regions, HIIG, HII Galaxies and DRH, Diffuse HII Regions | Númber of points |
| Castellanos et al., 2002∗ | GEHR | 5 |
| Dennefeld & Stasińska∗, 1983 | DHRs | 22 |
| Díaz et al., 1987∗ | GEHRs in NGC604 | 6 |
| Dinerstein & Shields, 1986 | GEHRs | 2 |
| Edmunds & Pagel, 1984 | GEHRs in NGC7793 | 3 |
| French, 1980 | HIIGs | 13 |
| Garnett & Kennicutt, 1994∗ | GEHR in M101 | 1 |
| Garnett et al., 2004∗ | GEHRs in M51 | 2 |
| Garnett et al., 1997∗ | GEHRs in NGC2403 | 11 |
| González-Delgado et al., 1994∗ | GEHR in NGC2363 | 13 |
| González-Delgado et al., 1995∗ | GEHRs in NGC7714 | 5 |
| Guseva et al., 2000 | HIIGs | 4 |
| Kennicutt, Bresolin & Garnett, 2003∗ | GEHRs in M101 | 19 |
| Kinkel & Rosa, 1994∗ | S5 in M101 | 1 |
| Kniazev et al., 2001 | HIIGs | 2 |
| Kunth & Sargent, 1983 | HIIGs | 13 |
| Kwitter & Aller, 1981 | GEHRs in M33 | 5 |
| Izotov, Thuan & Lipovetsky, 1994 | HIIGs | 10 |
| Izotov, Thuan & Lipovetsky, 1997 | HIIGs | 27 |
| Izotov & Thuan, 1998 | HIIG | 18 |
| Lequeux et al., 1979 | HIIG | 8 |
| Pagel et al., 1979 | NGC300,7 | 1 |
| Pagel et al. 1992∗ | HIIGs | 10 |
| Pastoriza et al., 1993∗ | GEHRs in NGC3310 | 5 |
| Peimbert et al., 1986 | NGC2363 | 1 |
| Popescu & Hopp, 2000 | HIIGs | 22 |
| Rayo et al., 1982 | GEHRs in M101 | 3 |
| Shaver et al., 1983 | DHRs | 7 |
| Shields & Searle, 1978∗ | GEHRs in M101 | 2 |
| Skillman, Côté & Miller, 2003 | GEHRs in Sculptor | 6 |
| Skillman & Kennicutt, 1993∗ | IZw18 | 2 |
| Skillman et al., 1994∗ | UGC4483 | 1 |
| Terlevich et al., 1991 | HIIGs | 100 |
| Vílchez et al., 1988∗ | GEHRs in M33 | 5 |
| Vílchez & Esteban, 1996∗ | DHRs | 3 |
| Vílchez & Iglesias-Páramo, 2003 | GEHRs in Virgo | 9 |
2 Sample of objects and abundance derivation
Our sample is comprised of a combination of different emission line objects ionised by young massive stars: diffuse HII regions in the Galaxy and the Local Group (DHR), Giant Extragalactic HII regions (GEHR) and HII galaxies (HIIG) and therefore does not include planetary nebulae or objects with non-thermal activity. For all of them direct determinations of electron temperature exist thus allowing the derivation of the oxygen abundance which we have taken as the observational metallicity indicator. The sample includes the objects analysed in (Díaz & Pérez-Montero 2000, hereinafter: DPM00) with the addition of low excitation GEHRs from CDT02; GEHRs in M101 (Kennicutt, Bresolin & Garnett 2003) and M51 (Garnett, Kennicutt & Bresolin 2004); GEHRs in galaxies in the Sculptor Group (Skillman, Côté & Miller 2003) and the Virgo cluster (Vílchez & Iglesias-Páramo 2004); and HII galaxies from the works of Guseva et al. (2000), Popescu & Hopp (2000)and Kniazev et al. (2001). Data from these latter objects have been complemented with information in the spectral range between 7000 Å and 1 micron from Pérez-Montero & Díaz (2003; hereinafter PMD03, 12 HII galaxies) and Garnett (1992; 13 objects), including the [SIII] strong emission lines.
| Object | Region | Ref. | n([SII]) | t([OIII]) | 12+ | t([OII]) | 12+ | |
|---|---|---|---|---|---|---|---|---|
| NGC628 | H13 | CDT02 | 6442 | 1.000.04 | 7.700.03 | – | 8.040.10 | 8.200.08 |
| NGC1232 | CDT1 | CDT02 | 12135 | 0.540.09 | 8.090.11 | – | 8.860.27 | 8.930.25 |
| CDT2 | CDT02 | 20: | 1.150.19 | 7.450.10 | – | 7.770.28 | 7.940.23 | |
| CDT3 | CDT02 | 19861 | 0.820.08 | 7.760.07 | – | 8.380.23 | 8.480.21 | |
| CDT4 | CDT02 | 224: | 0.930.06 | 7.690.04 | – | 8.080.14 | 8.230.12 |
The sources for the line intensities, together with the number and class of the collected objects, are summarized in Table 1. The total sample comprises 367 objects with lines in the optical part of the spectrum, 282 of them with [NII] data, and 126 with near IR [SIII] data.
The physical conditions – electron temperature, electron density and oxygen abundance – for the whole sample have been recalculated using the same procedures as in PMD03, based on the fivel-level statistical equilibrium model in the task TEMDEN contained in the software package IRAF (De Robertis, Dufour & Hunt 1987; Shaw & Dufour 1995). The atomic coefficients used are the same as in PMD03 and are referenced in Table 4 of that work. Electron densities were determined from the [SII] 6717Å / 6731Å line ratio. Electron temperatures have been calculated from the [OIII] ( 4959Å+5007Å)/ 4363Å line ratio for all but 13 objects of the sample for which the [SIII] ( 9069Å+9532Å)/ 6312Å line ratio has been used isnstead. These latter objects are of low excitation and lie on the high metallicity range (for example, CDT1 in NGC1232 (Castellanos et al. 2002) or S5 in M101 (Kinkel & Rosa, 1994)). For them, an empirical relation between [OIII] and [SIII] electron temperatures has been used:
based on the grids of photo-ionisation models described in the next section and, differing slightly from the empirical relation found by Garnett (1992), due mainly to the introduction of the new atomic coefficients for S2+ from Tayal & Gupta (1999).
Regarding [OII] temperatures, for 81 objects of the sample it has been possible to derive its value from the [OII]( 3726Å+3729Å) / 7325Å line ratio. 333The [OII] 7319Å+7330Å lines can have a contribution by direct recombination which increases with temperature. Using the calculated [OIII] electron temperatures, we have estimated these contributions to be less than 4 % in all cases and therefore we have not corrected for this effect. For the rest of the objects in the sample we have resorted to the model relations between t([OII]) and t([OIII]) found in PMD03 that take explicitly into account the dependence of t([OII]) on electron density. This can affect the deduced abundances of by non-negligible factors, larger in all cases than the reported errors.
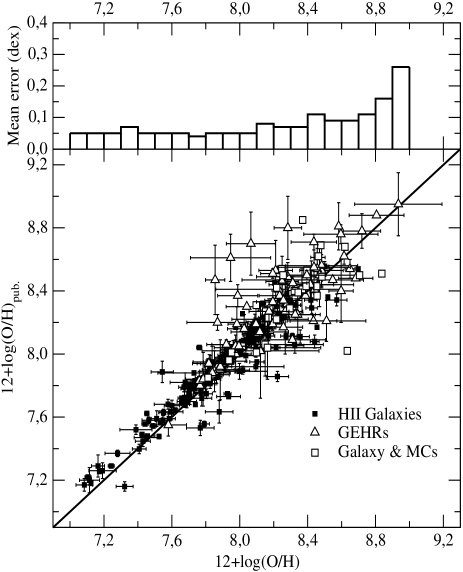
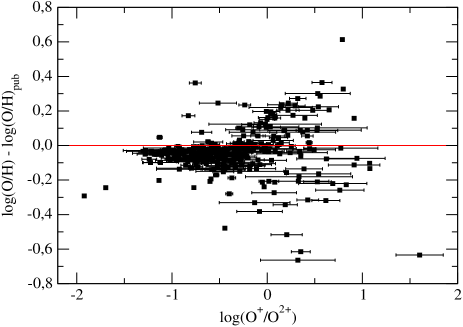
Figure 1, shows a comparison of the total oxygen abundances derived as described above with the values published in the original sources. The deviations from the 1:1 relation arise mostly in the high metallicity range as a result of the dependence of t([OII]) on density which affects the calculated O+/H+ abundances. This can be better seen in Figure 2 where the abundance differences are plotted as a function of the O+/O++ ionic fraction.
The oxygen abundances of the sample objects cover the range 0.02Z⊙ (IZw18; Skillman & Kennicutt 1993) to 1.82Z⊙ (CDT1 in NGC1232; Castellanos et al. 2002)444A solar value of 12+log(O/H)= 8.69 (Allende-Prieto, Lambert & Asplund 2001) is assumed through this paper. . The re-calculated [SII] electron densities, [OII] and [OIII] electron temperatures and oxygen abundances are listed in Table 2. The quoted uncertainties have been derived from the emission line flux errors as published in the corresponding references. In the upper panel of Figure 1, the values of these errors (half-error bars) are plotted as a function of oxygen abundance. It can be seen that the errors are almost constant, with an average value of about 0.07 dex, up to 12+log(O/H) 8.1 and thereafter increase with metallicity up to 0.5 dex at the highest derived abundances.
The complete table will be available in electronic form at CDS (Centre de Données astronomiques de Strasbourg), via anonymous ftp to cdsarc.u-strasbg.fr (130.79.128.5), (http://cdsweb.u-strasbg.fr) , or at http://pollux.ft.uam.es/enrique/Table1/. Only an example is given here.
At any rate, it should be recalled that the determination of the gaseous chemical abundances is usually accomplished by combining results from photoionization models and observed emission line intensity ratios. Even when the electron temperature can be determined with good accuracy, there are several major unsolved problems that severely limit the confidence of present results including: (1) the effect of temperature structure in multiple-zone models (PMD03); (2) the presence of temperature fluctuations across a given nebula (Peimbert, 2003); (3) collisional and density effects on ion temperatures (Luridiana, Peimbert, & Leitherer 1999); (4) the presence of neutral zones affecting the determination of ionization correction factors (ICF’s)(Peimbert, Peimbert & Luridiana 2002); (5) the ionization structure which is not adequately reproduced by current models (PMD03); (6) the possible photon leakage that affects the low ionization lines formed in the outer parts of the ionized regions (Castellanos, Díaz, & Tenorio-Tagle 2002). The first three effects can introduce uncertainties with respect to the derived oxygen abundances of about 0.2, 0.3 and 0.4 dex respectively, depending on excitation. The uncertainties introduced by the latter effects have not yet been quantified.
3 Photo-ionisation models
In order to identify and understand the possible sources of scatter in the different empirical calibrations, we have calculated a set of photo-ionisation models covering the physical conditions of the observed objects. No attempt has been made however to perform recalibrations using these models.
The photoionisation models have been computed with the most recent version of the photo-ionisation code CLOUDY 96 (Ferland 2002).
Each modelled HII region has been assumed to be spherically symmetric, with the ionised emitting gas taken to be of constant density (10 and 100 particles per cm3), located at a distance very large compared to its thickness and therefore allowing the approximation of plane-parallel geometry. The gas is ionised by a single massive star whose spectral energy distribution (SED) is represented by a CoStar NLTE stellar atmosphere (Schaerer & de Koter, 1997) with effective temperature between 35000 K and 50000 K . The impact on the analysis of the general trends shown by empirical calibrations using other SEDs is negligible and, in practice, only slightly affects the absolute effective temperature scale. Ionisation parameters () between 10-2 and 10-3, which is the range corresponding to the ionisation degree shown by the sample objects, have been chosen. Finally, the solar chemical abundances used are those given in Table 3.
| Element | Photosphere555in terms of | Depleteda |
|---|---|---|
| He1 | -1.07 | -1.07 |
| O3 | -3.31 | -3.31 |
| N2 | -4.07 | -4.07 |
| S1 | -4.67 | -4.67 |
| C2 | -3.41 | -3.41 |
| Ne1 | -3.92 | -3.92 |
| Ar1 | -5.60 | -5.60 |
| Si2 | -4.47 | -4.77 |
| Fe2 | -4.55 | -5.55 |
| Mg1 | -4.47 | -5.47 |
| Al1 | -5.53 | -6.53 |
| Ca1 | -5.64 | -6.64 |
| Na1 | -5.67 | -6.67 |
| Ni1 | -5.75 | -6.75 |
We have computed models with values of this solar abundance multiplied by factors: 1.7, 0.85, 0.34, 0.17, 0.08 and 0.04 corresponding to 1, 0.5, 0.2, 0.1, 0.05 and 0.025 times the solar Grevesse & Sauval (1998) value (=-3.08). The refractory elements: Fe, Mg, Al, Ca, Na and Ni have been depleted by a factor of 10 and Si by a factor of 2 (Garnett et al. 1995), to take into account the presence of dust grains. In the case of nitrogen, we have considered, for the models with = 10-2.5, another set of abundances with a value of (N/O) 0.5 dex lower than the solar value, close to the values found in low metallicity nebulae.
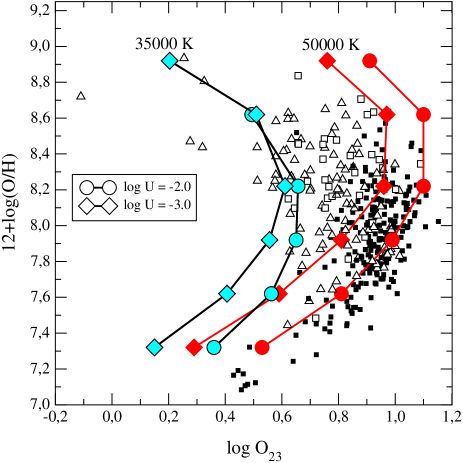
For the sake of clarity, only the models for =100 cm-3, Teff = 35000 K and 50000 K, and = 10-2.0 and 10-3.0 are shown in the figures.
4 Empirical abundance parameters
4.1 The R23 (O23) parameter
The R23 parameter, that here we have preferred to rename as
O23 in order to differentiate it from
the analogous parameter based on sulphur emission lines, was defined as:
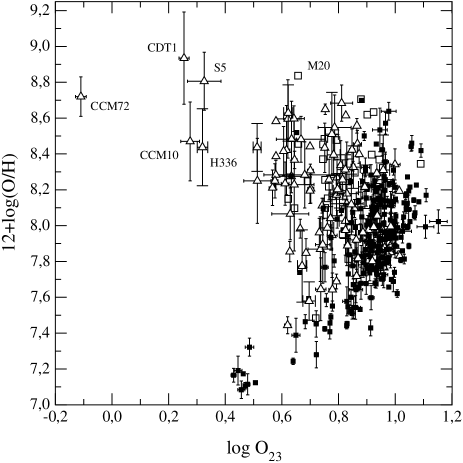
by Pagel et al. (1979). Its relation with oxygen abundance for the objects of the compiled sample can be seen in the left panel of Figure 3. The relation is double-valued. This is due to the efficiency of oxygen as a cooling agent thus decreasing the strength of the oxygen emission lines at high metallicities. At low metallicities however, the cooling is mainly exerted by hydrogen and the oxygen line strengths increase with metallicity. The value of logO23 reaches a maximum of about 1.2 at an oxygen abundance of 12+log(O/H) 8.0.
Three different regions can be distinguished in the plot: a lower branch in which O23 increases with incresing abundance, an upper branch in which the opposite occurs and a turnover region. The two branches can, in principle, be fitted by regression lines with positive and negative slope respectively providing a low to moderate uncertainty in the determination of the metallicity. In the turnover region with log O23 0.8 and 12+log(O/H) 8.0, although the precise values are difficult to assess, objects showing the same value of O23 can have oxygen abundances that differ by almost an order of magnitude. It should be noted that a large proportion of the data lie on top of this ill defined zone (up to 40% of the total number of objects and even more in the case of HII galaxies) where the abundance determination can be very uncertain.
Another characteristic of the calibration which is readily apparent is the existence of a scatter larger than accounted for by observational errors. This scatter is related to the fact that, in general, ionised regions do not constitute a single parameter family, hence different geometries of the emitting gas (ionisation parameter) and different ionising radiation temperatures can affect the values of the abundance parameter O23. This can be seen in the right panel of Figure 3, where data are shown together with different model sequences . Error bars have been omitted for the sake of clarity. O23 is seen to depend on both ionisation parameter and stellar effective temperature. The dependence on ionisation parameter is more evident at low metallicities, while the dependence on effective temperature is important in all metallicity regimes. This double dependence makes of O23 a rather unsuitable abundance parameter. In fact, at an oxygen abundance of 12+log(O/H) = 7.8, logO23 can vary between 0.5 and 0.9.
Different assumptions about the effects of metallicity on either nebular structure or ionising temperature have been used by different authors in order to define a sequence of models that would eventually allow the calibration of the upper branch where observational data is very scarce. From analyses of HII region data, McCall, Rybski & Shields (1985) concluded that the stellar ionising temperature varied with metallicity while the filling factor remained constant, whereas Dopita & Evans (1986) concluded the opposite: that ionising temperature was constant while U varied with oxygen abundance. These two different assumptions led to calibrations yielding abundances that differ by more than a factor of two.
Theoretical stellar evolution models point to a relation between stellar metallicity and effective temperature in the sense that, for a given mass, stars of higher metallicities show lower effective temperatures. This fact led McGaugh (1991;McG91) to produce a new calibration based on more realistic theoretical models in which the ionisation is provided by stellar clusters of different metallicities. According to his models, in the upper branch, O23 is relatively insensitive to both ionising temperature and U and the models converge to a single sequence. In the lower branch however, O23 is mostly dependent on U, as has already been shown by Skillman (1989; S89) and additional information about this parameter is needed in order to apply the empirical method with greater confidence.
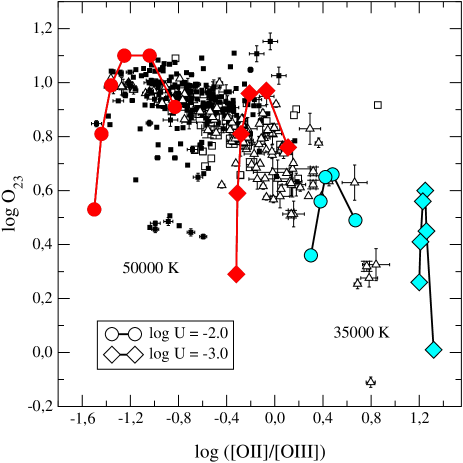
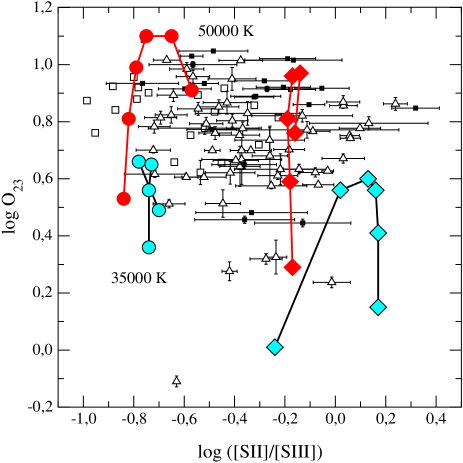
Some authors have used the [OII]/[OIII] ratio as an ionisation parameter indicator to obtain this additional information (e.g. Kobulnicky et al. 1999). The hardness of the ionising radiation however also affects this ratio in a significant way. In fact, at a given value of U, the [OII]/[OIII] ratio is lower for higher stellar effective temperatures as a result of the increase of the ionisation of O+ to O++. These effects can be seen in Figure 4 where is plotted as a function of log ([OII]/[OIII]) (left panel) where it can be seen that the [OII]/[OIII] ratios corresponding to models with the same ionisation parameter and different stellar ionising temperature widely differ.
Just the opposite happens in the case of [SII]/[SIII], another line ratio used as an ionisation parameter indicator (e.g Díaz et al. 1991). At constant U, [SII]/[SIII] increases somewhat with increasing stellar effective temperature as more S++ is converted to S3+, although in this latter case the effect is important only for the highest ionisation parameters (U 10-2), thus making the [SII]/[SIII] ratio a more useful ionisation parameter diagnostic. Figure 4 (right panel) shows that [SII]/[SIII] depends mostly on the ionisation parameter and is rather insensitive to the stellar effective temperature.
Regarding observational data, no clear relation is found between and log ([SII]/[SIII]), implying that oxygen abundance and the ionisation parameter are not correlated. On the other hand, a definite trend between and [OII]/[OIII] is clearly seen which can be explained by the expected dependence of stellar effective temperature and metallicity (see also Kewley & Dopita 2002).
Finally, in the turnover region, O23 is sensitive to both ionisation parameter and ionising temperature and is almost insensitive to oxygen abundance.
It should be taken into account that McGaugh models use zero age star clusters. The situation becomes much more complicated when the evolution of these clusters is taken into account; the evolution of massive stars is fast and metallicity dependent and the cluster ionising temperature may not be a monotonicaly decreasing function of age once WR stars begin to appear (García-Vargas, Bressan & Díaz 1995; Stasińska & Leitherer 1996).
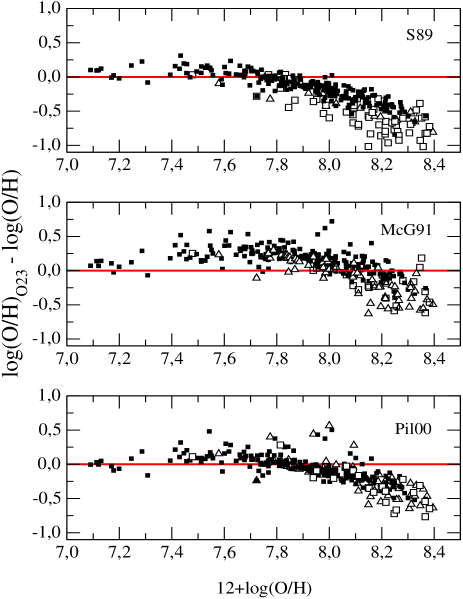
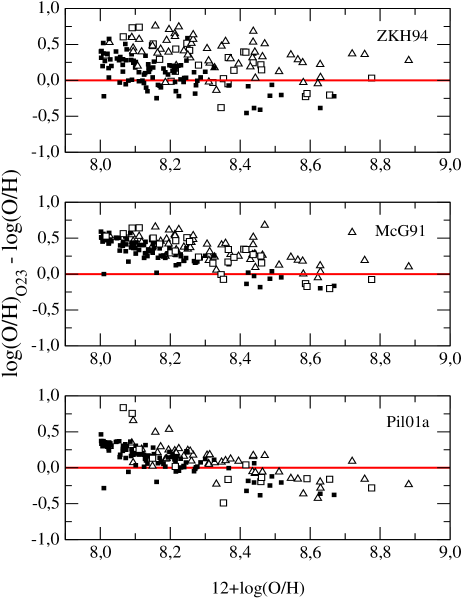
Figures 5 and 6, show the residuals of several published calibrations of the O23 parameter in both lower and upper branches as well as in the intermediate region. The calibrations of S89 for the lower branch and Zaritsky, Kennicutt & Huchra (1994; hereinafter ZKH94) for the upper one, involve only the O23 parameter. In contrast, the calibrations of McG91 and Pilyugin (2000, 2001a; hereinafter Pil00 and Pil01a, respectively) take also into account the dependence on ionisation parameter and effective temperature via the ([OII]/[OIII]) ratio (Kobulnicky et al. 1999) and the parameter, P, defined as the quotient of [OIII] and ([OII]+[OIII]) by Pil00.
For the lower branch, that we have considered as corresponding to 12+log(O/H) 8.0, the best fit is found for the calibration by Pil00, with a mean value for the metallicity 0.03 dex higher than the mean value of those directly derived. Its uncertainty in this regime, understood as the standard deviation of the residuals, is 0.15 dex which should be compared to the 0.07 dex average error in the direct oxygen abundance determination (see Figure 1). The calibrations by Skillman and McGaugh present also the same dispersion, although the mean values of the deduced abundances are 0.06 dex lower and 0.21 dex higher respectively than the mean value of those directly derived. A slight trend in the sense of abundances being more underestimated as the metallicity increases is found in the S89 calibration. This trend is probably introduced by the slight dependence of O23 on ionisation parameter at high effective temperature that as shown by HII galaxy data in left panel of Figure 4.
In fact, in this metallicity range, he values predicted by photoionisation models for different values of the ionisation parameter and stellar effective temperature produce a scatter in the versus 12+log(O/H) relationship larger than shown by observational data. This probably indicates that the objects compiled to perform the calibrations, mainly HII galaxies, show very similar properties, ı.e. they show a very restricted range of ionisation parameters and ionising temperatures. It should be noted however, that not all HII galaxies share those properties and that, in particular, those that lack detectable electron temperature sensitive lines and therefore are the probable targets of the empirical calibrations, show ionisation parameters which are significantely lower. These include Luminous Compact Blue Galaxies (LCBGs) (Hoyos & Díaz 2005).
For the upper branch, in the range 12+log(O/H) 8.4 the best fit is found with McG91 calibration, although it predicts abundances 0.08 dex larger than the mean value, with a dispersion of 0.19 dex. Taking into account that the average error in the direct oxygen abundance determination in this regime is about 0.20, this calibration provides a good estimate of the oxygen abundance for metallic objects. The calibration by Pil01a underestimates abundances by 0.14 dex on average with a dispersion of 0.21 dex. Contrary to what is found for the lower branch, the only calibration not taking into account the dependences on log and Teff (ZKH94) shows the largest dispersion (0.27 dex) which probably implies that, in this case, the calibrating sample objects do not share ionising properties.
Finally, for the intermediate region, in the range 8.0 12+log(O/H) 8.4, we have evaluated both the calibrations for the lower and upper branches. In this case it can be observed that the lower branch calibrations underestimate the metallicity and the upper branch calibrations overestimate it with residuals that increase with increasing and decreasing metallicity respectively. In this regime it is virtually impossible to choose any reliable calibration of O23.
There are not many ways to improve on the O23 abundance parameter calibration, since HII regions and HII galaxies are ionised by young star clusters and, as these clusters evolve, their ionisation parameters and ionising temperatures change in ways that are not easy to parametrize. A more promissing approach is the search for other potentially useful abundance parameters, some of which are examined below.
4.2 Parameters involving [NII]
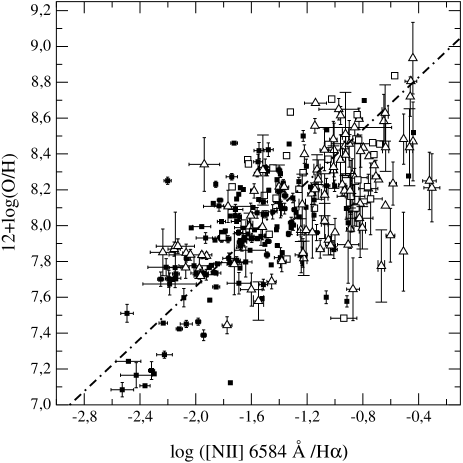
The N2 parameter was defined as:
by Denicoló, Terlevich & Terlevich (2002, hereinafter DTT02), although it was used before as an empirical estimator by Storchi-Bergmann et al. (1994) and Van Zee et al. (1998). The relation between N2 and the logarithmic oxygen abundance is shown in the left panel of Figure 7 for all the objects in the sample for which nitrogen data exists. The N2 parameter has several advantages: first of all, contrary to O23, the relationship between N2 and oxygen abundance is single-valued and secondly, since the emission lines on which it is based are very close in wavelength, the N2 parameter is almost free of uncertainties introduced by reddening corrections or flux calibrations. The dash-dotted line in the plot corresponds to the relation found by DTT02, for their sample objects:
This line represents a reasonable fit to the data, but shows a large scatter at all metallicities. Most of the scatter is shown by GEHR data, while HII galaxies define a much narrower relation. Most GEHR data fall below the line. This is not surprising since many of the metal rich GEHR used by DTT02 in their calibration had oxygen abundances derived from O23 and directly derived abundances for metal rich HII regions tend to be lower than those derived from this parameter (Castellanos et al. 2002; Garnett et al. 2004).
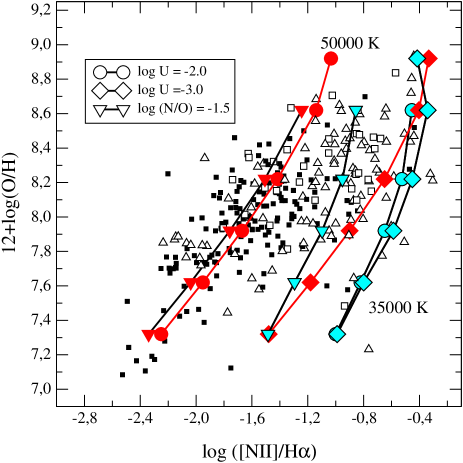
Again, the main reason for the dispersion is probably related to the different ionisation parameters and stellar effective temperatures of GEHR since the N2 parameter depends on both as can be seen in the right panel of Figure 7. The [NII] lines become weaker as the excitation degree and/or the ionising temperature increase. N2 reaches a maximum of about -0.5 for models with low effective temperature (35000 K) while the lowest values of the parameter are found in models with high effective temperature (50000 K) and high ionisation parameter (logU=-2.0). An additional source of scatter is related to the possibly different N/O relative abundances. To try to quantify this effect we have added a set of photo-ionisation models with a value of log(N/O) 0.5 dex lower than our solar assumed value (see Table 3) and log . This model sequence can be seen also in Figure 7 (right panel). A lower N/O ratio mimics a higher ionisation parameter. Model sequences of high ionising temperatures and constant N/O ratio seem to reproduce adequately HII galaxy data while a sequence of models with N/O incresing with oxygen abundance would seem more adequate for GEHR data.
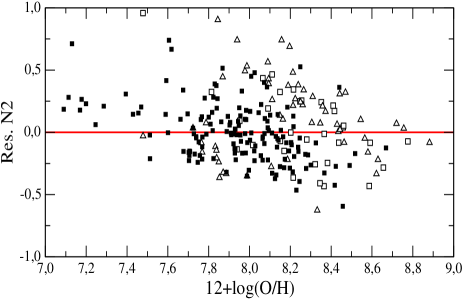
The residuals of the fit from the DTT02 calibration against the directly determined oxygen abundances are represented in Figure 8. This empirical calibrator works reasonably well in the turnover region of the logO23 versus 12+log(O/H) plot, although the dispersion reaches a value of 0.27 dex for the reasons given above. This dispersion is of 0.25 dex for HII galaxies. For the rest of the sample it reaches 0.3 dex with the mean value 0.1 dex higher thus implying that, in these cases, oxygen abundances could be overestimated.
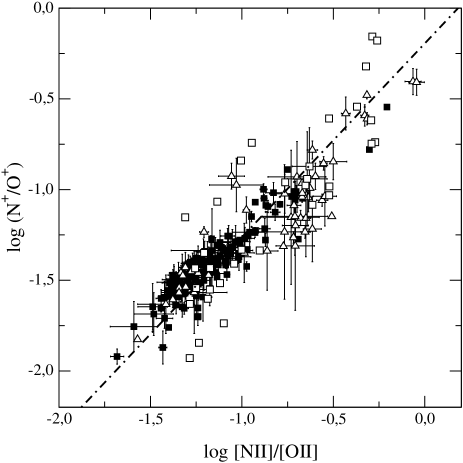
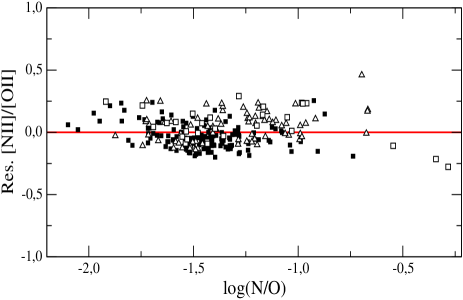
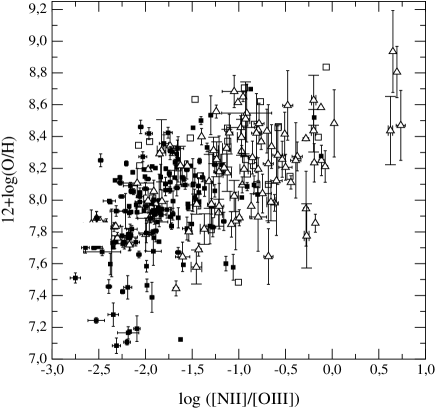
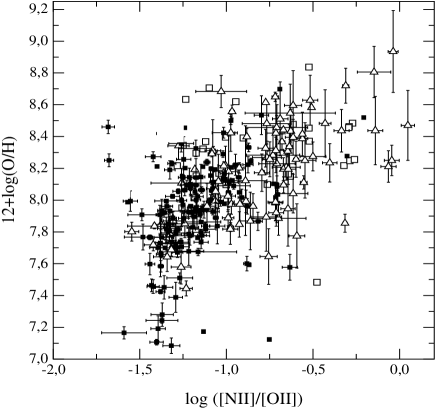
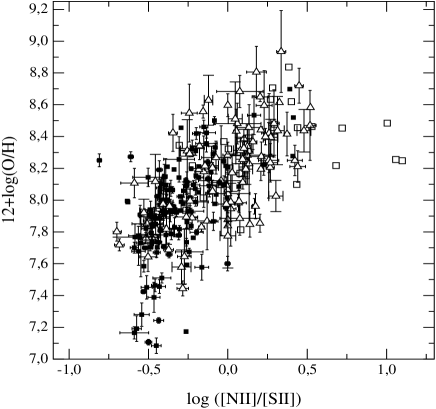
Other empirical parameters involving the [NII] lines are the [NII]6548,6584 Å/[OIII]4959,5007 Å ratio, first proposed by Alloin et al. (1979) and recently revindicated by Pettini & Pagel (2004), and the [NII]6548,6584 Å/[OII]3727,3729 Å and [NII] 6548,6584 Å/[SII] 6716,6731 Å ratios suggested by Dopita & Evans (1986) and Kewley & Dopita (2002) as metallicity calibrators in the high abundance regime. In Figure 9, 12+log(O/H) is represented as a function of the [NII]/[OIII] parameter (top panel), the [NII]/[OII] parameter (middle panel) and the [NII]/[SII] parameter (bottom panel) for the compiled sample of objects. ¿From the direct comparison with observational data, it can be seen that these three parameters are valid only for a metallicity higher than 12+log(O/H) 7.8 and with a scatter similar to that found for the N2 parameter. This scatter could again be related to the different objects presenting different N/O ratios. In fact, a clear segregation is found between HII galaxy and GEHR data, more evident in the upper panel, which is probably related to the GEHR showing higher values of N/O and hence N/S ratios. Figure 10 (upper panel) shows that a tight relation exists between log([NII]/[OII]) and log(N+/O+) that is, in turn, a very good indicator of log(N/O). The fit of a regresion line to the data produces the relation:
The uncertainty involved in the determination of the N/O ratio from [NII]/[OII] for the whole sample, represented by the standard deviation of the residuals, is 0.14 dex, but decreases to only 0.08 for HII galaxies (see Figure 10, lower panel).
4.3 The S23(4) parameter
The S23 parameter was defined by Vílchez & Esteban (1996) as:
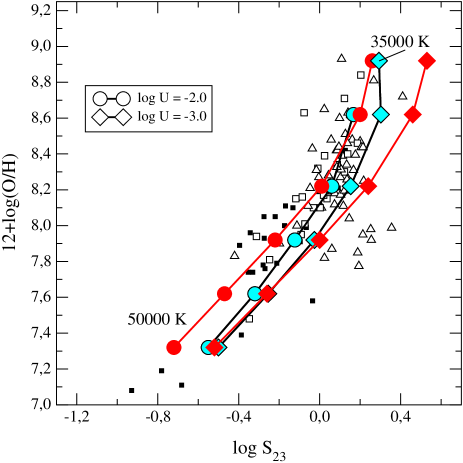
using the [SII] and [SIII] lines analogous to those of [OII] and [OIII] in the O23 parameter. It was proposed by Christensen, Petersen & Gammerlgaard (1997) as a sulphur abundance indicator and more recently by DPM00 as an oxygen abundance indicator due to the characteristics evident in Figure 11 (left panel): firstly its single-valued behaviour up to solar metallicities, and secondly its lower dependence on the other functional parameters. The fact that S23 presents a lesser dependence on effective temperature and ionisation parameter than , seems to be confirmed by photo-ionisation models (see Figure 11, right panel). There is a dependence of S23 on log and Teff but it is weaker than for O23 (see Figure 3 for a comparison).
¿From the observational point of view, the S23 parameter has two important advantages: firstly the sulphur lines remain intense even for the highest metallicity objects and secondly it is relatively independent of reddening, since the lines of both [SII] and [SIII] can be measured relative to nearby hydrogen recombination lines. On the negative side, [SIII] lines shift out of the far red spectral region for redshifts higher than 0.1.
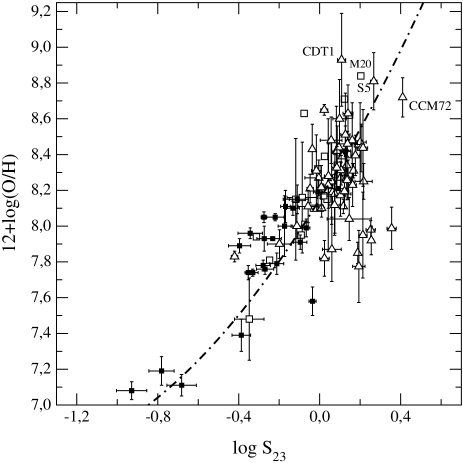
Using the newly added observational data we have improved the DPM00 relation to:
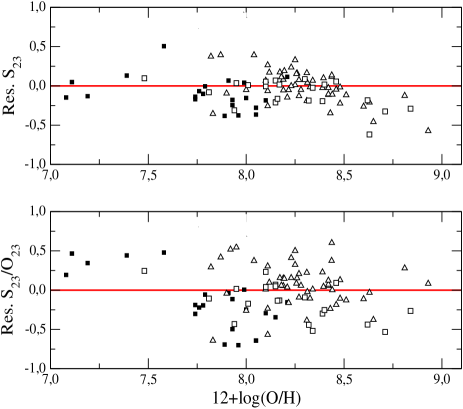
whose residuals for the complete sample relative to the directly determined oxygen abundances are represented as a function of oxygen abundance in the upper panel of Figure 16 . The dispersion is approximately equal to 0.2 dex in all the abundance ranges although it decreases to 0.10 dex for the HII galaxy sample. The relation is not linear. Values of S23 lower than expected are found for higher excitation nebulae having low metallicity probably due to the presence of [SIV] in non-negligible amounts, as seems to be indicated by the position on the diagram of IZw18, the least metallic object. Unfortunately, despite recent observations of a sample of HII galaxies in the near IR spectral range (PMD03), there is a considerable lack of data on objects of low metallicity whose inclusion would definitely improve the calibration.
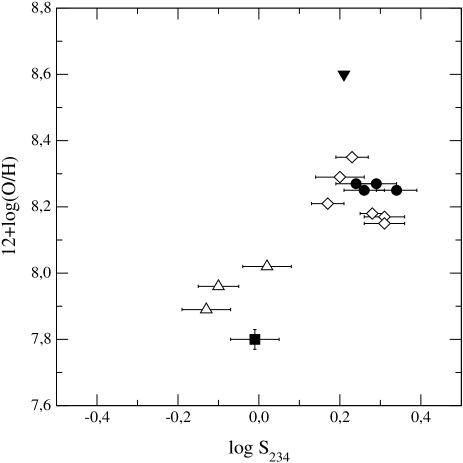
Oey & Shields (2000) have defined a new parameter, S234,
which takes into account the contribution of [SIV] through its emission line at 10.52 . The contribution of [SIV] is expected to be relevant only in objects with a high degree of ionisation (Díaz et al. 1991) and therefore the use of S234 almost eliminates the dependence on ionisation parameter found for S23 (Kennicutt et al. 2000). In fact, photoinisation models indicate that S23 is only slightly dependent on ionisation parameter but shows a non negligible dependence on effective temperature, which becomes more evident at high metallicities (see Figure 13).
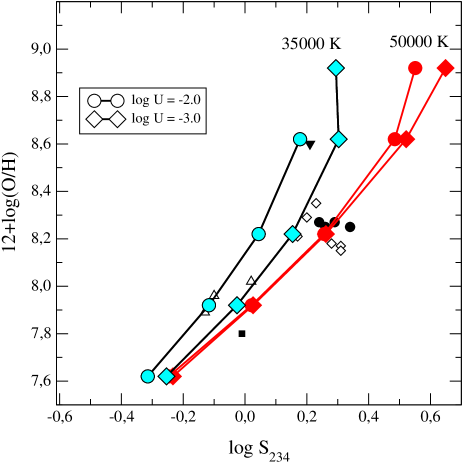
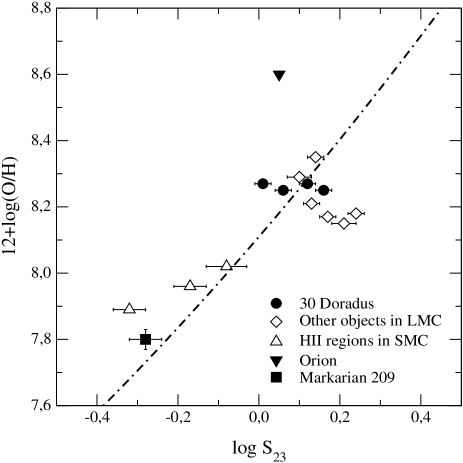
Unfortunately, the sample of objects for which the [SIV] line in the mid infrared is measured is very poor. Using the available data for these objects we have confirmed that the contribution of this line to S234 can be rather large. We have found very little [SIV] data for HII regions, GEHR and HII galaxies: the Orion nebula (Lester et al. 1979), Mrk 209 (Nollenberg et al. 2002) and a sample of objects in the Magellanic Clouds (Vermeij et al. 2002). Data on these objects are plotted in Figure 12 (S23 in the left panel and S234 in the right panel). Any improvement in the abundance calibration is difficult to quantify given the scarcity of data. At any rate, since no observations of the 10.5 line exist for most objects, it would have to be calculated from photo-ionisation models which would make S234 a semi-empirical parameter.
4.4 The S23/O23 parameter
One fact that becomes evident from the examination of the different abundance parameters discussed above is that the validity of each one of them seems to be restricted to a given metallicity range. This means that it is necessary to have some a priori knowledge about the metallicity of an object or a sample of objects in order to choose the appropriate abundance indicator.
Traditional ways of doing this include an examination of the [NII] 6584 Å/H ratio that can discriminate between objects with 12+log(O/H) higher or lower than about 8.0 (S89). More recently, the values of the O23 and S23 taken together have been used by DPM00 to discriminate between subsolar and oversolar abundances. However, in some cases, the interest is focused on the comparison of global abundances trends shown by different objects or abundance distributions over a wide range of metallicities. In those cases it would be desirable, to obtain abundances by means of the same calibrator so that comparisons are meaningful. This calibrator should be valid for the whole metallicity range.
The study of metallicity gradients over galaxy discs is one of the issues what could be improved in this way. For example, there are many different conclusions about the value of the oxygen abundance distribution in the well studied galaxy M101 . Different authors (Zaritsky, 1992; Scowen et al. 1992; Vila-Costas & Edmunds, 1992) have pointed to an increase in the slope of the gradient in the inner regions whereas other authors (Henry & Howard, 1995; Pilyugin, 2001b) obtain an exponential law throughout the whole disc. Kennicutt & Garnett (1996) have shown how the use of one calibration of O23 or another leads to different conclusions.
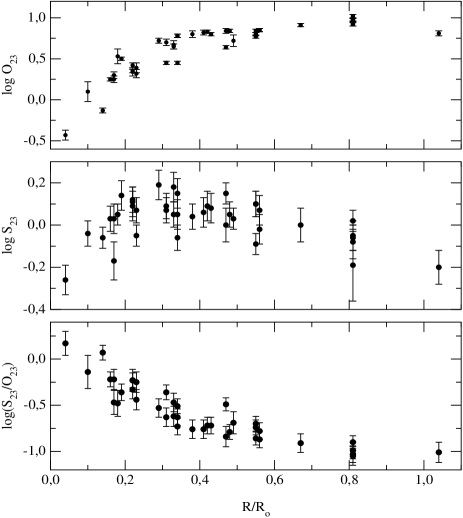
In Figure 14 we represent the gradient of some of the parameters studied here as a function of the galactocentric distance to the center of M101 (data from Kennicutt & Garnett, 1996). In the upper panel the O23 parameter is seen to increase with increasing galactocentric radius up to a value of 0.3 R0 and then it remains almost constant. In the middle panel, the S23 parameter shows the same behaviour as O23 in the central regions of the disc but decreases with increasing galactocentric radius from 0.3 R0 onwards. These two trends taken together point to the central disc regions of M101 ( R 0.3 R0 ) being over-solar and thus lying on the upper branch of the O23 and S23 parameters. The outer regions of the disc would have under-solar abundances and lie on the lower branch of the S23 calibration. Most of the regions in this regime ( R 0.3 R0 ) lie on the turnover region of the O23 calibration and therefore show an almost constant value of this parameter. In the lower panel of Figure 14, we can see that a combination of the two parameters, S23/O23, shows a continously decreasing trend through the disc of M101.
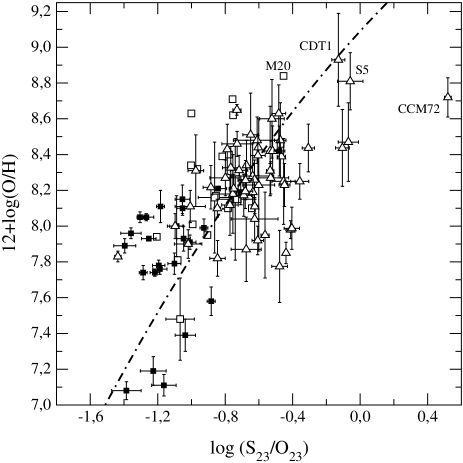
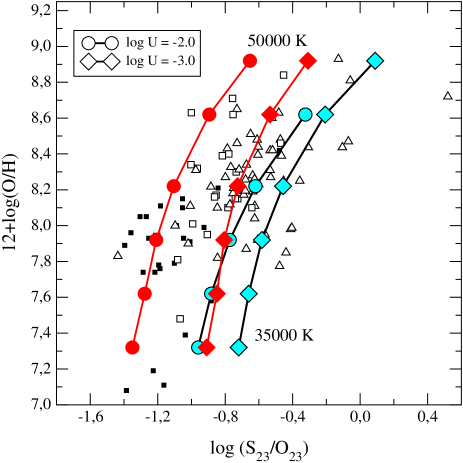
Using all the objects of our sample with measurements of the [OII], [OIII], [SII] and [SIII] lines and a direct determination of the metallicity, we have calibrated for the first time this new parameter (Figure 15 left panel). As can be seen, the relation remains single-valued for the whole range of metallicity, though it is non-linear, due probably to the contribution of [SIV] for high excitation regions of low metallicity. The addition of high metallicity objects is not possible due to the lack of data with he necessary auroral lines, but the fact that the parameter increases towards the inner parts of the disc of M101 (see Figure 14) suggests that it does not undergo any turnover at high metallicites. Of course, this parameter keeps the same sources of uncertainty as its two progenitors. In Figure 15 (right), where we compare the observational data with results from our photo-ionisation models, it can be seen that the value of S23/O23 increases for low degrees of ionisation and lower effective temperatures.
Using the compiled data, we propose the following relation to derive oxygen abundances in the whole metallicity range in the absence of auroral emission line data:
This relation is plotted along with data in the left panel of Figure 15. The residuals of this fit from the values of 12+log(O/H) deduced from the direct method, are plotted in the lower panel of Figure 16 and show a dispersion of 0.27 dex, comparable to that found for the N2 parameter.
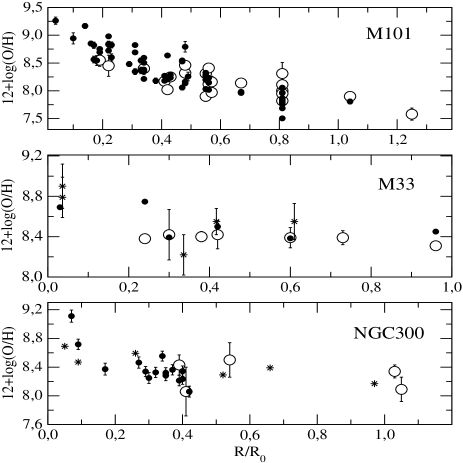
The upper panel of Figure 17 shows the oxygen abundance gradient in M101. Solid circles correspond to oxygen abundances derived using the S23/O23 parameter from the emission line data of Kennicutt & Garnett (1996); open circles correspond to abundances derived by the direct method (Kennicutt et al. 2003). The agreement between directly determined and empirically derived abundances is excellent.
Unfortunately, sulphur line intensity data is scarce and therefore it is difficult to assess the suitability of the S23/O23 parameter as an abundance gradient indicator. We have found only two more galaxies with data covering a substantial part of the disc: M33 (data from Kwitter & Aller 1981 and Vílchez et al. 1988) and NGC300 (data from Deharveng et al. 1988 and Christensen et al. 1997). Their abundance gradients are shown in the middle and lower panels of Figure 17 respectively. Again, solid circles correspond to oxygen abundances derived using the S23/O23 parameter and open circles correspond to abundances derived by the direct method. We have also added oxygen abundance data derived from the spectroscopic analysis of early B-type supergiant stars (Monteverde et al. 1988; Urbaneja et al. 2003). Although the discs of these two galaxies are not as well sampled as that of M101, the agreement between empirically and directly derived abundances is good and the agreement between nebular and stellar abundances is encouraging. Regarding the shape of the gradients, in all three cases an increase in slope for the central galactic regions is apparent, although in the cases of M33 and NGC300 nothing conclusive can be said. We think that more observations and more work along these lines would greatly help to derive the true abundance distributions across the discs of galaxies.
5 Summary and conclusions
In this work we have revised the different proposed oxygen abundance calibrations using a large compiled sample of observations comprising the emission lines of [OII], [OIII], [SII], [SIII] and [NII] for objects with oxygen abundances derived by the direct method. The data has been compared with results from a set of photo-ionisation models in order to seek an explanation to the sources of scatter in the calibrations. The direct calibration of any parameter with model results alone would lead to non quantifiable systematic errors and we consider strictly empirical calibrations to be much more reliable.
| Parameter | Range of Z 666Z represents 12+log(O/H) | Uncertainty777in logarithmic units, dex |
|---|---|---|
| O23 (lower branch) | Z 8.0 | 0.13 (Pil00, McG91) |
| O23 (int. region) | 8.0 Z 8.4 | 0.70 |
| O23 (upper branch) | Z 8.4 | 0.19 (McG91) |
| N2 | All Z (HII galaxies) | 0.25 |
| S23 | Until 8.9 | 0.20 |
| S23/O23 | All Z | 0.27 |
In Table 4 we summarize the main properties of the parameters studied, including their metallicity range of validity, and the uncertainty obtained for each calibration, understood as the standard deviation of the residuals of the deduced oxygen abundance and that derived through the direct method. The O23 parameter is the most widely used due to the important role of oxygen in the cooling of the ionised gas and because the oxygen emission lines remain in the optical-far red part of the spectrum until redshift 1. This parameter presents a double-valued relation with metallicity and in the lower and upper branch (in the latter case, taking into account the strong dependence on effective temperature) the uncertainty remains below 0.2 dex. Nevertheless, the uncertainty in the turnover region (for 12+log(O/H) between 8.0 and 8.4) may reach almost an order of magnitude. No ways of improving this calibration further have been found in this work.
The best alternative to this parameter in this metallicity regime is S23. In objects where it is possible to observe the near-IR [SIII] lines (up to redshift 0.1), the metallicity can be deduced with less than 0.2 dex dispersion up to oxygen abundances 12+log(O/H) 8.9. The S23 parameter also offers the advantage of being relatively independent of reddening. The contribution of the [SIV] emission line in the mid-IR is relevant only for high excitation objects and can be taken into account by means of the S234 parameter. Unfortunately, there is, at the moment, very little data to calibrate it empirically, and avalaible photo-ionisation models fail to correctly reproduce the ionisation structure for sulphur (PMD03).
The N2 parameter, also reddening independent, is a good alternative for distant objects (up to 0.5) with intermediate metallicity ( 8.0 12+log(O/H) 8.4). Nevertheless, this parameter suffers from uncertainties due to its dependence on ionisation parameter and N/O ratio. Besides, the calibration done by DTT02 works better for HII galaxies data but its application to higher metallicity regions carries a higher uncertainty and possibly overestimates the derived oxygen abundances.
Regarding the [NII]/[OIII], [NII]/[OII] and [NII]/[SII] parameters, these are only correlated with oxygen abundances at moderate to high metallicities and show an uncertainty similar to that of N2. However, as the main source of uncertainty for the calibrations involving the nitrogen lines is probably related to the N/O ratio, these calibrations could be improved with the use of [NII]/[OII] as a N/O calibrator which shows a dispersion of only 0.10 dex for HII galaxies.
Finally we have used the compiled sample of objects to produce for the first time a calibration for the S23/O23 parameter, which could be useful to study variations over a wide rage of metallicities, as is the case for the discs of galaxies. This new parameter includes non-negligible uncertanties, inherited from its two predecesors, O23 and S23 but the results for the disc of M101 are encouraging.
Acknowledgements
We would like to thank M. Castellanos, R. Terlevich, E. Terlevich, C. Esteban, E. Pérez and
D. Valls-Gabaud for very interesting discussions and suggestions and an anonimous referee for a careful revision of the manuscript. We would also like to acknowledge the thorough revision of the English done by Michael Taylor.
This work has been partially supported by DGICYT projects AYA-2000-0973
and AYA-2004-08260-C03-03.
References
- [1] Allende-Prieto,C., Lambert, D.L. & Asplund, M. 2001, ApJ, 556, 63.
- [2] Aller, L.H., 1942, ApJ, 95, 52.
- [3] Alloin, D., Collin-Souffrin, S. Joly, M. & Vigroux, L. 1979, A&A, 78, 200.
- [4] Belley, J. & Roy, J-R 1992, ApJS, 78, 61.
- [5] Castellanos, M., Díaz, A.I. & Tenorio-Tagle, G. 2002, ApJ, 565, L79. (CDT02)
- [6] Castellanos, M., Díaz, A.I. & Terlevich, E. 2002, MNRAS, 329, 315.
- [7] Christensen, T., Petersen, L. & Gammelgaard, P. 1997, A&A, 322, 41.
- [8] Deharveng, L, Caplan, J., Lequeux, J., Azzopardi, M. Breysacher, J., Tarenghi, M & Westerlund, B. 1988, A&ASS, 73, 407.
- [9] Denicoló, G., Terlevich, R. & Terlevich, E. 2002, MNRAS, 330, 69. (DTT02)
- [10] Dennefeld, M. & Stasiǹska, G. 1983, A&A, 118, 234.
- [11] De Robertis, M.M., Dufour, R.J. & Hunt, R.W. 1987, JRASC, 81, 195.
- [12] Díaz, A.I. & Pérez-Montero, E. 2000, MNRAS, 312, 130. (DPM00)
- [13] Díaz, A.I., Terlevich, E., Pagel, B.E.J., Vílchez, J.M. & Edmunds, M.G. 1987, MNRAS, 226, 19.
- [14] Díaz, A.I., Terlevich, E., Vílchez, J.M., Pagel, B.E.J. & Edmunds, M.G. 1991, MNRAS, 253, 245.
- [15] Dinerstein, H.L. & Shields, G.A. 1986, ApJ, 311, 45.
- [16] Dopita, M.A. & Evans, I.N. 1986, ApJ, 307, 431.
- [17] Edmunds, M.G. & Pagel, B.E.J. 1984, MNRAS, 211, 507.
- [18] Ferland, G.J., HAZY: A brief introduction to CLOUDY. Univ. Kentucky internal report.
- [19] French, H.B. 1980, ApJ, 240, 41.
- [20] García Vargas, M.L., Bressan, A. & Díaz, A.I. 1995, A & A,
- [21] Garnett, D.R. 1992, AJ, 103, 1330.
- [22] Garnett, D.R., Dufour, R.J., Peimbert, M., Torres-Peimbert, S., Shields, G.A., Skillman, E.D., Terlevich, E.& Terlevich, R. 1995, ApJ, 449, 77.
- [23] Garnett, D.R. & Kennicutt, R.C., 1994, ApJ, 426, 123.
- [24] Garnett, D.R., Kennicutt, R.C. & Bresolin, F., 2004, ApJ, 607L, 21.
- [25] Garnett, D.R., Shields, G.A., Skillman, E.D., Sagan, S.P. & Dufour, R.J. 1997, ApJ, 469, 93.
- [26] González-Delgado, R.M., Pérez, E., Díaz, A.I., García-Vargas, M.L., Terlevich, E. & Vílchez, J.M. 1995, ApJ, 439, 604.
- [27] González-Delgado, R.M., Pérez, E., Tenorio-Tagle, G., Vílchez, J.M., Terlevich, E., Terlevich, R., Telles, E., Rodríguez-Espinosa, J.M., Mas-Hesse, M., García-Vargas, M.L., Díaz, A.I., Cepa, J. & Casta’neda, H.O., 1994, ApJ, 437, 239.
- [28] Grevesse, N.& Sauval, A.J.1998, sce, conf, 161, Standard Solar Composition.
- [29] Guseva, N.G., Izotov, Y.I. & Thuan, T.X. 2000, ApJ, 531, 776.
- [30] Henry, R.B.C., Howard, J.W. 1995, ApJ, 438, 170.
- [31] Holweger, H. 2001, AIPC, 598, 23.
- [32] Hoyos, C. & Díaz, A.I. 2005, MNRAS, submitted
- [33] Izotov, Y.L., Thuan, T.X. & Lipovetsky, V.A. 1994, ApJ, 435, 647.
- [34] Izotov, Y.L., Thuan, T.X. & Lipovetsky, V.A. 1997, ApJS 108, 11.
- [35] Izotov, Y.L.& Thuan, T.X. 1998, ApJ, 500, 188.
- [36] Jensen, E.B., Strom, K.M. & Strom, S.E. 1976, ApJ, 456, 504.
- [37] Kennicutt, R.C., Bresolin, F., French, H. & Martin, P. 2000, ApJ, 537, 589.
- [38] Kennicutt, R.C., Bresolin, F. & Garnett, D.R. 2003, ApJ, 591, 801.
- [39] Kennicutt, R.C. & Garnett, D.R. 1996, ApJ, 456, 504.
- [40] Kewley, L.J. & Dopita, M.A. 2002, ApJS, 142, 35.
- [41] Kinkel, U. & Rosa, M.R. 1994, A&A, 282, 37.
- [42] Kniazev, A.Y., Pustilnik, S.A., Masegosa, J., Márquez, I., Ugryumov, A.V., Martin, J.-M., Izotov, Y.L., Engels,D., Brosch, N., Hopp, U., Merlino, S. & Lipovetsky, V.A. 2000, A&A, 357, 101.
- [43] Kobulnicky, H.A. & Kewley, L.J. 2004, ApJ, 617, 240.
- [44] Kobulnicky, H.A., Kennicutt, R.C. Jr. & Pizagno, J.L. 1999, ApJ, 514, 544.
- [45] Kunth, D. & Sargent, W.L.W. 1983, ApJ, 273, 81.
- [46] Kwitter, K.B. & Aller, L.H. 1981, MNRAS, 195, 939.
- [47] Lequeux, J., Rayo, J.F., Serrano, A., Peimbert, M. & Torres-Peimbert, S. 1979, A&A, 80, 155.
- [48] Lester, D.F., Dinerstein, H.L. & Rank, D.M. 1979, ApJ, 232, 139.
- [49] McCall, L.M., Rybski, P.M. & Shields, G.A. 1985, ApJS, 57, 1.
- [50] McGaugh, S.S. 1991, ApJ, 380, 140. (McG91)
- [51] McGaugh, S.S. 1994, ApJ, 426, 135.
- [52] Monteverde, M.I., Herrero, A. & Lennon, D.J. 2000, ApJ, 545, 813.
- [53] Nollenberg, J.G., Skillman, E.D., Garnett, D.R. & Dinerstein, H.L. 2002, ApJ, 581, 1002
- [54] Oey, M.S. & Kennicutt, R.C. 1993, ApJ, 411, 137.
- [55] Oey, M.S. & Shields, J.C. 2000, ApJ, 539, 687.
- [56] Osterbrock, D.E. 1989, Astrophysics of Gaseous Nebulae and Active Galactic Nuclei. San Francisco. Freeman.
- [57] Pagel, B.E.J., Edmunds, M.G. & Smith, G., 1980, MNRAS, 193, 219.
- [58] Pagel, B.E.J., Edmunds, M.G., Blackwell, D.E., Chun, M.S. & Smith, G., 1979, MNRAS, 189, 95.
- [59] Pagel, B.E.J., Simonson, E.A., Terlevich, R.J. & Edmunds, M.G. 1992, MNRAS, 255, 325.
- [60] Pastoriza, M.G., Dottori, H.A., Terlevich, E., Terlevich, R. & D’iaz, A.I. 1993, MNRAS 260, 177.
- [61] Peimbert, A. 2003, ApJ, 584, 735.
- [62] Peimbert, M. 1967, ApJ, 150, 825.
- [63] Peimbert, A., Peimbert, M. & Luridiana, V. 2002, ApJ, 565, 668
- [64] Peimbert, M., Peña, M. & Torres-Peimbert, S. 1986, A&A, 158, 266.
- [65] Pérez-Montero, E. & Díaz, A.I. 2003, MNRAS, 346, 105. (PMD03)
- [66] Pettini, M. & Pagel, B.E.J. 2004, MNRAS, 348, L59.
- [67] Pilyugin, L.S. 2000, A&A, 362, 325. (Pil00)
- [68] Pilyugin, L.S. 2001a, A&A, 369, 594. (Pil01a)
- [69] Pilyugin, L.S. 2001b, A&A, 373, 56.
- [70] Popescu, C.C. & Hopp, U. 2000, A&ASS, 142, 247.
- [71] Rayo, J.F., Peimbert, M. & Torres-Peimbet, S. 1982, ApJ, 255, 1.
- [72] Schaerer, D. & de Koter, A. 1997, A&A, 322, 598.
- [73] Shaver, P.A., McGee, R.A., Danks, A.C. & Pottasch, S.R. 1983, MNRAS, 204, 53.
- [74] Scowen, P.A., Dufour, R.J. & Hester, J.J. 1992, 104, 92.
- [75] Shaw, R.A. & Dufour, R.J. 1995, PASP, 107, 896.
- [76] Shields, G.A. & Searle, L. 1978, ApJ, 222, 281.
- [77] Skillman, E,D. 1989, ApJ, 347, 883. (S89)
- [78] Skillman, E.D., Cø̂té, S. & Miller, B.W. 2003, AJ, 125, 593.
- [79] Skillman, E.D. & Kennicutt, R.C. 1993, ApJ, 411, 655.
- [80] Skillman, E.D., Kennicutt, R.C.Jr.& Hodge, P.W. 1989, ApJ, 347, 875.
- [81] Skillman, E.D., Terlevich, R.J., Kennicutt, R.C.Jr., Garnett, D. & Terlevich, E. 1994, ApJ, 431, 172.
- [82] Stasińska, G. & Leitherer, C. 1996, ApJS, 107, 661.
- [83] Storchi-Bergmann, T., Calzetti, D. & Kinney, A.L. 1994, ApJ, 429, 572.
- [84] Storchi-Bergmann, T., Schmitt, H..R., Calzetti, D. & Kinney, A.L. 1998, AJ, 115, 909.
- [85] Tayal, S.S. & Gupta, G.P. 1999, ApJ, 526, 541.
- [86] Terlevich, R. Melnick, J., Masegosa, J., Moles, M. & Copetti, M.V.F. 1991, A&AS, 91, 285.
- [87] Urbaneja, M.A., Herrero, A., Bresolin, F., Kudritzki, R.-P., Gieren, W. & Puls, J. 2003, ApJ, 584L, 73.
- [88] Van Zee, L., Skillman E D. & Salzer, J.J. 1998, AJ, 116, 1186.
- [89] Vermeij, R., Damour, J.M., van der Hulst, J.M. & Baluteau, J.-P. 2002, A&A, 390, 649.
- [90] Vila-Costas, M.B. & Edmunds, M.G. 1992, MNRAS, 259, 121.
- [91] Vílchez, J.M. & Esteban, C. 1996, MNRAS, 280, 720.
- [92] Vílchez, J.M. & Iglesias-Páramo, J. 2003, ApJS, 145, 225.
- [93] Vílchez, J.M., Pagel, B.E.J., Díaz, A.I:, Terlevich, E. & Edmunds, M.G. 1988, MNRAS, 235, 633.
- [94] Zaritsky, D. 1992, ApJ, 390, 732.
- [95] Zaritsky, D., Kennicutt, R.C. Jr & Huchra, J.P. 1994, ApJ, 420, 87. (ZKH94)