The Ultraluminous X-ray Sources
NGC 1313 X-1 and X-2
Abstract
We present a detailed analysis of XMM archival data of two Ultraluminous X-ray Sources (ULXs) in the nearby spiral galaxy NGC 1313: NGC 1313 X-1 and X-2. The spectral continuum of these sources was modeled with a soft thermal component plus a power-law. If the soft component originates from an accretion disk, the inferred mass of the compact remnant is , making it an Intermediate Mass Black Hole (IMBH). A detailed analysis of the residuals of the XMM EPIC-pn spectrum shows some evidence for the presence of an Oxygen emission line in NGC 1313 X-1. The simultaneous presence of an excess in emission, although at a much reduced significance level, at different energies in the X-ray spectra of NGC 1313 X-1 and X-2 is suggestive of typical emission lines from young supernova remnants. An optical counterpart for NGC 1313 X-2 was also identified. On an ESO 3.6 m image, the Chandra error box embraces a mag stellar-like object and excludes a previously proposed optical counterpart.
keywords:
Black holes , X-rays: individual (NGC 1313 X-1, NGC 1313 X-2/MS 0317.7-6647) , X-rays: binaries , X-rays: galaxies1 Introduction
Point-like, off-nuclear X-ray sources with luminosities in excess of
the Eddington limit for one solar mass are increasingly discovered in
nearby galaxies. Despite the growing body of observational data, the
mechanism which powers ULXs is still under debate. In several cases
a variability on timescales of months/years has been detected, hinting
towards the presence of a compact object.
Were these sources X-ray binaries in the host galaxy, assuming
Eddington-limited accretion, masses in the range
are inferred for the compact object from
the observed flux. IMBH may have
originated from the collapse of a massive star formed in a low
metallicity environment, or through merging of massive stars (or lower
mass BHs) in a cluster (Miller & Colbert, 2004). The BH
mass estimates derived from considerations involving the Eddington
limit are, however, questionable because these sources need not to be
spherically symmetric, nor stationary. It has been proposed that many
of the ULX properties can be explained assuming that they do not emit
isotropically (King et al., 2001) or are dominated by emission
from a relativistic jet (Kaaret et al., 2003). In this case, they
may harbor stellar mass BHs and may be similar to Galactic
microquasars.
Particularly interesting is the case of the three ULXs
hosted in the nearby SBc galaxy NGC 1313. One of them is known
to be associated with the interacting supernova SN 1978K (Schlegel et al., 2000).
The other two have been extensively
studied with several X-ray telescopes and, to date,
provide some of the best evidence for the presence of a soft component
in the X-ray spectrum of ULXs. Moreover, as discussed in Miller et al. (2004)
and Zampieri et al. (2004), hereafter Z04, their continuum
subtracted XMM EPIC-pn spectra show significant residuals
especially in the 0.5–3 keV range.
2 X-ray Data
XMM-Newton observed NGC 1313 on October 17, 2000 for a total of 42 Ks. The field was centered on the galaxy nucleus and contains all the three ULXs. The three XMM EPIC cameras operated in Prime Full Window mode with the medium filter. The analysis reported here follows that presented in Z04. We consider only the EPIC-pn spectrum because it has twice as many counts as each single MOS instrument. The EPIC-pn spectrum was directly extracted from the observation data file because the automatic pipeline processing failed to produce an event list. Data screening, region selection and event extraction were performed with the standard software XMM-SAS v 6.0.0. In order to eliminate the possible contamination of solar flares (present during the observation), event files were filtered using the good time intervals when the total off-source count rate above 10 keV is less than 1 counts s-1. This leave ks of useful time with an average count rate of counts s-1 for NGC 1313 X-1 and counts s-1 for NGC 1313 X-2.
The best fit of the XMM EPIC-pn continuum for both sources is obtained with an absorbed soft, thermal component (a multicolor disk blackbody, MCD) plus a power-law. In comparison with previous ROSAT and ASCA data the statistics is sufficiently good that two components models provide a significant improvement over single component ones (see Z04). The statistical improvement obtained adding a MCD component to a power-law model is significant above the level. The resulting best fitting parameters for NGC 1313 X-1 and X-2 are reported in Table 1. The inferred inner disk temperature is much lower than that obtained for single component thermal models, as already found by Miller et al. (2003). The X-ray luminosity in the 0.2–10 keV range, assuming isotropic emission and a distance of the host galaxy Mpc, is erg s-1 for NGC 1313 X-1 and erg s-1 for NGC 1313 X-2. If at maximum the source radiates at the Eddington limit, the BH mass is for X-1 and for X-2. Sub-Eddington accretion would imply an even larger mass.
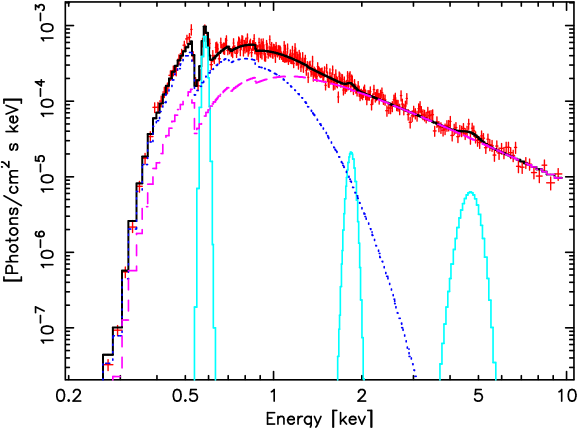
Residuals in the EPIC-pn spectra of NGC 1313 X-1 and X-2 suggest the presence of some emission lines in both sources. In order to test for the presence of spectral features, we added, one by one, gaussian components at different energies where residuals show evidence of some excess in emission.
For NGC 1313 X-1, the most significant residual is at around 0.6 keV, identified with a high ionization (He-like) Oxygen line (see Figure 1). Adding a gaussian component, the improvement of the fit with respect to an absorbed MCD+PL model is significant at the 3.5 level. The line energy is 0.58 keV, while the line width was frozen in the fit (0.01 keV). Residuals show also an excess of emission at energies of 1.8 and 4.7 keV (see Figure 1). The first is the typical energy of highly ionized Silicon, while the second is not readily identified. Adding other two gaussian components for fitting these residuals does not give any further statistical improvement in the fit.
A similar analysis was performed also on the EPIC-pn spectrum of NGC 1313 X-2, following the same approach outlined above. Also in this case the spectrum shows some residuals at an energy of 0.6 keV. In order to test the influence of ISM absorption models (due to the neutral Oxygen absorption edge, see Miller et al. 2004) on the detection of an O line in NGC 1313 X-1, we repeated our analysis using the Tübingen-Boulder absorption model (TBABS; Wilms et al. 2000, Table 1), that includes a treatment of gas-phase ISM with revised photoionization cross sections and revised abundances (plus the contribution of grain-phase ISM and molecules). The improvement obtained adding a gaussian component to a TBABS+MCD+PL continuum is at the level. The line energy is 0.6 keV, while the line width was frozen in the fit (0.01 keV). The significance of the line remains fairly high even performing a fit in a restricted energy region (0.3–1.0 keV) around the centroid of the gaussian. Fitting the continuum with an absorbed MCD+PL model, the addition of a gaussian component with fixed width (0.01 keV) gives an improvement at the level.
Additional information on the line properties were obtained analyzing the line profiles. After freezing the best fitting continuum of Table 1 and removing the gaussian components, residuals (normalized to the continuum) were fitted with a constant (equal to unity) plus a gaussian profile, obtaining the lines centroid energies and equivalent widths. The energies are consistent (within the errors) with those derived from the spectral fits, while the equivalent widths are all below 100 eV. A thorough analysis of these data and new XMM observations of NGC 1313 X-1 and X-2 will be presented in Mucciarelli et al. (2005, in preparation).
3 The optical counterpart of NGC 1313 X-2
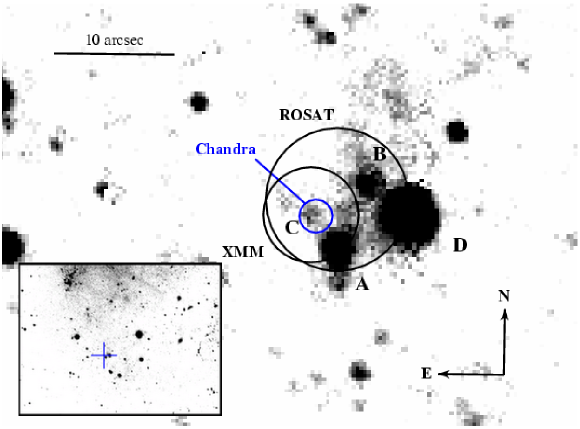
Optical images of the field of NGC 1313 X-2 in the -band were taken on 16 January 2002 with the 3.6 m telescope of the European Southern Observatory (ESO) at La Silla (Chile). Four images were obtained for a total exposure time of 1320 s (see Z04 for details). The accuracy of the astrometric calibration, performed with GSC2 ESO field stars, is 0.3 (1-). The X-ray position of NCG 1313 X-2 was obtained from a 2002 Chandra pointing with an accuracy of 0.7 (Z04). The astrometric calibration of the optical and Chandra images was checked using the very accurate radio position of SN 1978K (Ryder et al. 1993, Z04). Our Chandra position of NGC 1313 X-2 is shown in Figure 2, together with the ROSAT HRI (Schlegel et al., 2000) and XMM EPIC (Miller et al., 2003) error boxes, overlaid on our ESO image. All measurements are consistent within 1-. Object C () is inside the Chandra error box and its position coincides within 1- with that of NGC 1313 X-2, making it a likely counterpart and ruling out the previous proposed counterpart, object A. From the maximum absorbed X-ray flux of NGC 1313 X-2 ( erg cm-2 s-1) and optical magnitude of object C, we estimate .
4 Discussion
The X-ray spectral parameters, in particular the temperature of the MCD fit (), can be used to estimate the BH mass. From the effective temperature of a standard accretion disk, under the assumption that represents an estimate of the maximum disk temperature, Z04 infer (where is a color correction factor). The temperature obtained from the two-components fit to the XMM spectrum (Table 1) implies for NGC 1313 X-1/X-2 (assuming and Eddington limited accretion).
Up to now evidence of emission lines in ULXs has been reported in M82 X-1 (Strohmayer et al., 2003), NGC 4559 X-10 (Cropper et al., 2004) and M101 ULX-1 (Kong et al., 2005). The presence of an Oxygen line in the EPIC-pn spectrum of NGC 1313 X-1 appears to be significant at above while the statistical evidence of other features is at most marginal (). The simplest interpretation is that we are observing typical emission features of intermediate mass elements left over after the explosion of one or more supernovae belonging to the stellar association of massive stars where the two ULXs are probably embedded.
Concerning NGC 1313 X-2, the luminosity inferred from the apparent magnitude of object C is consistent with a main sequence star or a evolved OB supergiant making NGC 1313 X-2 a High-Mass X-ray Binary. This picture seems to be confirmed also by the study of the environment of NGC 1313 X-2 (see Z04) and by the association of both ULXs with extended optical emission nebulae (Pakull & Mirioni, 2002).
References
- Cropper et al. (2004) Cropper, M. et al. 2004, MNRAS, 349, 39-51, Probable intermediate-mass black holes in NGC 4559: XMM-Newton spectral and timing constraints
- Kaaret et al. (2003) Kaaret, P., Corbel, S., Prestwich, A.H., & Zezas, A. 2003, Science, 299, 365-368, Radio Emission from an Ultraluminous X-ray Source
- King et al. (2001) King, A.R., et al. 2001, ApJL, 552, L109-L112, Ultraluminous X-Ray Sources in External Galaxies
- Kong et al. (2005) Kong, A.K.H., Rupen, M.P., Sjouwerman, L.O., & Di Stefano, R. 2005, paper presented at the XXII Texas Symposium on Relativistic Astrophysics, Stanford University, Dec. 13-17, 2004 (astro-ph/0503465), Multiwavelength Observations and State Transitions of an Ultra-luminous Supersoft X-ray Source: Evidence for an Intermediate-Mass Black Hole
- Miller & Colbert (2004) Miller, M.C., & Colbert, E.J.M., 2004, Int. Jour. of Modern Physics, 13, 1-64, Intermediate-Mass Black Holes
- Miller et al. (2004) Miller, J.M., Fabian, A.C., & Miller, M.C. 2004, ApJ, 607, 931-938, Revealing a Cool Accretion Disk in the Ultraluminous X-Ray Source M81 X-9 (Holmberg IX X-1): Evidence for an Intermediate-Mass Black Hole
- Miller et al. (2003) Miller, J.M., Fabbiano, G., Miller, M.C., & Fabian, A.C. 2003, ApJL, 585, L37-L40, X-Ray Spectroscopic Evidence for Intermediate-Mass Black Holes: Cool Accretion Disks in Two Ultraluminous X-Ray Sources
- Pakull & Mirioni (2002) Pakull, M.W., & Mirioni, L. 2002, in Proc. ESA Symp., New Visions of the X-ray Universe in the XMM-Newton and Chandra Era, eds. F. Jansen et al. (ESA SP-488) (astro-ph/0202488), Optical Counterparts of Ultraluminous X-ray Sources
- Ryder et al. (1993) Ryder, S. et al. 1993, ApJ, 416, 167-181, SN 1978K: an Extraordinary Supernova in the Nearby Galaxy NGC 1313
- Schlegel et al. (2000) Schlegel, E.M., Petre, R., Colbert, E.J.M., & Miller, S. 2000, AJ, 120, 2373-2382, A Deep ROSAT HRI Observation of NGC 1313
- Strohmayer et al. (2003) Strohmayer, T.E., & Mushotzky, R.F., 2003, ApJL, 586, L61-L64, Discovery of X-Ray Quasi-periodic Oscillations from an Ultraluminous X-Ray Source in M82: Evidence against Beaming
- Wilms et al. (2000) Wilms, J., Allen, A., & McCray, R., 2000, ApJ, 542, 914-924, On the Absorption of X-Rays in the Interstellar Medium
- Zampieri et al. (2004) Zampieri, L., et al. 2004, ApJ, 603, 523-530, The Ultraluminous X-Ray Source NGC 1313 X-2 (MS 0317.7-6647) and Its Environment
| Model | [keV] | Parameters | (dof) | ||
| NGC 1313 X-1 | |||||
| WABS(MCD+PL) | 1.12(301) | ||||
| TBABS(MCD+PL) | 4.21 | 1.69 | 0.19 | 1.10(301) | |
| TBABS(MCD+PL+GAUSS) | 4.48 | 1.79 | 0.17 | keV | 1.04(299) |
| NGC 1313 X-2 | |||||
| WABS(MCD+PL) | 1.21(109) | ||||