Extinction law variations and dust excitation in the spiral galaxy NGC 300
Abstract
We investigate the possible origin of the strong radial gradient in the ultraviolet-to-infrared ratio in the nearby late-type spiral galaxy NGC 300, and emphasize the importance of local variations in the geometry of the interstellar medium, concluding that they cannot be neglected with respect to metallicity effects. This analysis is based upon a combination of maps obtained both from space using GALEX (1350 to 2750 Å) and Spitzer (3 to 160 m), and from the ground (UBVRI, H and H). We select ionizing stellar clusters associated with H II regions of widely varying morphologies, and derive their fundamental parameters from population synthesis fitting of their spectral energy distributions, carefully measured to eliminate local background emission accurately. From these fits, we conclude that the stellar extinction law is highly variable in the line of sight of young clusters of similar ages. In the particular model geometry that we consider most appropriate to the sampled regions, we checked that our findings are not significantly altered by the correct treatment of radiative transfer effects. The variations are systematic in nature, in the sense that extinction laws of the Milky Way or LMC type, with a prominent 2175 Å absorption feature and a modest far-ultraviolet slope, are associated with compact H II regions (the compacity being quantified in two different ways), while clusters surrounded by diffuse H II regions follow extinction laws of the 30 Doradus or SMC type, with a weaker 2175 Å feature and a steeper far-ultraviolet rise. The Calzetti starburst attenuation law, although most often degenerate with the 30 Doradus extinction law, overpredicts ionizing photon fluxes by large amounts. We also find that the extinction law variations are correlated with the column density of dust species emitting in the near- and mid-infrared. Finally, we briefly discuss the nebular to stellar extinction ratios, and the excitation of aromatic band carriers, invalidating their claimed association with cold dust.
1 Introduction
NGC 300 is a gas-rich galaxy of Sd type, at a distance of only 2.1 Mpc (Freedman et al., 1992). Its total extent in the blue light is over 20′, and its inclination on the line of sight, derived from H I kinematics, is about 50° (Puche et al., 1990). It contains numerous bright H II complexes (Sérsic, 1966; Deharveng et al., 1988) and forms stars at a current total rate of about 0.15 M☉ yr-1 (Helou et al., 2004). NGC 300 was targetted for surveys of supernova remnants ; between 20 and 40 candidates were found by various selection methods (Blair & Long, 1997; Pannuti et al., 2000; Payne et al., 2004), evidence that star formation has been going on for an extended period at a significant rate. Large numbers of Wolf-Rayet stars were also found (Breysacher et al., 1997; Schild et al., 2003). The oxygen abundance in the nebular gas phase varies between about 1.4 to 0.4 times the solar neighbourhood value, from the center up to a radial distance of about 10′ (Deharveng et al., 1988).
Many bubble-like structures are seen in the H emission, especially in the outer disk, where they reach diameters of pc. About 50% of the total H flux arises from the diffuse ionized gas component (Hoopes et al., 1996). Judging from the morphology of H II regions and the position of the most likely exciting sources, the hydrogen gas may be ionized very far away from young clusters (in projected distance). This argues for the existence of aged star-forming sites and a high degree of porosity of the interstellar medium around them. The large number of resolved stellar clusters and the variety of their associated H II regions, observed at a resolution of a few tens of parsecs, make it possible to study in great detail general patterns in the extinction and dust heating within a single galaxy.
Deriving spatially-resolved extinction in galaxies of different types, and determining how the extinction law is affected by properties of the interstellar medium such as metallicity and geometric configuration, is a first step toward assessing the validity of common recipes used to correct for extinction the global ultraviolet emission of galaxies. This knowledge is fundamental to obtaining good prescriptions to estimate star formation rates and ages from current and future ultraviolet and infrared surveys.
In this paper, we analyse jointly images of the stellar light from the far-ultraviolet to the far-red, of the hydrogen recombination emission in the H and H lines, and of the infrared emission from 3 to 160 m. The data are described in Section 2. After deriving large-scale infrared-to-ultraviolet ratio and extinction maps (Section 3), we focus on individual star-forming complexes selected in H and in the ultraviolet, and constrain the fundamental properties of ionizing stellar clusters, to assess how critically the extinction law and excitation of mid-infrared emitting dust at these spatial scales depend on the local geometry of the interstellar medium (Section 4). The results are discussed topic by topic in Section 5, and summarized in Section 6.
2 Data
2.1 Ultraviolet images
NGC 300 was observed with the GALEX space telescope in the FUV and NUV bands at effective wavelengths of 1516 and 2267 Å (Martin et al., 2005; Morrissey et al., 2005). GALEX has a circular field of view of 1.2° in diameter, and observations are performed in a spiral dither pattern. The data from the photon-counting, multichannel-plate detectors were processed with the analysis pipeline operated by the Caltech Science Operations Center, which converts the photon lists into flux-intensity images and applies flat-fielding and first-order geometric distortion corrections. The absolute calibration is derived from ground test data which show good agreement, to within 10%, with observations of white dwarf standard stars (Morrissey et al., 2005). See also the GALEX Atlas of galaxies (Gil de Paz et al., 2005), where NGC 300 is included, for more information.
The angular resolution is of the order of 5″ (FWHM), but varies with source brightness and position across the field. In particular, the point spread function in the FUV band is slightly elliptical (elongated along the south-east to north-west direction) in some parts of the map. A first distortion correction between the NUV and FUV maps was estimated using Legendre polynomials of order 4 and cross-correlating the positions of about 900 stars and clusters. Distortion residuals and point spread function variations were handled separately for each individual sub-field of size ′, by fitting nearby point sources with gaussians in the FUV, NUV and U bands.
2.2 Infrared images
Broadband infrared images were acquired with the Spitzer space telescope at effective wavelengths of 3.6, 4.5, 5.7, 8.0, 24, 71 and 156 m, and were first discussed by Helou et al. (2004). The data processing and mosaicing is also described in this paper. The angular resolution (full width at half maximum) of the mosaics is 2.5 to 3″ between 3.6 and 8 m, 5.7″ at 24 m, 16″ at 70 m and 38″ at 160 m.
The mid-infrared bands record gradually varying contributions, as a function of wavelength, from stars and dust, the global 3.6 m emission being dominated by photospheres, the global 8 m emission deriving mainly from aromatic band carriers, and longer-wavelength bands covering essentially the thermal continuum from very small to big dust grains.
The photospheric component was subtracted from the 8 m map as explained in Helou et al. (2004). A model for intermediate to old stellar populations was derived from the Starburst99 population synthesis model (Leitherer et al., 1999), and was found to be remarkably invariant for solar and half-solar metallicities, and a broad range of star formation histories (excluding very young populations). Assuming that the 3.6 m emission is entirely of stellar origin, this map was then used to normalize the photospheric spectrum at each point, to which the relevant filter transmission curves were applied. This procedure may be inaccurate locally, because of the contribution from young stars, but the 8 m emission is heavily dominated by dust in star-forming regions, so that neglecting young stellar populations should not introduce any significant error.
2.3 Optical images
Mosaics in the UBVI bands of ′ were obtained from S.C. Kim (Kim et al., 2004, private communication). An R-band mosaic of ′ and H+[N II] and H maps in narrowband filters (in a field of view of ′) were acquired at the Las Campanas du Pont 2.5 m telescope with the direct CCD camera. The angular resolution in all the broadband optical images, after the mosaicing and the geometric transformations applied to align them, is of the order of 1.7″ to 2″ (FWHM).
We also made use of an H mosaic covering the same field as the R-band mosaic to measure the H flux of the outermost H II regions ; the residual background was subtracted locally in each subfield separately. The map acquired by Hoopes et al. (1996), which was kindly provided to us by Charles Hoopes, supplied a means of checking the H+[N II] flux calibration, by comparing aperture photometry measurements on several bright H II complexes in both maps ; fluxes from the map of Hoopes et al. (1996) are systematically lower by about 10%.
The H photometric accuracy, however, is much more uncertain, because this line has a much smaller equivalent width than the H line, and larger errors are introduced by continuum subtraction and correction for stellar absorption features. Because of these uncertainties, if no flux correction is applied, the H/H decrement values are unphysical in the case B recombination assumption, and in disagreement with published values for individual H II regions. In order to correct them and derive an estimate of the nebular extinction from H and H photometry, we scaled the decrement in such a way that extinction values derived by Webster & Smith (1983) from spectro-photometry for 5 regions could be reproduced. We used an intrinsic H/H ratio of 2.86, appropriate for electronic densities and temperatures cm-3 and K, respectively, and replaced the extinction law assumed by Webster & Smith (1983) with the Cardelli et al. (1989) law. This procedure requires that the raw H/H flux ratio be underestimated by 30% on average. Applying the above correction, the derived global extinction (from total fluxes in the H field of view) is A(H) = 0.5 mag.
3 Large-scale UV/IR ratio and extinction
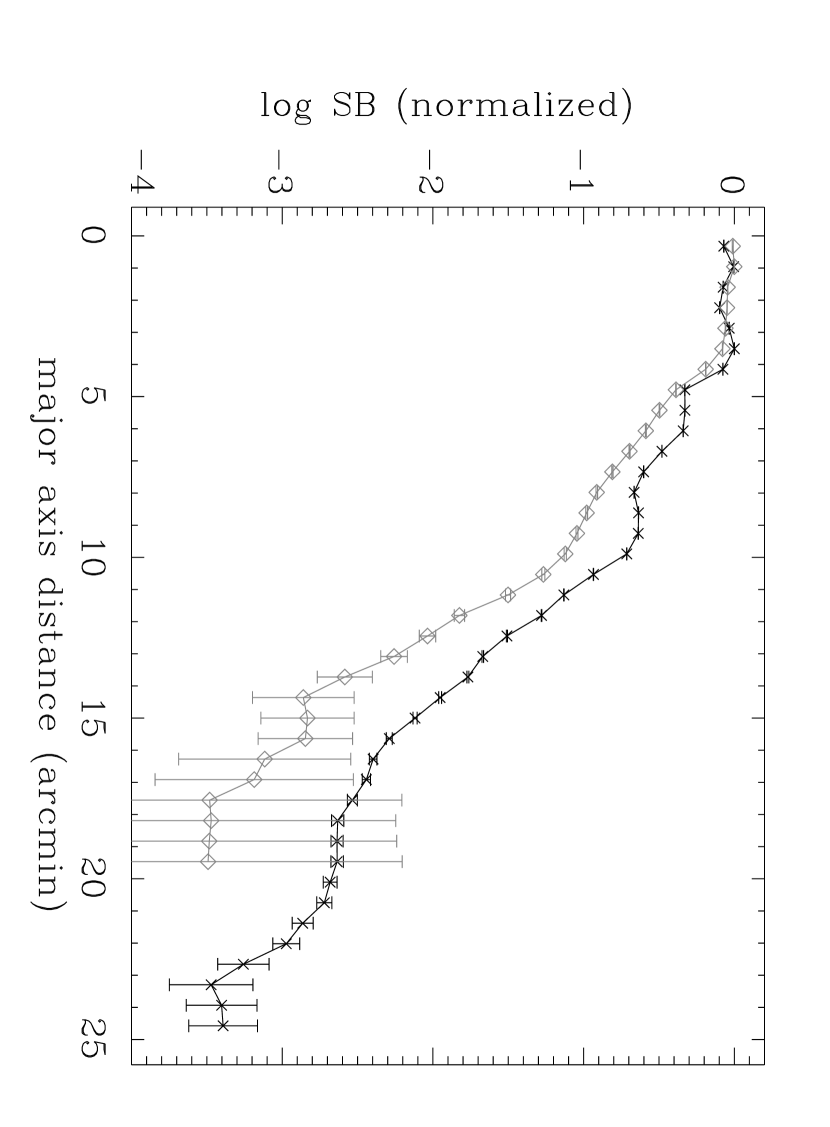
The ultraviolet disk reaches much farther out than the infrared disk. To quantify this statement, we convolved all maps to the resolution of the 160 m map, and estimated the total infrared emission (TIR) from a linear combination of the 24, 70 and 160 m powers (Dale & Helou, 2002). To reach the 160 m full width at half-maximum, the maps at wavelengths up to 24 m were first convolved with a model of the point spread function at 70 m111which can be found on the website: http://ssc.spitzer.caltech.edu/mips/psf.html . ; these and the 70 m map were then convolved with gaussians of the appropriate widths. We computed surface brightness profiles in the FUV band and in the TIR, averaged in elliptical annuli to account for the inclination of NGC 300 (Fig. 1). The FUV band was preferred over the NUV band for this comparison, because while the ratio of the extinction in these two bands is close to 1 (smaller than 1.3 for various extinction laws), the intrinsic FUV/NUV ratio of young stellar populations is , the FUV band avoids the variable 2175 Å feature of the interstellar extinction curve (see Section 5.4), and the FUV band is minimally contaminated by foreground stars. On average, the FUV/TIR ratio increases exponentially with deprojected distance from the center, with irregularities mainly due to the FUV emission being less smooth than the infrared emission. The FUV/TIR ratio increases by at least a factor 5, maybe up to a factor 10, between the center and the outermost regions where it is still measurable. Also shown in Figure 1 is the opposite of the average slope of the metallicity gradient as derived by Deharveng et al. (1988). The slope of the FUV/TIR gradient is very similar, although somewhat smaller. At any given distance from the center, however, the dispersion in FUV/TIR ratios among individual star-forming regions is at least a factor 2, whereas the standard deviation of abundances is only of 0.11 dex, which seems to indicate that metallicity effects are not solely responsible for the FUV/TIR gradient. The UV-brightest regions tend to be deficient in infrared emission compared with their fainter counterparts. From studies of large samples of galaxies, a clear decrease of the global ultraviolet to infrared flux ratio was found as a function of a measure of the star formation rate (Wang & Heckman, 1996), or as a function of the blue luminosity (Buat & Burgarella, 1998) or the stellar mass (Pierini & Möller, 2003). Interpreting the ultraviolet to infrared ratio variations within resolved galaxies could help constrain the underlying causes of this behavior.
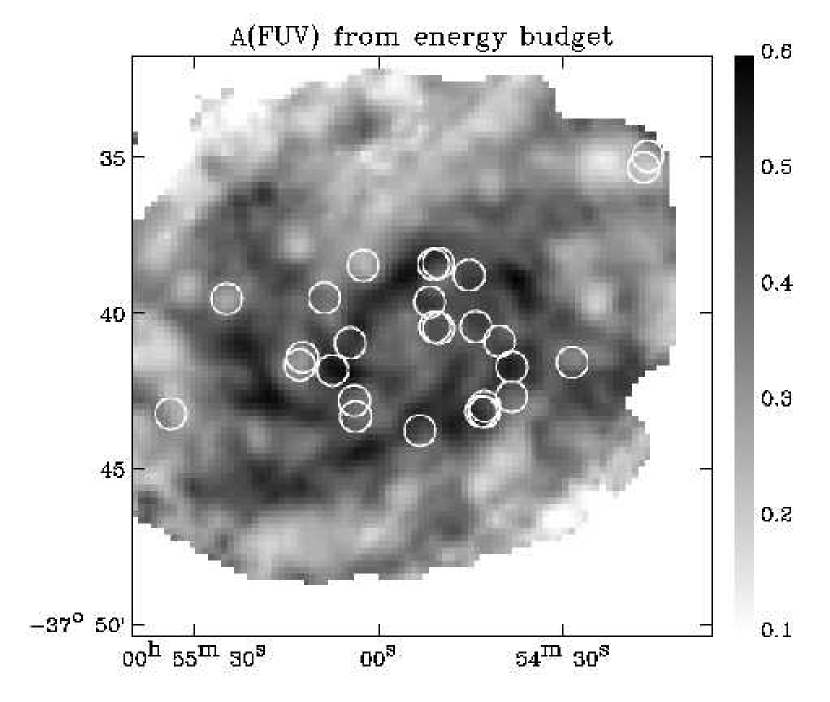
A stellar extinction map of NGC 300 can be derived from a simple energy balance calculation, using all the maps between 1516 Å and 3.5 m to reconstruct the stellar emission. The emerging fluxes in the FUV, NUV, UBVRI and IRAC1 (3.5 m) bands were interpolated by realistic stellar spectral energy distributions, using the actual filter transmission curves. Assuming several different extinction laws, the power absorbed in this range is set equal to the total power emitted in the infrared. The derived A(FUV) ranges between 0.1 and 0.6 (A(V) between 0 and 0.23). Uncertainties of 20% in the flux calibration at both 70 and 160 m could increase the A(FUV) extinction values by 0.05 mag.
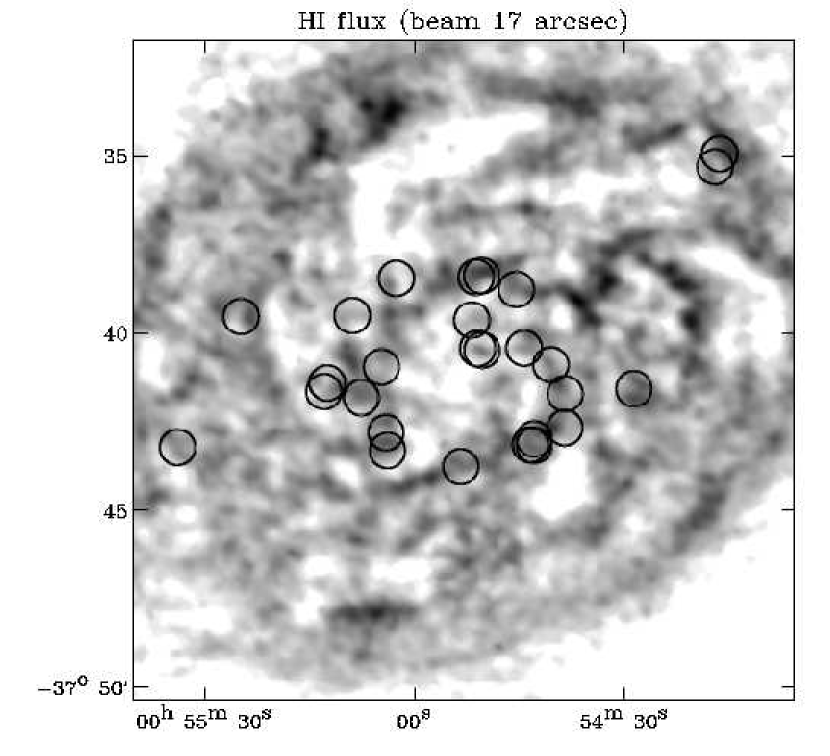
The large H II complexes including shell-like structures correspond to regions of lower extinction, consistent with the idea that they are aged star-forming sites having partly dispersed the molecular and dust material around them. The correspondance with gas column density cannot be tested because no map in a molecular transition is available. The H I map of Puche et al. (1990), with a beam size of 17″, allows us to see partial correspondance with the H I column density, though, especially in the outer disk (Fig. 5) ; the fact that there is no robust correlation with the extinction map is expected because H I does not trace adequately the total gas mass, which is usually dominated by the molecular phase in the inner parts of the disk where star formation is taking place actively.
The radial profile of the ratio of the total stellar power (integrated between 1000 Å and 3.5 m) to the total infrared power is notably different from the FUV/TIR profile: it shows a sharp decline from the center up to the pseudo-ring of most active star formation, reaching a minimum around a radial distance of 3 to 4′, then rises again to reach its central value at a radial distance close to 10′.
Several effects can contribute to the large-scale FUV/TIR gradient.
1) The most obvious possibility is the variations in metallicity,
which are expected to cause direct variations in the dust to gas ratio.
However, various lines of evidence suggest that other parameters play
a more fundamental role. Although the global dust to gas ratio of galaxies
seems correlated with the far-infrared surface density (Andreani et al., 1995),
which traces both the column density of dust and the star formation rate
surface density, the dust to H I mass ratio of irregular galaxies
is highly variable but not correlated with metallicity (Hunter et al., 1989).
Sauvage et al. (1990) also showed that the far-infrared to blue flux ratio
of dwarf galaxies is not correlated with their oxygen abundance. Within NGC 300,
the nebular gas phase metallicity gradient, as determined by Deharveng et al. (1988),
is slightly steeper than the FUV/TIR gradient. Interestingly, Bot et al. (2004)
found that the dust to gas ratio of the Small Magellanic Cloud is much
lower than expected from a linear scaling with metallicity, although the
situation may differ between star-forming regions and the diffuse
interstellar medium.
2) The large-scale variations of the FUV/TIR ratio may also be affected
significantly by the cumulative effects of local variations in the
geometry of the sources. Several factors can contribute to systematically
increase the distance between stellar clusters and the absorbing dust,
notably: a decrease in the volume density of all the phases of the
interstellar medium ; the maturity of the star forming regions,
i.e. the outer disk could contain slightly more evolved young stellar
populations which have had time to disperse gas and dust away.
Aged star formation complexes indeed seem to efficiently increase
the porosity of the surrounding interstellar medium, because they are
associated with diffuse, shell-like H II regions, and are
affected by lower extinction.
3) The spectral energy distribution of the heating radiation could
change in such a way that the total dust heating efficiency decreases.
The fraction of the total stellar power emitted in the FUV band
varies from less than 2% in the central region of the galaxy to
about 5% in the outermost part of the disk, at and beyond a radial
distance of 10′ (the whole SED being corrected for extinction).
The non-ionizing part of the stellar radiation thus becomes on average
more energetic in the outer disk (the old populations have a smaller
scale length than the younger populations emitting in the ultraviolet),
and the dust heating balance should shift progressively from big grains
emitting in the far-infrared to smaller grains emitting in the mid-infrared,
which could explain part of the far-infrared flux deficit. We indeed
observe a slight increase of the fraction in the outer
disk (by about 30-40% compared with the annulus of intense star formation).
However, this increase is too modest to account for the FUV/TIR gradient,
which is mirrored closely by a similar gradient.
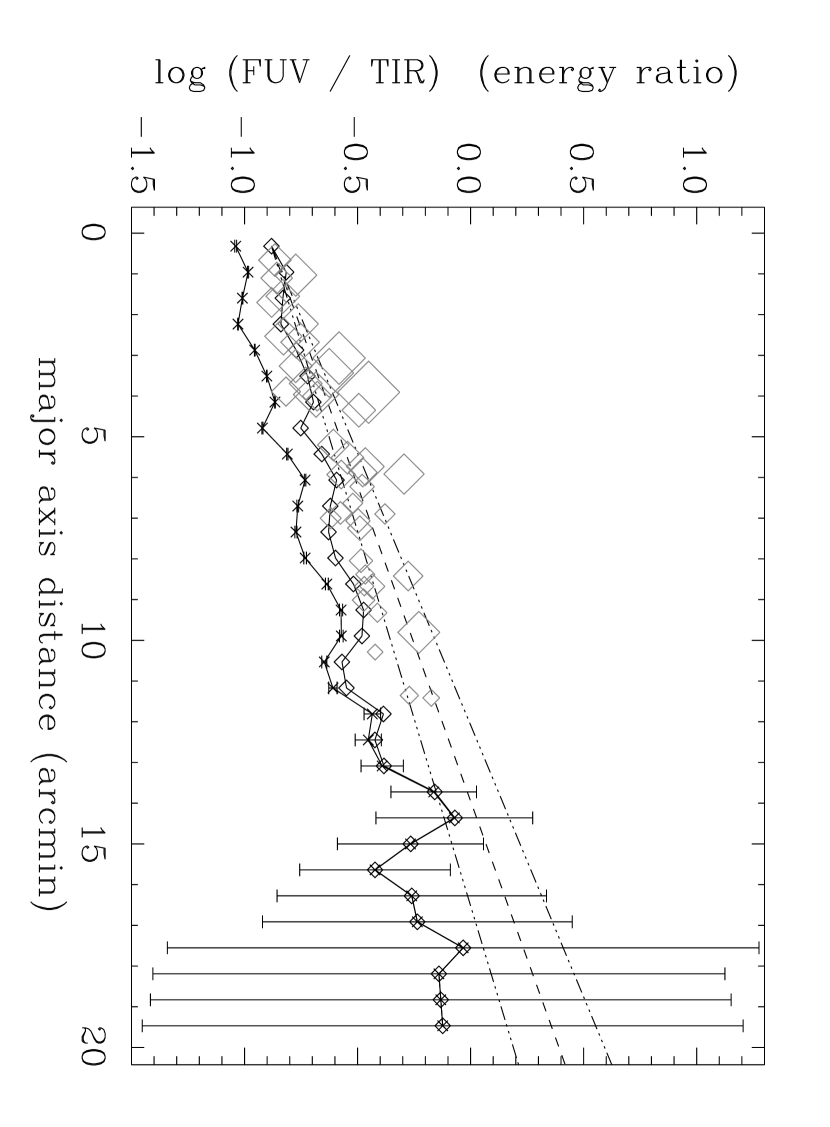
Figure 2 shows the radial profile of the FUV/NUV energy ratio, which decreases on average beyond a radial distance of ′. Such a decrease of the FUV/NUV ratio in the outermost part of the disk cannot be explained by extinction or metallicity effects. It thus seems reasonable to assume that a gradient exists in the age of the youngest stellar populations which radiate in the ultraviolet. The range of FUV/NUV colors observed at large scales corresponds to average stellar population ages between about 16 Myr at radial distances near 10′, and Myr in the outermost disk.
In order to assess the role played by the geometry of the interstellar medium in the FUV/TIR variations, and to distinguish between the causes mentioned above, we now turn to individual H II complexes showing a wide range of morphologies, presumably corresponding to very different geometries. We take advantage of the high spatial resolution of the data from the UV to the near-infrared, and characterize individual stellar clusters or small groups of clusters. If each one consists of coeval populations, then it is possible to lift the star-formation history degeneracy that affects the large-scale emission.
4 Small-scale properties of H II complexes
4.1 Selection of H II regions/young stellar clusters
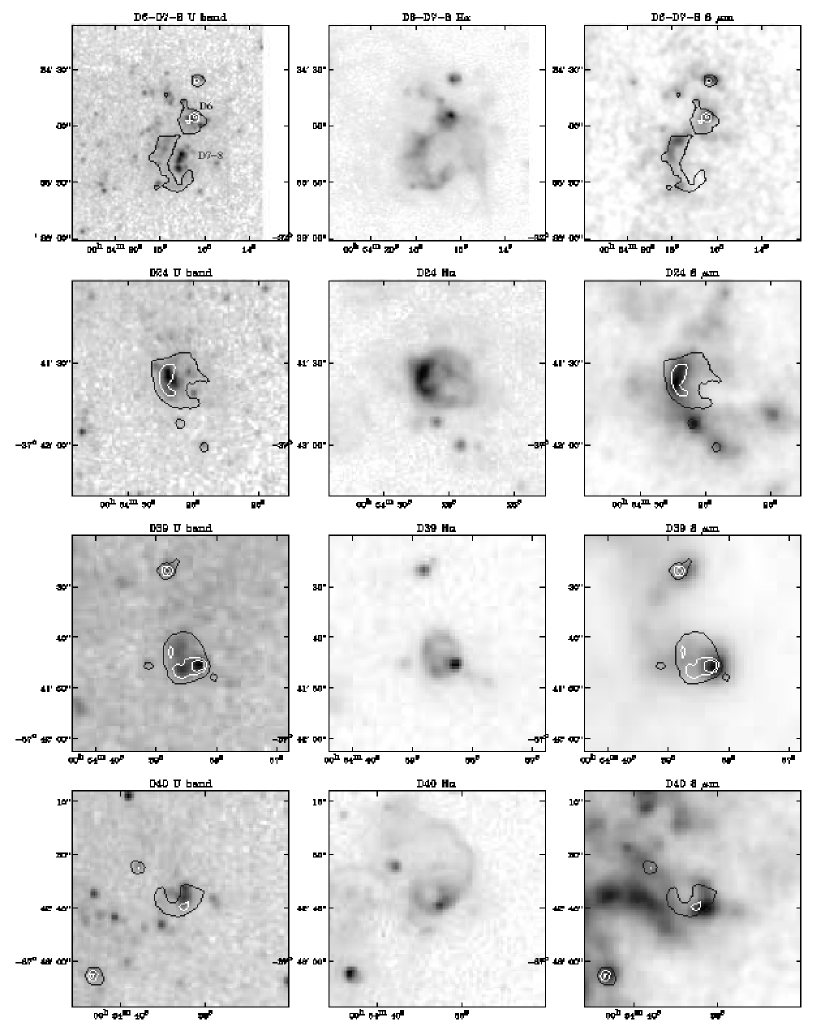
We selected individual stellar clusters or groups of clusters associated with prominent H II regions, that are visible in all the optical bands and sufficiently bright in the FUV and NUV bands to allow accurate photometry. Because of the selection method, the sample is biased against highly obscured regions, for which the analysis described in Section 4.3 would not be possible. Bright 24 m sources which are not detected in the ultraviolet are discussed in Section 5.7. We also avoided objects with very complicated structure (making the identification of the clusters ionizing a particular HII region ambiguous), with contamination by foreground stars or blending with nearby regions. The sample covers a large range of morphologies, mid-infrared colors, and UV to infrared ratios. They were labelled according to the H II region which they excite, in the catalog of Deharveng et al. (1988) (but the letter sublabels follow a different convention). Detailed notes, pertaining both to the morphology and to the modelling results, can be found in Appendix A. Images of the cluster fields in the U band, in H and at 8 m are shown in Figure 6.
Table 1 lists, for each group of clusters, the initial diameter of the stellar photometric aperture (see Sect. 4.2) and some observables: the H flux (corrected for an average [N II] contribution to the total H+[N II] flux of 10%), the nebular extinction derived from the H/H decrement, and the H/R ratio measured within the stellar photometric area, R referring to line-subtracted broadband flux (i.e. pure stellar emission). H equivalent widths can be obtained by multiplying H/R by 1262 Å (the equivalent width of the R filter). We also measured the ratio at the peak of the 24 m emission (which can be offset from both the exciting clusters and the peak of the H emission), within a resolution element (2.5 times the 24 m FWHM, except for confused regions for which the aperture was reduced to the FWHM in order to avoid neighboring sources), after convolving the 8 m map to the 24 m angular resolution.
| name | RA DEC (J2000) | aa This is the diameter encompassing the pixels selected for the measurement of the cluster fluxes (see Section 4.2 for details on the photometric procedure). | (H) | (H) | H/R | |
|---|---|---|---|---|---|---|
| (h m s) (° ′ ″) | (arcsec) | ( W m-2) | (mag) | (peak) | ||
| D6 | 18.0 | 139. | … | 0.44 | 3.32 | |
| D7-8 | 33.6 | 652. | … | 0.15 | 1.93 | |
| D24 | 24.0 | 549. | 0.38 | 0.38 | 1.30 | |
| D39 | 12.0 | 172. | 0.82 | 0.87 | 1.76 | |
| D40 | 14.4 | 173. | 0.15 | 0.28 | 0.94 | |
| D45 | 10.8 | 363. | 0.81 | 0.41 | 0.93 | |
| D53a | 6.0 | 156. | 0.79 | 1.11 | 3.42 | |
| D53b | 8.4 | 365. | 0.69 | 0.80 | 2.64 | |
| D53c | 10.8 | 380. | 0.39 | 0.11 | ||
| D56 | 9.6 | 109. | 0.85 | 0.70 | 1.00 | |
| D61 | 12.0 | 255. | 0.62 | 0.75 | 1.21 | |
| D76a | 8.4 | 123. | 0.88 | 0.69 | 0.97 | |
| D76b | 7.2 | 93. | 0.59 | 0.43 | 1.31 | |
| D77 | 12.0 | 407. | 0.38 | 0.47 | 2.07 | |
| D79 | 16.8 | 323. | 0.55 | 0.46 | 1.76 | |
| D84 | 12.0 | 316. | 0.66 | 0.90 | 2.22 | |
| D88-90 | 33.6 | 435. | 0.51 | 0.32 | 1.36 | |
| D115 | 36.0 | 327. | 0.37 | 0.04 | 1.21 | |
| D118 | 30.0 | 753. | 0.65 | 0.33 | 2.27 | |
| D119 | 26.4 | 985. | 0.49 | 0.47 | 2.22 | |
| D122 | 14.4 | 149. | 1.06 | 0.63 | 1.06 | |
| D127 | 10.8 | 104. | 0.70 | 0.59 | 0.94 | |
| D129 | 15.6 | 109. | 0.58 | 0.51 | 0.99 | |
| D137a | 13.2 | 919. | 0.41 | 0.27 | 3.43 | |
| D137b | 28.8 | 938. | 0.57 | 0.20 | 1.21 | |
| D147 | 26.4 | 148. | … | 0.10 | 1.04 | |
| D159 | 24.0 | 196. | … | 0.31 | … |
Table 1 also indicates the association of the H II regions with supernova remnants in the catalogs of Pannuti et al. (2000), Payne et al. (2004) and Blair & Long (1997). We fail to see any direct connection between the presence of a supernova remnant and the morphology of the H II region, as some of these are classified here as compact (see in Section 5.4 the discussion about a quantification of the compactness of the H II regions, and the significance of this parameter in interpreting the results). Among these catalogued remnants, weak X-ray sources are found close to D40, D45, and D53 ; the radio sources are all very weak, and some have flat radio spectral indices, consistent with thermal emission. Such is the case for the regions D61, D77, D84. The influence of these candidate young supernova remnants on the surrounding interstellar medium is thus unclear, and the shell-like structures visible in the H emission may correspond to older events.
4.2 Photometry
Special care was devoted to refine the photometric method so as to obtain accurate spectral energy distributions for the young clusters. In order to remove the local background from old populations, we devised a method appropriate to the combination of UV and optical data. We had to take into account the facts that the underlying emission can vary significantly on the scale of the considered regions, that its brightness relative to that of the clusters is variable from one band to the other, increasing with wavelength and being very high in the R and I bands, and that confusion makes any simple aperture always contaminated by old stellar populations and foreground stars. We define two diameters, constraining the source to be contained within the smaller () and estimating the background within the larger (). Using the U band, where the background and contamination by old populations are minimal, we then determine refined photometric “apertures” in the following way. The average brightness and standard deviation of the background in are computed iteratively in a narrowing brightness interval ( where is the standard deviation at each step) until convergence is achieved. Then, the source flux is summed over the pixels above within and the background averaged over the pixels below within (not excluding ). Then, we use the exact same pixels to compute the source flux and background in all the other optical bands, which have been previously aligned to within 0.2 arcsec, and control the results visually to ensure that no visible foreground star contaminates the aperture, and that and were appropriately chosen. We find that this method produces significantly better results than by measuring the background in a concentric annulus or another aperture centered on a nearby empty patch. For clusters that appear single in the optical bands, we obtain good fits with a single-population model, which is not the case when we use the alternative methods above.
| name | FUV | NUV | U | B | V | R | I |
|---|---|---|---|---|---|---|---|
| (Jy) | |||||||
| D6 | %) | %) | %) | %) | %) | %) | %) |
| D7-8 | %) | %) | %) | %) | %) | %) | %) |
| D24 | %) | %) | %) | %) | %) | %) | %) |
| D39 | %) | %) | %) | %) | %) | %) | %) |
| D40 | %) | %) | %) | %) | %) | %) | %) |
| D45 | %) | %) | %) | %) | %) | %) | %) |
| D53a | %) | %) | %) | %) | %) | %) | %) |
| D53b | %) | %) | %) | %) | %) | %) | %) |
| D53c | %) | %) | %) | %) | %) | %) | %) |
| D56 | %) | %) | %) | %) | %) | %) | %) |
| D61 | %) | %) | %) | %) | %) | %) | %) |
| D76a | %) | %) | %) | %) | %) | %) | %) |
| D76b | %) | %) | %) | %) | %) | %) | %) |
| D77 | %) | %) | %) | %) | %) | %) | %) |
| D79 | %) | %) | %) | %) | %) | %) | %) |
| D84 | %) | %) | %) | %) | %) | %) | %) |
| D88-90 | %) | %) | %) | %) | %) | %) | %) |
| D115 | %) | %) | %) | %) | %) | %) | %) |
| D118 | %) | %) | %) | %) | %) | %) | %) |
| D119 | %) | %) | %) | %) | %) | %) | %) |
| D122 | %) | %) | %) | %) | %) | %) | %) |
| D127 | %) | %) | %) | %) | %) | %) | %) |
| D129 | %) | %) | %) | %) | %) | %) | %) |
| D137a | %) | %) | %) | %) | %) | %) | %) |
| D137b | %) | %) | %) | %) | %) | %) | %) |
| D147 | %) | %) | %) | %) | %) | %) | %) |
| D159 | %) | %) | %) | %) | %) | %) | %) |
Since the point spread function of the GALEX images varies across the field of view and is slightly elliptical in the FUV band, and because of residual distortion between the FUV and NUV images, we had to refine the photometric technique for the GALEX bands. In each small field around a selected cluster, we use point sources to fit positional offsets with respect to the optical images, and we determine the FWHM of the cluster independently in the FUV and NUV bands. In a few instances, where the selected cluster is partially confused by nearby clusters, we fitted and removed the latter before performing aperture photometry on the target. In a few cases when we have to truncate the aperture to avoid confusion, we apply an aperture correction, computed assuming that the source is perfectly gaussian. The measured broadband fluxes are listed in Table 2.
4.3 Stellar population fits
We used the Starburst99 synthesis model (Leitherer et al., 1999) to compute spectra of instantaneously-formed stellar clusters, with the metallicity , well suited to NGC 300, and a Salpeter initial mass function between 0.1 and 120 M⊙.
The transmission curves of the filters used in the observations were applied
to the model spectra before doing any comparison between the models and
the measured fluxes. For the optical filters, we used the definitions of
the Johnson-Cousins system given by Fukugita et al. (1995) and the references
therein. For the ultraviolet and infrared filters, we used the actual
transmission curves of GALEX222available from the website:
http://galexgi.gsfc.nasa.gov/tools/Resolution_Response/index.html .
and Spitzer333available from:
http://ssc.caltech.edu/irac/spectral_response.html
and http://ssc.caltech.edu/mips/spectral_response.html ..
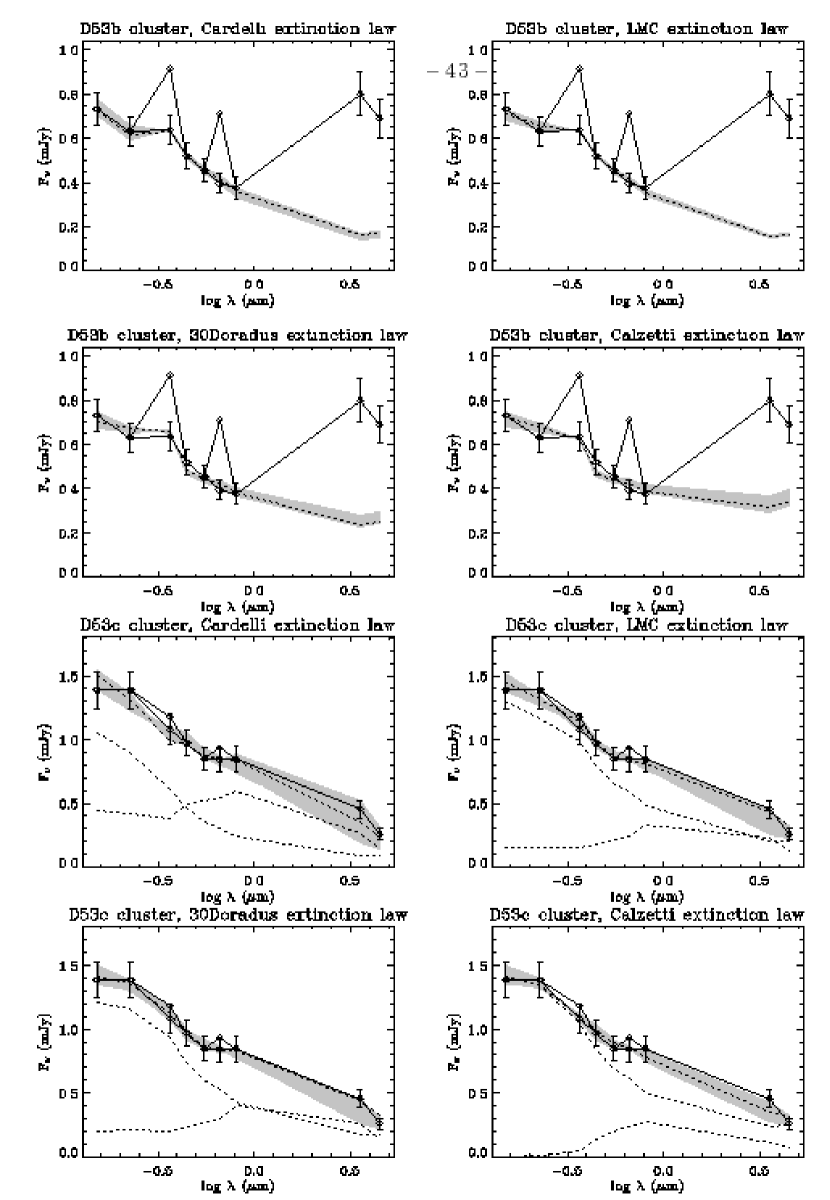
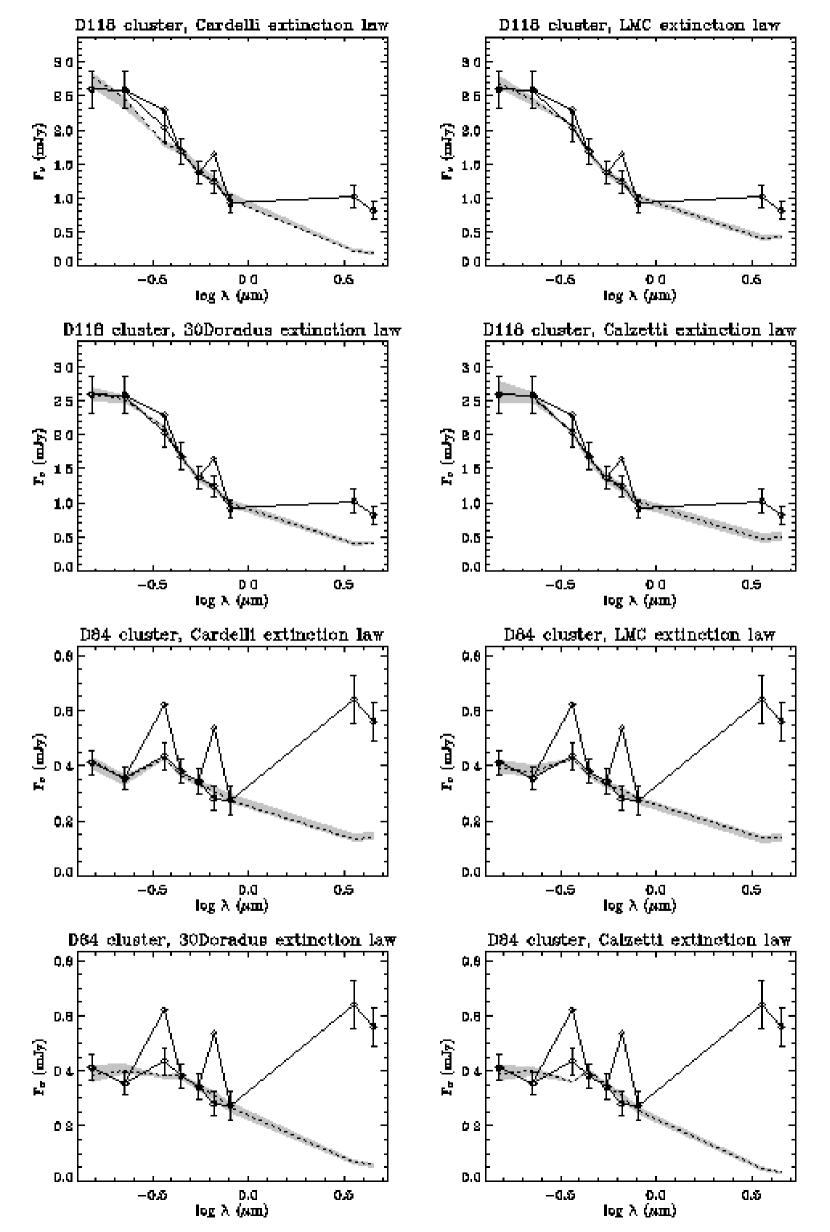
We fit the observed FUV-NUV-UBVRI flux densities using three alternate extinction laws – Cardelli et al. (1989) for the Milky Way, with the ratio of total to selective extinction , appropriate for the diffuse interstellar medium ; Fitzpatrick (1986) for the LMC average and for the 30 Doradus complex – and the attenuation law of Calzetti et al. (1994). The results should be interpreted while keeping in mind that the first three extinction curves were derived toward the line of sight of individual stars, and the last one is in principle only valid for the integrated emission of starburst galaxies, while we are applying them to spatial extractions within regions ranging between 60 and 300 pc in diameter. While Misselt et al. (1999) have shown that the type of extinction law attributed by Fitzpatrick (1986) to 30 Doradus is in fact mostly observed in a region adjacent to 30 Doradus, the LMC2 giant shell, we retain the terminology of Fitzpatrick (1986) for reference to the particular extinction curve that he derived. Updated extinction curves for the LMC have been published by Misselt et al. (1999). Given that we are interested in extracting qualitative variations in the apparent local extinction law (see Section 5.4), and that the discrete extinction curves used here are in fact part of a continuum in dust properties (Gordon et al., 2003), these curves are sufficient for our purposes.
We fit the cluster spectral energy distributions in a simple dust screen configuration, which is implicit in the four extinction curves considered here, i.e. ignoring the effects of scattering and radiative transfer through layers of dust mixed with the stars. These effects are extensively described by e.g. Witt et al. (1992) and Calzetti (2001). Allowing the relative geometry of stars and dust to be unconstrained would introduce insurmountable degeneracy with the fitted parameters of the stellar populations. But there is another motivation for assuming that the stars are not mixed with the dust. Our photometric technique, in effect, is designed to extract the emission from discrete stellar clusters and remove efficiently background or foreground extended emission (Section 4.2). We argue that the stellar clusters can thus be treated as a collection of point sources, each with its own dust shell. This is especially true of the class of clusters that we call compact (see Section 5.4 for a quantitative definition). The smallest full width at half maximum of the images represents a linear distance of 20 pc, to be compared with the full widths at half maximum of young clusters in spiral galaxies as quantified by Larsen (2004), up to 10 pc. Even though the dust screen assumption does not reflect the likely geometry of the sources, we will show in Section 5.4 that it is a good approximation for shell-type sources, for which the inclusion of radiative transfer effects (in particular scattering effects) does not alter our conclusions. Furthermore, the results concerning the variations of the attenuation law (which includes radiative transfer effects, as opposed to the pure extinction law) are independent of any assumptions about the source geometry. Note that scattering should be a negligible component of the Calzetti et al. (1994) law, because light scattered in the line of sight compensates on average light scattered out of the line of sight for regions of large size (several kiloparsec).
The flux calibration uncertainty is assumed to be 10% for all the filters, to which the formal measurement uncertainty is added. The fits were not constrained to reproduce the 3-5 m data, but only not to overproduce them (within the error bars), even when these bands are dominated by stellar emission. We find in some cases that no single coeval population can reproduce the photometric data, in which case we allow two populations of different ages but same extinction. This occurs for the double cluster D53c and for some complex fields associated with very large H II regions (D137b, D115). All the other regions were fitted with a single population.
In H II regions, the H and [O II] lines at 6563 Å and 3727 Å, respectively, contribute a large fraction of the total flux in the R and U bands (up to 50% in R, and up to 40% in U, respectively, within the chosen apertures), except in very diffuse H II regions. The contribution of the H and [O III] lines can be neglected because they are observed through low-transmission parts of the B and V filters, and are intrinsically weaker. We accounted for H and [O II] fluxes by subtracting scaled versions of the H map from the R and U maps, using the [O II]/H ratios measured by Webster & Smith (1983) and d’Odorico et al. (1983) and correcting them for differential extinction. Whenever a measurement of the [O II]/H ratio is lacking, we adopt the average ratio of the H II regions discussed by Webster & Smith (1983) and d’Odorico et al. (1983) ([O II]/H). Because the [O II] contribution estimated in this way is uncertain and because of possible aperture mismatch, we affect a smaller weight to the U-band data than to the other bands, recovering an updated [O II]/H ratio from the SED fits (Table 3).
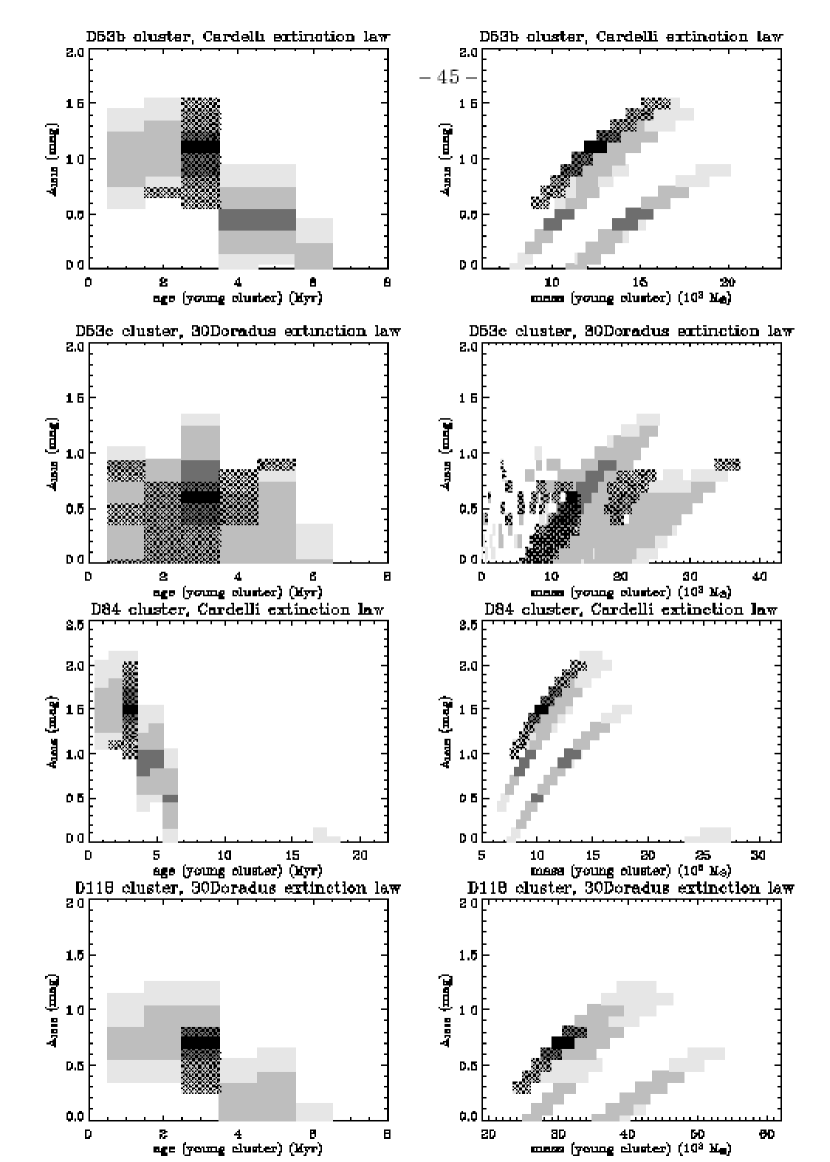
The output parameters of the fits are the age(s) of the clusters, their mass(es), and the monochromatic extinction at 1516 Å, the effective wavelength of the FUV filter. The extinction and ages take discrete values, varying in steps of 0.1 mag and 1 Myr, respectively. For each extinction, each age of the young clusters, and optionally each age of older clusters, the masses have to be solved from a set of 7 equations (for the 7 bands from the FUV to I). In order not to bestow a larger weight on any particular combination of bands, we solve separately each equation with the new equation resulting from the sum of all the fluxes, and then we compute the average of the 7 solutions, with a lower weight for the U band. The ionizing photon flux predicted by the best fit is compared with the ionizing photon flux estimated from the H flux, corrected for extinction using the H/H decrement, but is left unconstrained by the observations. We usually find agreement to within 20%, with a few exceptions (Table 3). To determine the confidence intervals of the cluster parameters, the various fits are only constrained to reproduce the ionizing photon flux from the best fit to within 30% (we set a constraint on the error, but not on the absolute value).
| name | (1516 Å) | age aaWhen no error bar on the age is given, it means that the interval is smaller than the time step of 1 Myr used in the fits. | mass | age bbSince the age and mass of secondary stellar populations are always ill-constrained, this table indicates only the best-fit values. | mass bbSince the age and mass of secondary stellar populations are always ill-constrained, this table indicates only the best-fit values. | [O II] ccThe first value is the input (from Webster & Smith (1983) or d’Odorico et al. (1983), or the average ratio of the regions discussed in these papers when followed by a star) ; the second value is the output of the best fit (not given if the H/R ratio is below 0.15, too low to derive [O II]/H from the fits). All the sub-regions of D53 were assumed to have the same [O II]/H ratio. |
ddThe ratio of the ionizing photon flux predicted by the model to that
estimated from the observations is given for the best fit of each applicable extinction law,
in the following order: Milky Way, LMC, 30 Doradus, and Calzetti et al. (1994).
Whenever the 30 Doradus and Calzetti et al. (1994) laws both provide acceptable fits,
since the Calzetti et al. (1994) law predicts an ionizing photon flux usually in excess,
the cluster parameters and their confidence intervals are derived only for
the 30 Doradus law (the Calzetti et al. (1994) law produces larger masses and higher
extinctions).
|
|
|---|---|---|---|---|---|---|---|---|
| (mag) | (Myr) | ( M⊙) | (2) | (2) | / H | |||
| D6 | 1.0/1.3 | 1.1-1.1-1.1-1.2 | ||||||
| D7-8 | 3 | 1.1∗/… | 0.9-0.9-0.9-1.0 | |||||
| D24 | 3 | 1.2/1.1 | …-…-1.1-1.3 | |||||
| D39 | 3 | 1.1∗/1.9 | 0.7-0.6-…-… | |||||
| D40 | 3 | 1.1∗/1.2 | …-…-1.3-1.6 | |||||
| D45 | 3 | 1.5/1.8 | …-…-1.0-… | |||||
| D53a | 1-2 | 1.4/1.5 | 1.0-1.2-…-… | |||||
| D53b | 3 | 1.4/1.4 | 0.9-…-…-… | |||||
| D53c | 3 | 13 | 20 | 1.4/… | …-…-1.3-… | |||
| D56 | 3 | 1.1∗/1.7 | 0.8-0.8-…-… | |||||
| D61 | 3 | 1.1∗/1.4 | 0.8-0.8-…-… | |||||
| D76a | 3 | 1.6/1.7 | 0.9-0.8-…-… | |||||
| D76b | 3 | 1.1∗/0.8 | 1.2-1.2-…-… | |||||
| D77 | 3 | 0.9/0.5 | 1.0-1.0-1.0-1.1 | |||||
| D79 | 3 | 1.2/1.1 | 1.2-1.3-…-… | |||||
| D84 | 3 | 1.1∗/1.2 | 0.9-…-…-… | |||||
| D88-90 | 3 | 1.1∗/1.3 | …-…-1.3-1.7 | |||||
| D115 | 9 | 16 | 1.1∗/… | …-…-0.9-1.5 | ||||
| D118 | 3 | 1.0/0.8 | …-…-1.2-1.4 | |||||
| D119 | 3 | 1.3/1.7 | …-…-1.1-1.3 | |||||
| D122 | 3 | 1.1∗/2.1 | …-0.8-…-… | |||||
| D127 | 3 | 1.1∗/1.2 | 1.0-…-…-… | |||||
| D129 | 3 | 1.1∗/1.5 | 1.1-…-…-… | |||||
| D137a | 3 | 0.8/0.4 | …-1.4-1.4-1.4 | |||||
| D137b | 23 | 62 | 1.1∗/1.1 | …-…-1.4-2.0 | ||||
| D147 | 5 | 1.1∗/… | 0.9-0.9-0.9-0.9 | |||||
| D159 | 3 | 1.1∗/0.7 | …-…-1.2-1.5 |
We expect the error on the observed ionizing photon flux to be large, because of uncertainties on the H decrement, because of uncertainties in the extent of the region directly under the influence of the ionizing stars, and because an unknown fraction of the ionizing photons may leak out of the H II regions. The few cases where the agreement between the model value and the observed value is poorer than 20% may be due to local errors in the subtraction of the continuum and stellar absorption from the H line, or to increased porosity of the surrounding interstellar medium. One of the regions for which the best-fit model overpredicts the measured ionizing photon flux by a large percentage is D137b (by 40% for the 30 Doradus law, and 100% for the Calzetti et al. (1994) law). This region also stands out as the most peculiar in terms of morphology of the hydrogen gas, suggesting that previous generations of stars in the recent past have injected lots of mechanical energy in the surrounding medium, carving a tunnel-shaped void. It can thus be hypothesized that a sizeable fraction of the ionizing photons are leaking out of the visible H II region. According to studies of the diffuse ionized gas in spiral galaxies, up to 50% of the ionizing photons may escape H II regions (Ferguson et al., 1996). Alternatively, the inclusion of a second population increases the degeneracy of the fits, and the fitted stellar extinction could be too high.
We assess the validity of the different extinction laws by first comparing the values of the best fits. But since the absolute uncertainty was fixed arbitrarily to 10%, not taking into account the smaller relative uncertainty between the two GALEX bands, we consider that a value close to unity does not necessarily indicate that the fit is acceptable. We also check its ability to reproduce colors, in particular the FUV-NUV color, which is the most useful discriminant between the different extinction laws. The ratio of the extinction in these two bands varies from for the Milky Way and for the LMC to for 30 Doradus and for the Calzetti et al. (1994) law.
Whenever some significant interstellar component at 3-5 m was indicated by the population synthesis model, we confirmed this finding by examining the morphology of the dust and stellar clusters (i.e. by checking that the structure of the 3-5 m emission is much more similar to that at 8 m than to that of the stars).
5 Results and discussion
5.1 Ages
One characteristic of the fits assuming instantaneous star formation is that they nearly always predict a cluster age of 3 Myr, with the notable exception of D53a, which is fitted with a stellar population of 1 to 2 Myr, and is one of the regions with the highest flux ratios. This uniformity of age is likely an artifact of adopting too simplified a representation of the clusters (instantaneous star formation model with coarse time steps of 1 Myr), whereas their formation may go on for several Myr instead of being coeval. That the clusters are all young and observed before the bulk of supernova explosions can be inferred from the fact that they produce a significant amount of ionizing radiation, since most were selected to be associated with bright H II regions. The case of D53a is interesting, as it confirms that complexes containing younger stars tend to have higher ratios of very small grain emission to aromatic band emission (Sauvage et al., 1990; Roussel et al., 2001b; Dale et al., 2004).
5.2 Masses
When considering such small stellar populations as those extracted here, formed of one or a few young clusters, statistical fluctuations of the mass spectrum of massive stars may become severe enough to affect the results of the fits. For the adopted initial mass function, the ratio , where the numerator is the number of stars more massive than the threshold Mhot and the denominator is the total cluster mass as given in Table 3, is equal to , with masses in units of solar mass. The whole range of cluster masses in Table 3 thus corresponds to between 9 and 126 O stars with (Vacca, 1994). Adopting as a working definition of ionizing stars (Kennicutt, 1984), the clusters masses also correspond to between 17 and 245 ionizing stars. The sampling of the initial mass function is thus a concern for the smallest clusters analysed in this paper, in which a single ionizing star may account for up to 5% of the far-ultraviolet emission. Note that a few regions, for which we could not obtain any satisfactory fits, were discarded from our sample ; one of the possible reasons for this is small-number statistics of ionizing stars in low-mass stellar clusters.
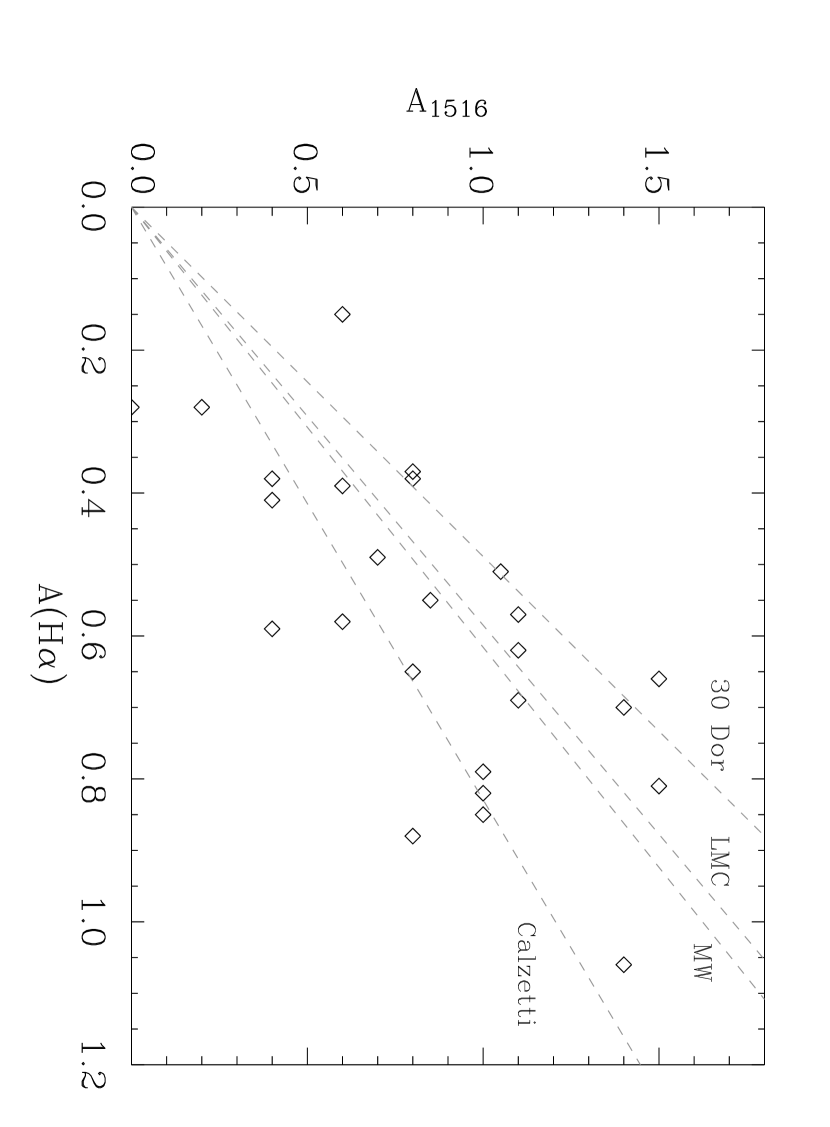
5.3 Stellar and nebular extinctions
The fitted stellar extinction at the effective wavelength of the FUV filter varies between nearly zero to mag. Its correspondence with the nebular extinction is shown in Figure 9. The lack of a tight correlation between the two can be understood in terms of spatial offsets between H II regions and clusters, and highly variable geometric configuration from one region to another. Within this sample, the A(H)/AR ratio ranges from 1 to more than 3.5 . The deviation from the value usually adopted for actively star-forming galaxies (Calzetti et al., 1994) can thus be greater than % for individual regions.
There is a good qualitative correspondance between the extinction map at a resolution of 38″ and the extinctions of individual regions derived from the population synthesis fits, considering that significant deviations are expected from the fact that extinction is highly variable on small scales. It should also be noted that while the population synthesis fits give the extinction of the young stellar clusters only, the extinction in Figure 4, by construction, includes all the stellar populations at any given location. Since intermediate-age and old populations are, on average, much less affected by extinction at any wavelength, because decoupled over time from their parent gas clouds, the extinction values derived from the global energy budget are expected to be much lower than those of the ionizing clusters ; this is indeed observed.
5.4 Extinction law and geometry of the interstellar medium
We find clear differences in which extinction laws are applicable, as a function of the geometry of the H II regions with respect to the exciting clusters. The most compact regions follow either the Milky Way or the LMC law, whereas the clusters associated with H II regions forming shells and diffuse structures follow either the 30 Doradus or the Calzetti et al. (1994) law. Usually, the degeneracy between the latter two cannot be lifted, but models using the Calzetti et al. (1994) attenuation law systematically overpredict the ionizing photon flux by much larger amounts than the 30 Doradus law. We therefore consider the 30 Doradus law to yield a more reliable representation of the data, even though the stellar SED fits are formally of comparable quality using either of these two laws.
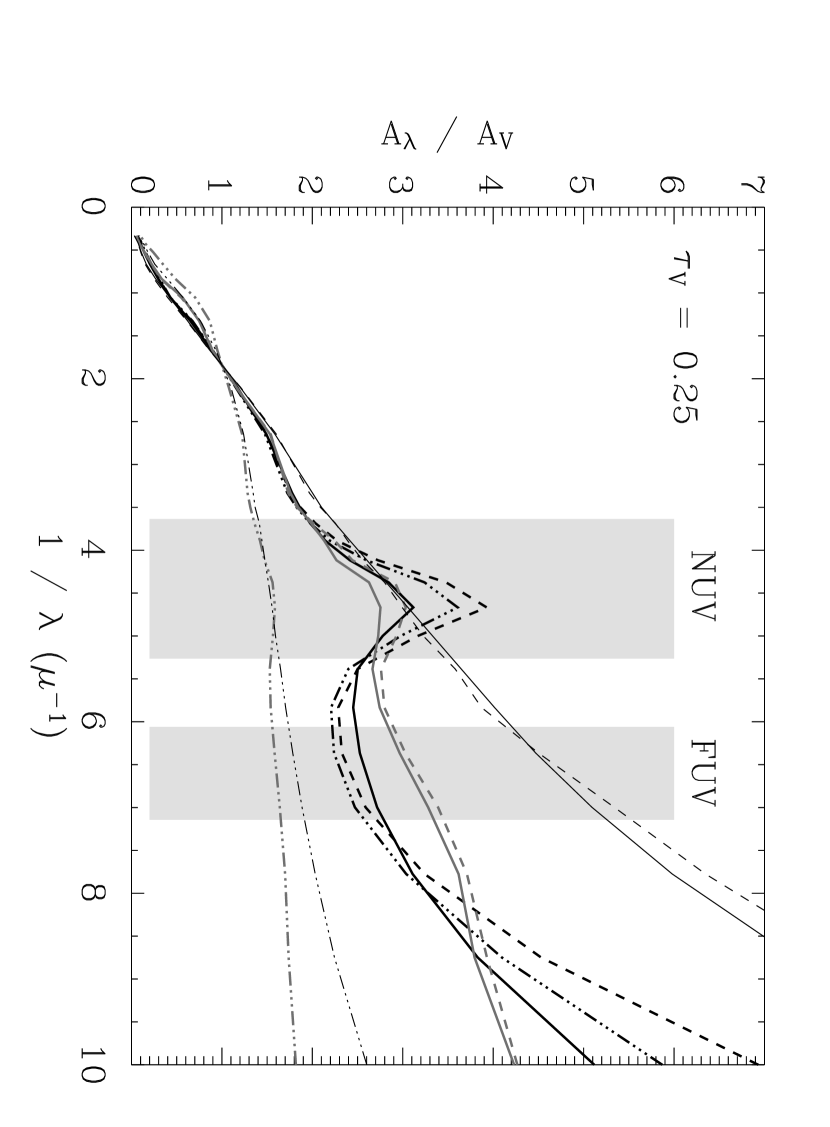
To qualitatively ascertain the consequences of neglecting radiative transfer effects, we examine the predictions of the DIRTY model (Witt & Gordon, 2000; Gordon et al., 2001; Misselt et al., 2001) with empirically-derived dust properties, in the configuration of a dust shell surrounding a stellar cluster, appropriate for our sample (Section 4.3). The dust properties of the LMC2 giant shell (called 30 Doradus here), not included in the original models, were derived by Gordon et al. (2003)444The data tables were retrieved from the DIRTY website: http://dirty.as.arizona.edu/ .. The results obtained from the pure extinction laws for the Milky Way, the LMC2 region and the SMC are compared with those obtained from the corresponding attenuation laws for two types of local dust distribution: homogeneous and clumpy, the latter using the parameters defined by Witt & Gordon (2000). While other geometric configurations are available within DIRTY, better applicable to the extended emission of large regions within galaxies, it is beyond the scope of this observational study to perform comprehensive modelling. We stress that the basic result of large variations in the attenuation law, whether they correspond to genuine variations in the extinction law or not, is independent of any assumptions about the relative geometry of stars and dust.
Figure 10 shows the extinction and attenuation curves in the model shell configuration, for a particular optical depth, which corresponds to using the Cardelli extinction law, within the range of derived extinction values for our clusters. The inclusion of scattering produces emerging spectra that are bluer, with significantly higher FUV/NUV ratios, as more light is scattered in the line of sight than out. It is thus conceivable that the clusters which were well fitted with the Cardelli extinction law could be equally well fitted with a LMC or SMC-based attenuation law. However, even at the low optical depth considered in Figure 10, the attenuation curves applicable to the clumpy case are extremely grey, and thus would not provide any good fit to the observed spectral energy distributions, since they would predict too much intrinsic emission in the optical bands.
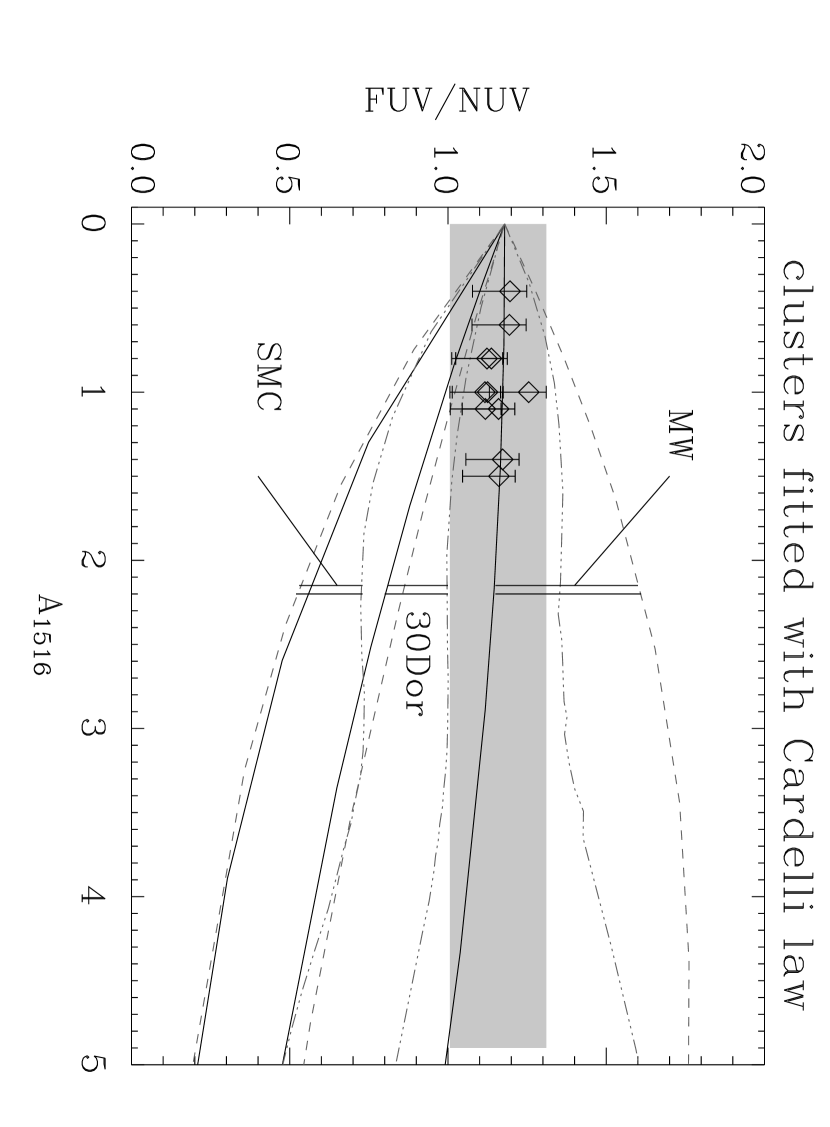
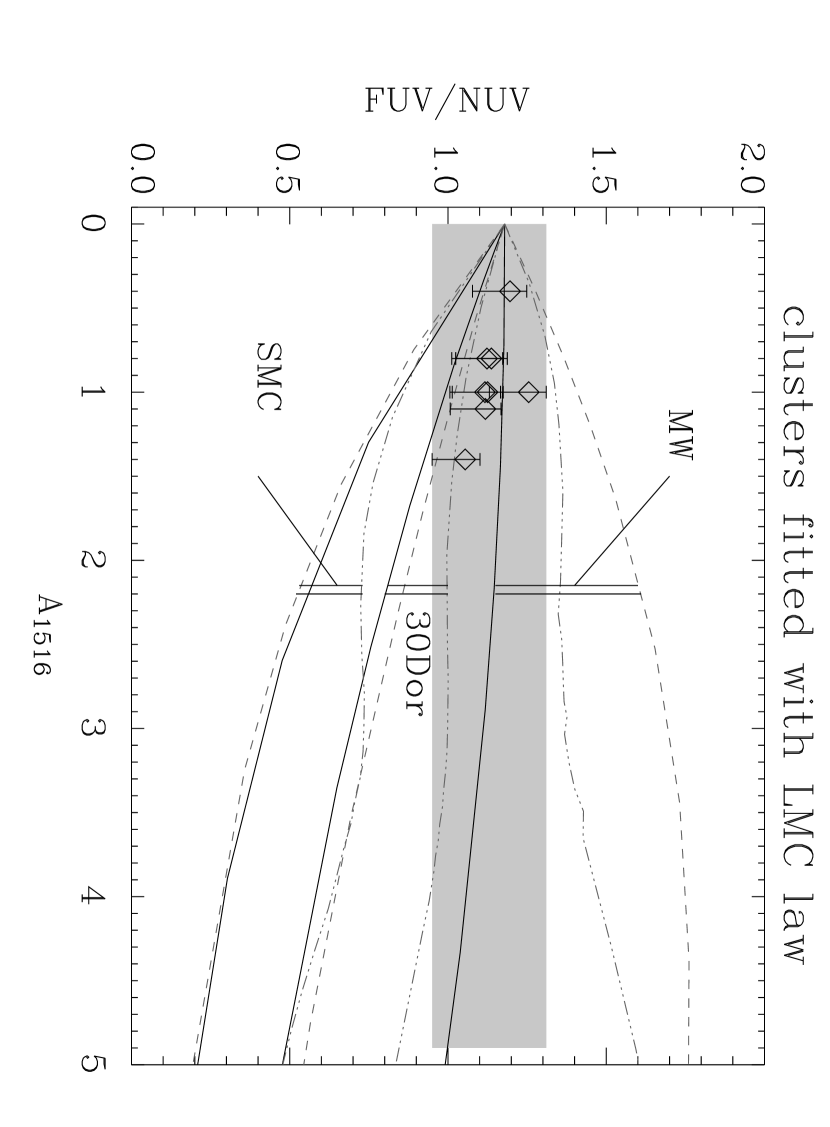
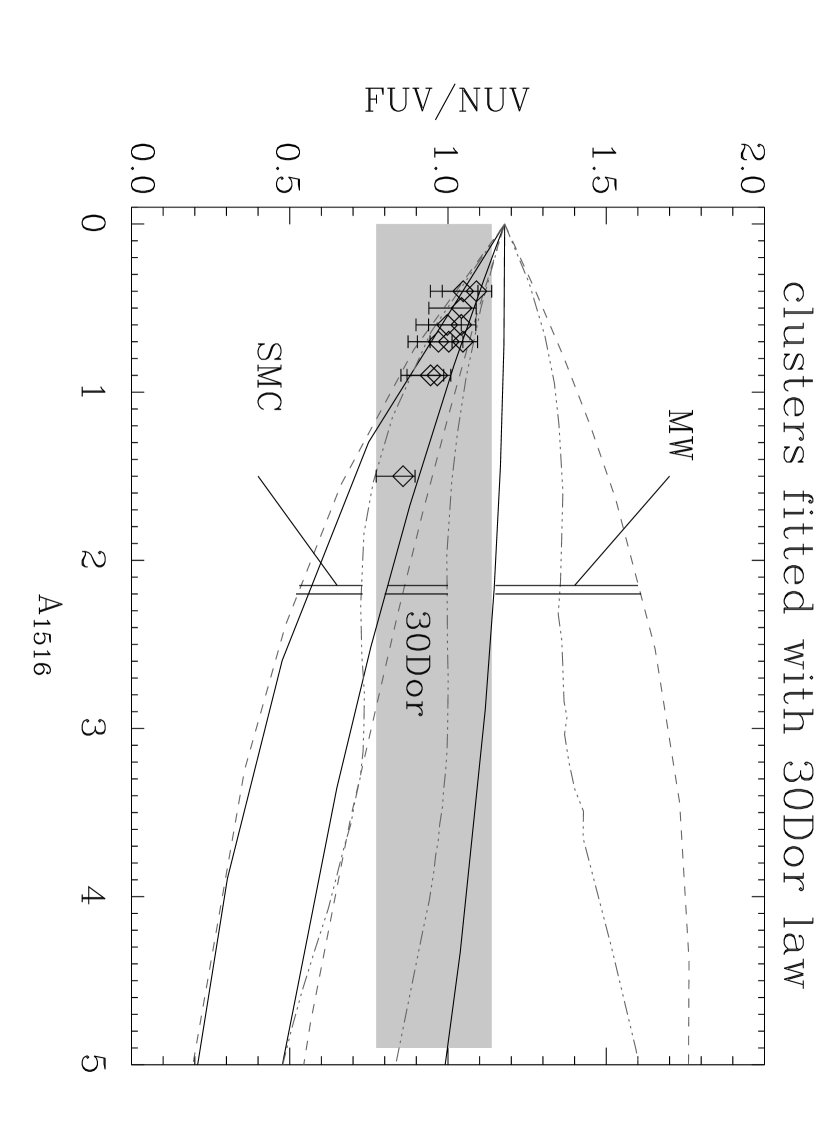
We now examine the aptitude of each attenuation law to reproduce the observed
FUV/NUV flux density ratios. Figure 11 shows the
predictions from the DIRTY model. The intrinsic FUV/NUV ratio of a
3 Myr-old cluster is 1.18, and it varies between 1.13 and 1.31 for ages
between 1 and 5 Myr. This uncertainty is reflected in the error bars in
Figure 11.
Cluters well fitted with the Cardelli or LMC extinction law:
The data points overlap only with the Milky Way extinction law and the
LMC2 extinction and attenuation laws. However, the attenuation law
using the LMC2 dust properties, in the homogeneous case, is not much
different from the pure extinction law, i.e. the effects of scattering are
almost negligible. It is in principle possible to reproduce the observed
FUV/NUV ratios with the LMC2 or 30 Doradus laws, but only if the clusters
are younger (1 or 2 Myr).
This seems unlikely, since the predicted ionizing photon fluxes would
then be in strong excess with respect to the observational estimates
(which are more robust for the compact HII regions associated
with these clusters than for the diffuse HII regions).
We note that the
effects of scattering are strongest for the Milky Way dust properties,
and that none of the clusters would be well represented in the dust
shell configuration with the Milky Way attenuation laws (i.e. including
scattering), either in the homogeneous or in the clumpy case.
Cluters well fitted with the 30 Doradus extinction law:
The data points lie in between the LMC2 (30 Doradus) and the SMC laws.
Again, the SMC-dust attenuation law, in the homogeneous case, is very
close to the pure extinction law, and the effects of scattering are
also very small in this configuration. But the extinction laws in
the line of sight of these clusters may span the full range between
the 30 Doradus and the SMC laws.
We conclude that the correct treatment of radiative transfer effects
would not drastically alter our qualitative conclusions in what follows,
unless stars had extended spatial distributions and were significantly
mixed with the dust, which we argue is very unlikely for the stellar
clusters that we classify as compact.
To quantify the compactness of the regions in a convenient way, we use the H/R flux ratio, measured in the area defining the stellar aperture (i.e. if the H II region extends far away from the clusters, only a fraction of the H emission is considered in this ratio). While this is proportional to the H equivalent width, we argue below that it is also a valid measure of the compactness of the H II region. Although it is potentially distorted by differential extinction between the nebular phase and the stars, this effect should not have a large impact. Using the results from Figure 9, we derive that for the highest extinctions, observed values of H/R close to 1 at one extreme or close to 0.2 at the other extreme may be shifted by up to 0.9 upward or 0.2 upward, respectively, when corrected for extinction. Since the regions with the highest extinctions are also those with the highest H/R values, correcting rigorously for extinction would preserve the trend discussed below. Figure 12 confirms that the H/R ratio provides a reliable quantification of the degree of compactness of the entire H II region. We prefer to adopt the H/R indicator, because it is a relatively unbiased measurement: unlike the ordinate of Figure 12, it does not imply any assumption about the total extent of the H II region, which is difficult to define owing to the presence of neighboring H II regions and the diffuse and filamentary aspect of the H emission.
Figure 13 shows the dependence of the extinction law on the H/R ratio. Whenever a region sits in between two extinction laws, it means that its SED is formally as well represented with either law as with the other. Unconstrained regions are those whose SED is well fitted by at least three of the four extinction laws (usually because of very small extinction). To indicate cases when the measured ionizing flux is overestimated by a large amount by the Calzetti et al. (1994) attenuation law, the points are plotted closer to the 30 Doradus law locus. The main discriminant between the various extinction laws is the A(FUV)/A(NUV) ratio (Sect. 4.3). The increase in A(FUV)/A(NUV), going from the Cardelli et al. (1989) law to the LMC law to the 30 Doradus law, is due to both the gradual disappearance of the so-called 2175 Å bump, which is covered by the NUV band, and the steepening of the FUV rise. Although the Calzetti et al. (1994) law is devoid of the 2175 Å bump, the corresponding A(FUV)/A(NUV) ratio is slightly smaller than that of the 30 Doradus law, because the Calzetti et al. (1994) law has a flatter wavelength dependence.
That the extinction law should vary within a galaxy is not a complete surprise given that some significant variations have been observed within the Milky Way and the Magellanic Clouds. In the SMC, Lequeux et al. (1982) discussed the line of sight to a star with a Milky Way-type extinction law. In the LMC, Misselt et al. (1999) discussed a line of sight associated with a giant shell, with a much weaker 2175 Å bump than its immediate surroundings. In the Milky Way, LMC-type extinction laws have be found toward low-density lines of sight (Clayton et al., 2000), and a SMC-type extinction law was derived toward a region suggested to have been profoundly affected by supernova shocks (Valencic et al., 2003). Although the disappearance of the 2175 Å bump, together with the steepening of the far-ultraviolet rise, are usually ascribed to a decrease in metallicity, which could explain the differences between the average extinction laws of the Milky Way and Magellanic Clouds, Mas-Hesse & Kunth (1999) found no such dependence of the extinction curve on metallicity, for a sample of dwarf star-forming galaxies. As pointed out by Misselt et al. (1999), an apparent dependence on metallicity may be only an indirect effect, because the dust grain properties and geometry of the interstellar medium are expected to be on average related to the metallicity.
It has been suggested that the intensity of star formation in the local environment could be the main driver of the extinction law shape, causing the destruction or processing of the dust grains responsible for the 2175 Å feature, via radiation hardness and supernova shocks (Fitzpatrick & Massa, 1986; Gordon et al., 1997; Gordon & Clayton, 1998; Mas-Hesse & Kunth, 1999). This scenario is well in line with the attribution of part of the 2175 Å feature to aromatic hydrocarbons (Joblin et al., 1992; Duley & Seahra, 1998), as this dust species is known to be less resilient than very small grains and to be destroyed by intense radiation fields. Supporting this identification, Vermeij et al. (2002) have reported variations of the mid-infrared band ratios (caused by changes in molecular structure, or degree of ionization and hydrogenation) that are correlated with the strength of the 2175 Å bump. It has been proposed that aromatic hydrocarbons are also responsible for part of the far-ultraviolet rise (Puget & Léger, 1989), and very small carbonaceous grains (of three-dimensional structure) are sometimes assumed to be the main contributor to the 2175 Å bump (Draine & Lee, 1984; Hecht, 1986; Sakata et al., 1994).
The present work, however, supports the idea that geometry effects are much more important than the distinction between quiescent and actively star-forming regions. According to the SED fits, all the exciting clusters have very similar ages. Therefore, rather than being a pure indicator of the evolution of the clusters, as the equivalent widths of the H recombination lines are usually assumed to be, the H/R ratio can be interpreted here as mainly governed by the geometric evolution of the whole region, bearing traces of previous generations of stars in the shaping of the interstellar gas. Indeed, the giant shells of hydrogen that are observed in many locations across the disk of NGC 300, where they are illuminated by ionizing clusters, may have been carved by supernova explosions, in which case they signal past star formation at the same location, more than 5 Myr ago. The difference in geometry between the regions D53a-b and D53c, which are part of the same complex and whose exciting clusters have approximately the same age, is particularly significant. High ratios, indicative of intense radiation fields, can also be found both in compact and diffuse star formation complexes. The most obvious difference between clusters associated with a Milky Way-LMC extinction law and those associated with a 30 Doradus-Calzetti law is in the distribution of the material around them. For the latter, both the atomic hydrogen and the mid-infrared-emitting dust (aromatic hydrocarbons and very small grains) have been removed far away, presumably by stellar winds and supernova shocks from previous generations of stars at the same location. This does not preclude important differences as well in the processing of dust grains by supernova shocks, but if the modified dust is dissipated together with the gas, it is only weakly participating in the extinction of the clusters.
We can speculate that the effects of a varying extinction law within and among galaxies may resemble the effects of a varying initial mass function (Rosa & Benvenuti, 1994), since for a given optical depth, the emerging ultraviolet continuum is much flatter in the case of a 30 Doradus-Calzetti law than for a Milky Way law. An upper mass cutoff of the initial mass function is not supported in NGC 300, since Wolf-Rayet features have been observed throughout its disk (Schild et al., 2003).
Finally, we can expect the behavior of more massive galaxies and of starbursts, where H II regions may generally be more centrally distributed and more compact than in NGC 300, to be significantly different.
5.5 Interstellar emission in the near-infrared
In some regions, we detect a clear excess at 3-5 m above the stellar model. The improvement with respect to the previous treatment in Helou et al. (2004) (where it was assumed that the 3.5 m emission covered by the IRAC1 band is entirely stellar) allows us to derive more accurately the amount of interstellar emission at these wavelengths. However, our method restricts the detectable interstellar component at 3-5 m to the exact location of the stellar emission ; if the hot dust in this wavelength range is significantly offset from the exciting source, it will not be detected. The 3.5 m/4.5 m color of young clusters is very similar to that of dust (close to 1), making it very difficult to separate the two components if extensive information at other wavelengths does not exist. Complexes where the interstellar component at 3-5 m is high with respect to the stellar fluxes (within the stellar aperture) are among the most compact (Fig. 14 and 13).
To explore the link between the extinction law and the dust emission, we adopt measurements of the 3-5 m interstellar emission, as the favorable angular resolution in these bands allows us to select the dust emission within the stellar “apertures”, directly in the line of sight of the clusters. Figure 14 confirms that switching from the H equivalent width to the column density of near-infrared-emitting dust in the line of sight of the clusters gives the same trend as seen in Figure 13: the shape of the extinction law seems to depend importantly on the amount of interstellar material which re-emits the absorbed energy in the near- to mid-infrared. We cannot explore related variations in the mid-infrared to far-infrared colors, because the angular resolution at far-infrared wavelengths is too coarse.
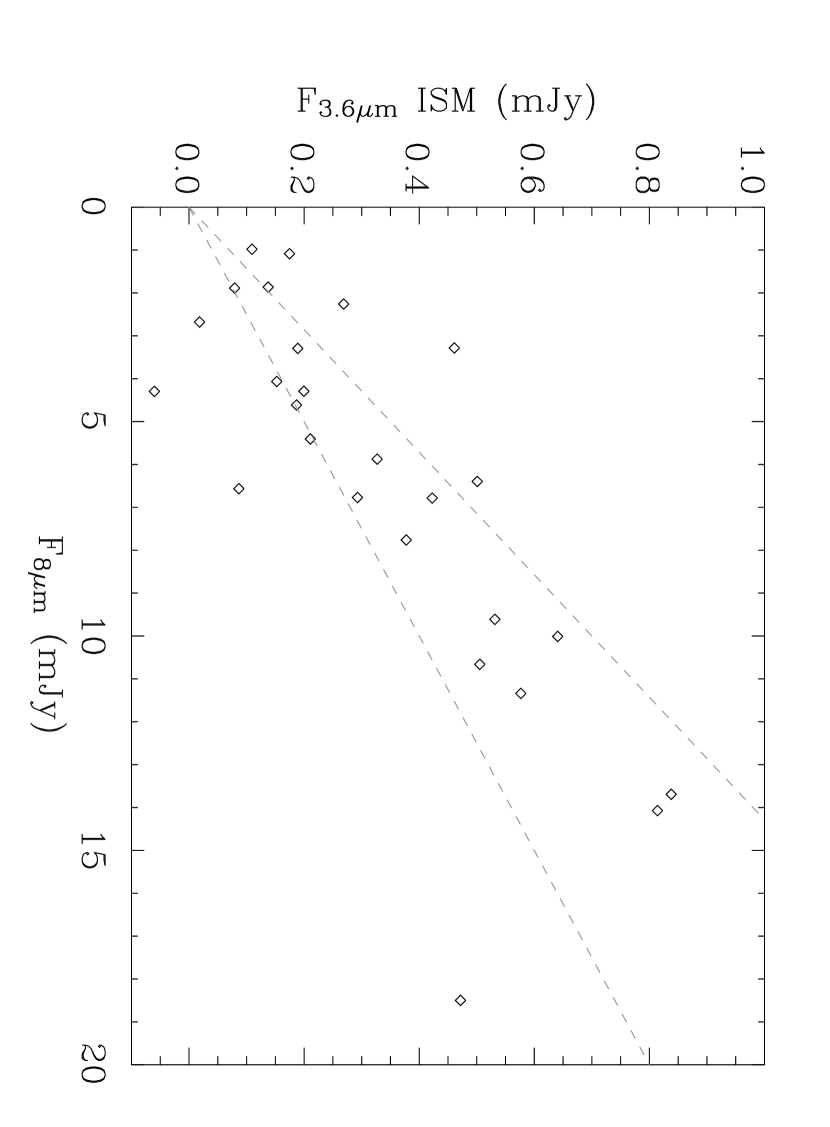
Even though this 3-5 m dust component may not be physically related to the other mid-infrared dust species, the aromatic band carriers and very small grains, Figure 15 shows that it scales reasonably well with the 8 m aromatic band emission. These measurements suffer from the degraded angular resolution at 8 m combined with the narrow stellar “apertures” used to fit and extract the interstellar component from the 3.6 m band, but are nevertheless in line with the flux ratios derived by Lu (2004) for interstellar emission in star-forming galaxies, as well as for the general interstellar medium of the Milky Way.
5.6 Porosity of the interstellar medium and excitation of aromatic band carriers
Examination of the morphology of the H II complexes in H provides evidence that the interstellar medium is highly porous in some regions, thus that the 8 m-emitting dust can be heated by photons travelling as far as several hundred parsecs (since the NUV photons travel farther away than the ionizing photons, which are able to excite H emission a few hundred parsec away from the clusters). Diffuse emission also exists at 24 m, but is harder to detect, because it is intrinsically fainter than at 8 m and observed at much lower angular resolution, increasing the confusion by nearby bright sources, and the 8 m observations are deeper. Although the 8 m/H flux ratio varies dramatically from bright H II regions to more diffuse regions (Helou et al., 2004), and the 8 m emission has a more filamentary aspect than the H and 24 m emission, virtually every 8 m peak is associated with a close-by H peak (see Figure 6).
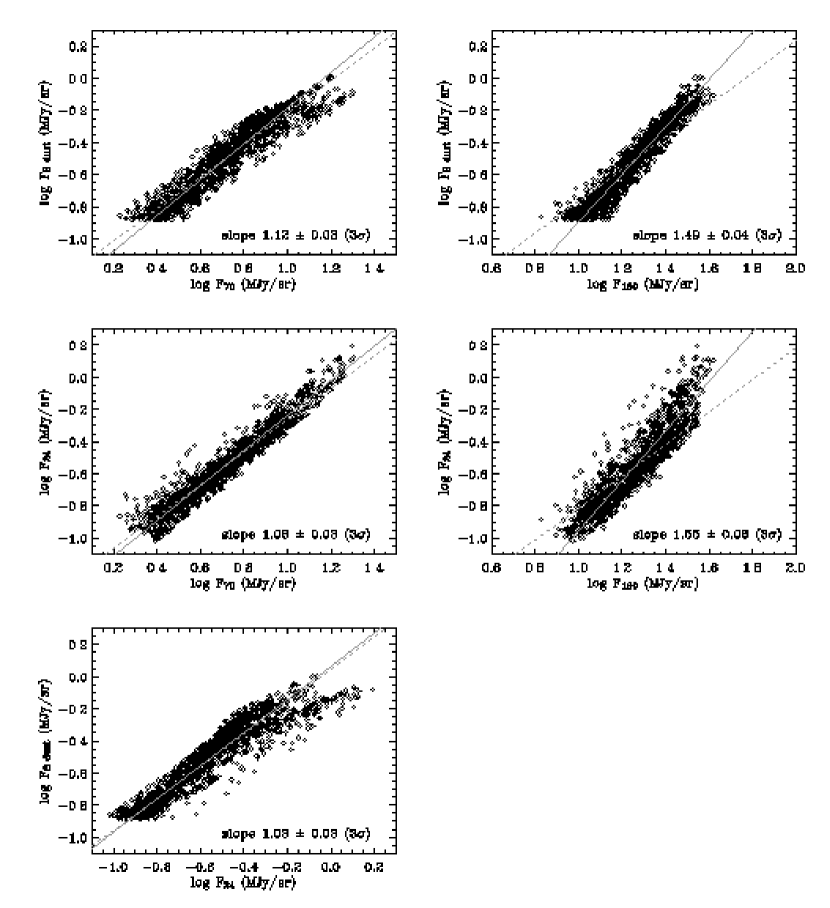
The claim of Haas et al. (2002) that aromatic band emission is more closely correlated with very cold dust than with hot dust within galaxies does not withstand examination in NGC 300. Figure 16 shows the relation between the aromatic band emission at 8 m and the emission in the far-infrared, at 70 and 160 m. As a comparison, the relation between 24 m and the far-infrared emission is also included. The 160 m emission can be considered a tracer of the cold dust, and the 70 m emission arises from dust that is on average hotter, with a significant contribution from impulsively-heated very small grains (Désert et al., 1990). Figure 16 indicates clearly that aromatic bands are not associated with cold dust, and are not excited by the same radiation as the big grains. In the 8 m-70 m diagram, at high surface brightnesses, a branch with a slightly lower slope than in the low-brightness part is visible. This branch is slightly more prominent in the 8 m-24 m diagram ; it is linked with the disappearance of the aromatic bands from inside the H II regions. Nevertheless, the 8 m-70 m and 8 m-24 m relations are much closer to linearity than the 8 m-160 m relation. The linearity between 8 m and 850 m surface brightnesses reported by Haas et al. (2002), obtained at low angular resolution in galaxies of moderate angular size, and more importantly at mediocre sensitivity at 850 m, may simply be a consequence of extracting only the brightest and most active regions, which generally have dust temperature distributions shifted toward higher values, and discarding more diffuse regions, with cooler dust temperatures. Their result thus does not imply that the aromatic bands and the cold dust component are physically related, nor heated by the same radiation.
5.7 Embedded and bare sources
Within the inner disk, a few non-stellar sources bright at 24 m have weak optical and no ultraviolet counterparts (Table 4). Two of these are probably background distant galaxies, judging from their morphology in optical high-resolution images. The five other sources coincide with very faint H emission, have no other optical counterpart, and may be ultracompact H II regions. We consider it likely at least for the object catalogued by Deharveng et al. (1988) as the faint and small H II region D125. If the H/H decrement of D125 can be trusted, it indicates a lower limit of the extinction in the H line of 2.8 mag, much higher than for the H II regions associated with the clusters examined here (see Table 1). Its mid-infrared counterpart has the highest ratio within the galaxy () and is still visible at 70 m despite the degraded angular resolution.
| RA DEC (J2000) | identification |
|---|---|
| (h m s) (° ′ ″) | |
| 00 54 41.7 -37 40 22 | ultracompact H II region ? |
| 00 54 50.4 -37 38 51 | background galaxy ? |
| 00 54 50.7 -37 41 55 | ultracompact H II region ? |
| 00 54 53.3 -37 43 13 | background galaxy ? |
| 00 54 59.8 -37 39 27 | ultracompact H II region ? |
| 00 55 01.7 -37 39 32 | ultracompact H II region ? |
| 00 55 05.9 -37 42 14 | D125 – ultracompact H II region ? |
Conversely, some far-ultraviolet and H sources are not associated with any detectable mid-infrared dust emission. These regions are of low brightness and diffuse in the H emission, suggesting that they are aged H II regions, excited by slightly evolved clusters (see the previous paragraph). Both types of sources contribute negligibly to the emission from the optically-bright disk, but the latter (bare sources) become predominant in the outer disk.
6 Summary and conclusion
The large-scale UV/IR ratio gradient observed in NGC 300 is probably the consequence of a combination of factors, all causing an increase in the mean free path of ultraviolet photons. In this paper, we have focussed on geometric factors, and shown that they cannot be neglected.
Throughout the disk of NGC 300, mid-infrared peaks are commonly offset from both the ionized gas peaks and stellar clusters, except for compact regions (Helou et al., 2004). This is because we are able to partially resolve H II regions from photodissociation regions. However, in the outer disk, even the far-infrared emission sometimes appears significantly displaced from the location of the ultraviolet sources, at a resolution of 38″ (FWHM) or about 400 pc. In the outer disk, dust may be removed away from star-forming sites more efficiently than in the inner disk, either because the volume density of the interstellar medium is decreased or because the exciting clusters are older on average and have injected more non-thermal energy into the interstellar medium.
There are several examples of very porous star-forming sites at distances of 3-4′ ( kpc) from the center, from which both the hydrogen gas and the dust have been removed (such as D118 and D137) ; as they belong to the optically-bright part of the disk, where presumably the molecular gas density remains high, i.e. above the threshold for gravitational instabilities discussed by Kennicutt (1989), these individual H II complexes are unable to affect significantly the global UV/IR radial profile. However, such regions may become dominant in the outer disk.
Most of the H emission in the outer disk is in the form of diffuse, very large shells, which supports either one of the factors invoked above for dust removal: either the gas is very rapidly pushed away, during the lifetime of ionizing stars, because the interstellar medium is more tenuous, or the exciting stellar populations are older on average, so that they had more time to blow the gas away by their winds and supernova explosions. Good supporting examples of the hypothesis of aged stellar populations are the clusters D115 and D147, which are bright in the FUV, but seem to contain slightly evolved stellar populations (of the order of 5 Myr, as opposed to 3 Myr for most clusters). Since it is not possible to measure and fit the SEDs of a reasonably large number of clusters associated with giant shells in the outer disk, however, we cannot constrain the importance of this scenario relatively to the others (but see also Figure 2).
From population synthesis fitting of individual young stellar clusters or small groups of clusters, we find that the stellar attenuation law varies significantly on the explored spatial scales of pc, and we argue that this empirical result likely corresponds to real variations in the extinction law as well. Just as the UV/IR ratio does not depend only on age and metallicity, there is ample evidence that the apparent correlation between the shape of the extinction law and the metallicity or the mode of star formation (active versus quiescent) is only a secondary effect of a more direct cause. We argue that the strength of the 2175 Å bump and the steepness of the far-ultraviolet rise, whatever the responsible dust species, are directly related to the degree of compactness of the star-forming regions, and to the column density of interstellar material in front of the clusters. While most of the young stellar clusters considered here have similar ages and have not produced supernova explosions yet, the only obvious difference between them is that some appear to have formed in regions deeply affected by previous generations of stars. These are associated with diffuse, shell-like H II regions of large dimensions. If we divide star-forming complexes in two categories, based on the degree of compactness of the H emission, we find that the most compact regions follow either the Milky Way or the average LMC extinction law, whereas the most diffuse regions follow an extinction law with a decreased 2175 Å bump and/or a steeper far-ultraviolet rise. While we cannot ascribe these features to a particular dust species, we show, using the near-infrared dust component extracted from our SED fitting procedure, thanks to the favorable angular resolution, that the distinction between the two types of morphologies and the two types of extinction laws is related to the column density of near-infrared emitting dust lying in the line of sight of the clusters.
We can hypothesize that the main difference in dust nature causing the change of extinction law between the compact and diffuse regions is related to a changing proportion of dust grains very close to the H II region, which have been processed by hard ultraviolet radiation from the young stars, with respect to grains lying further away and which have not been processed in the same way. This photo-processing is likely occurring very fast, so that the observed dust properties of compact H II regions should be systematically different from the dust properties of diffuse regions where dust lies further away from the exciting stars. According to Boulanger et al. (1990), who discussed the ubiquitous and large variations in mid-infrared to far-infrared colors within and among nearby molecular clouds, such variations cannot be explained only by changes in the radiation field, but require actual variations in the abundance of small grains with respect to big grains. They proposed that these abundance variations are caused by photo-processing, on time scales comparable to those of the mixing of gas by turbulent motions in clouds. Habart et al. (2001) and Abergel et al. (2002) also discussed abundance variations of small grains and aromatic hydrocarbons in resolved photodissociation regions and molecular clouds. This speculation would be consistent with the fact that the dust emitting in the 3-5 m range is likely excited inside or very close to H II regions (Helou et al., 2004), and that we have seen here that its excitation has a close correspondence to the shape of the extinction law.
Appendix A Notes on individual regions (including the clusters for which the fits are shown in Figure 7)
D53a:
Compact, associated with very hot dust at 24 m and 3-5 m.
Since the emission is confused by nearby clusters in the GALEX
bands, we had to subtract a gaussian representation of these contaminating
clusters, and apply a large aperture correction to the FUV and NUV
fluxes, because of the small size of the aperture.
D53b:
Compact, associated with hot dust at 24 m and 3-5 m.
Two distinct clusters can be distinguished, but are well fitted
with a single stellar population.
D53c:
Two clusters, one with a very red SED. The morphology in the various
bands clearly indicates that interstellar emission is negligible
at 3-5 m. The fits included a second population but were not
constrained to reproduce the 3-5 m fluxes. The modelling confirms,
however, the stellar nature of the 3-5 m emission.
The ionized gas is diffuse and forms an extended fragmentary shell
of size pc.
D118:
Complex region with several clusters, which can be fitted by a single
population. The ionized gas and the dust are distributed in both
compact regions and a giant shell.
D119: Same remarks as for D118.
D137b:
This complex region stands out as very peculiar: the ionized gas and
dust seem to form two walls on each side of the brightest cluster,
separated by pc in projected distance. Star formation has
thus had dramatic effects on the shaping of the surrounding interstellar
medium. The H and dust peaks are coincident with weak UV sources,
presumably because of extinction effects, while the cluster dominating
the UV emission is located in a zone nearly void of interstellar emission.
Since the complex contains redder stellar sources besides these clusters,
we allow for a second population in the fits. This increases dramatically
the degeneracy of the younger population parameters.
D84:
Compact region, associated with hot dust at 24 m and 3-5 m.
References
- Abergel et al. (2002) Abergel, A., Bernard, J.P., Boulanger, F., et al. 2002, A&A, 389, 239
- Andreani et al. (1995) Andreani, P., Casoli, F., & Gerin, M. 1995, A&A, 300, 43
- Blair & Long (1997) Blair, W.P., & Long, K.S. 1997, ApJS, 108, 261
- Bot et al. (2004) Bot, C., Boulanger, F., Lagache, G., Cambrésy, L., & Egret, D. 2004, A&A, 423, 567
- Boulanger et al. (1990) Boulanger, F., Falgarone, E., Puget, J.L., & Helou, G. 1990, ApJ, 364, 136
- Breysacher et al. (1997) Breysacher, J., Azzopardi, M., Testor, G., & Muratorio, G. 1997, A&A, 326, 976
- Buat & Burgarella (1998) Buat, V., & Burgarella, D. 1998, A&A, 334, 772
- Calzetti (2001) Calzetti, D. 2001, PASP, 113, 1449
- Calzetti et al. (1994) Calzetti, D., Kinney, A.L., & Storchi-Bergmann, T. 1994, ApJ, 429, 582
- Cardelli et al. (1989) Cardelli, J.A., Clayton, G.C., & Mathis, J.S. 1989, ApJ, 345, 245
- Clayton et al. (2000) Clayton, G.C., Gordon, K.D., Wolff, M.J. 2000, ApJS, 129, 147
- Dale et al. (2004) Dale, D.A., Roussel, H., Contursi, A., et al. 2004, ApJ, 601, 813
- Dale & Helou (2002) Dale, D.A., & Helou, G. 2002, ApJ, 576, 159
- Deharveng et al. (1988) Deharveng, L., Caplan, J., Lequeux, J., et al. 1988, A&AS, 73, 407
- Désert et al. (1990) Désert, F.X., Boulanger, F., & Puget, J.L. 1990, A&A, 237, 215
- Draine & Lee (1984) Draine, B.T., & Lee, H.M. 1984, ApJ, 285, 89
- Duley & Seahra (1998) Duley, W.W., & Seahra, S. 1998, ApJ 507, 874
- Ferguson et al. (1996) Ferguson, A.M., Wyse, R.F., Gallagher, J.S., & Hunter, D.A. 1996, AJ, 111, 2265
- Fitzpatrick (1986) Fitzpatrick, E.L. 1986, AJ, 92, 1068
- Fitzpatrick & Massa (1986) Fitzpatrick, E.L., & Massa, D. 1986, ApJ, 307, 286
- Freedman et al. (1992) Freedman, W.L., Madore, B.F., Hawley, S.L., et al. 1992, ApJ, 396, 80
- Fukugita et al. (1995) Fukugita, M., Shimasaku, K., & Ichikawa, T. 1995, PASP, 107, 945
- Gil de Paz et al. (2005) Gil de Paz, A., et al. 2005, in preparation
- Gordon et al. (2003) Gordon, K.D., Clayton, G.C., Misselt, K.A, Landolt, A.U., & Wolff, M.J. 2003, ApJ, 594, 279
- Gordon et al. (2001) Gordon, K.D., Misselt, K.A, Witt, A.N., & Clayton, G.C. 2001, ApJ, 551, 269
- Gordon & Clayton (1998) Gordon, K.D., & Clayton, G.C. 1998, ApJ, 500, 816
- Gordon et al. (1997) Gordon, K.D., Calzetti, D., & Witt, A.N. 1997, ApJ, 487, 625
- Haas et al. (2002) Haas, M., Klaas, U., & Bianchi, S. 2002, A&A, 385, L23
- Habart et al. (2001) Habart, E., Verstraete, L., Boulanger, F., Pineau des Forêts, G., Le Peintre, F., & Bernard, J.P. 2001, A&A, 373, 702
- Hecht (1986) Hecht, J.H. 1986, ApJ, 305, 817
- Helou et al. (2004) Helou, G., Roussel, H., Appleton P., et al. 2004, ApJS, 154, 253
- Hoopes et al. (1996) Hoopes, C.G., Walterbos, R.A., & Greenawalt, B.E. 1996, AJ, 112, 1429
- Hunter et al. (1989) Hunter, D.A., Gallagher, J.S., Rice, W.L., & Gillett, F.C. 1989, ApJ, 336, 152
- Joblin et al. (1992) Joblin , C., Léger, A., & Martin, P. 1992, ApJ, 393, 79
- Kennicutt (1989) Kennicutt, R.C. 1989, ApJ 344, 685
- Kennicutt (1984) Kennicutt, R.C. 1984, ApJ, 287, 116
- Kim et al. (2004) Kim, S.C., Sung, H., Park, H.S., & Sung, E.C. 2004, astro-ph/0404036
- Larsen (2004) Larsen, S.S. 2004, A&A, 416, 537
- Leitherer et al. (1999) Leitherer, C., Schaerer, D., Goldader, J.D., et al. 1999, ApJS, 123, 3
- Lequeux et al. (1982) Lequeux, J., Maurice, E., Prévot-Burnichon, M.L., et al. 1982, A&A, 113, L15
- Lu (2004) Lu, N. 2004, ApJS, 154, 286
- Martin et al. (2005) Martin, D.C., Fanson, J., Schiminovich, D., et al. 2005, ApJ, GALEX special issue letters, in press
- Mas-Hesse & Kunth (1999) Mas-Hesse, J.M., & Kunth, D. 1999, A&A, 349, 765
- Misselt et al. (2001) Misselt, K.A., Gordon, K.D., Clayton, G.C., & Wolff, M.J. 2001, ApJ, 551, 277
- Misselt et al. (1999) Misselt, K.A., Clayton, G.C., & Gordon, K.D. 1999, ApJ, 515, 128
- Morrissey et al. (2005) Morrissey, P., Schiminovich, D., Barlow, T.A., et al. 2005, ApJ, GALEX special issue letters, in press
- d’Odorico et al. (1983) d’Odorico, S., Rosa, M., & Wampler, E.J. 1983, A&AS, 53, 97
- Pannuti et al. (2000) Pannuti, T.G., Duric, N., Lacey, C., et al. 2000, ApJ, 544, 780
- Payne et al. (2004) Payne, J.L., Filipović, M.D., Pannuti, T.G., et al. 2004, A&A, 425, 443
- Pierini & Möller (2003) Pierini, D., & Möller, C.S. 2003, MNRAS, 346, 818
- Puche et al. (1990) Puche, D., & Carignan, C., & Bosma, A. 1990, AJ, 100, 1468
- Puget & Léger (1989) Puget, J.L., & Léger, A. 1989, ARA&A, 27, 161
- Rosa & Benvenuti (1994) Rosa, M.R., & Benvenuti, P. 1994, A&A, 291, 1
- Roussel et al. (2001a) Roussel, H., Sauvage, M., Vigroux, L., & Bosma, A. 2001a, A&A, 372, 427
- Roussel et al. (2001b) Roussel, H., Sauvage, M., Vigroux, L., et al. 2001b, A&A, 372, 406
- Sakata et al. (1994) Sakata, A., Wada, S., Tokunaga, A.T., Narisawa, T., Nakagawa, H., & Ono, H. 1994, ApJ, 430, 311
- Sauvage et al. (1990) Sauvage, M., Vigroux, L., & Thuan, T.X. 1990, A&A, 237, 296
- Schild et al. (2003) Schild, H., Crowther, P.A., Abbott, J.B., & Schmutz, W. 2003, A&A, 397, 859
- Sérsic (1966) Sérsic, J.L. 1966, ZA, 64, 212
- Vacca (1994) Vacca, W.D. 1994, ApJ, 421, 140
- Valencic et al. (2003) Valencic, L.A., Clayton, G.C., Gordon, K.D., & Smith, T.L. 2003, ApJ, 598, 369
- Vermeij et al. (2002) Vermeij, R., Peeters, E., Tielens, A.G., & van der Hulst, J.M. 2002, A&A, 382, 1042
- Wang & Heckman (1996) Wang, B., & Heckman, T.M. 1996, ApJ, 457, 645
- Webster & Smith (1983) Webster, B.L., & Smith, M.G. 1983, MNRAS, 204, 743
- Witt & Gordon (2000) Witt, A.N., & Gordon, K.D. 2000, ApJ, 528, 799
- Witt et al. (1992) Witt, A.N., Thronson, H.A., & Capuano, J.M. 1992, ApJ, 393, 611