Chandra Observations of A Galactic Supernova Remnant Vela Jr.: A New Sample of Thin Filaments Emitting Synchrotron X-Rays
Abstract
A galactic supernova remnant (SNR) Vela Jr. (RX J0852.04622, G266.61.2) shows sharp filamentary structure on the north-western edge of the remnant in the hard X-ray band. The filaments are so smooth and located on the most outer side of the remnant. We measured the averaged scale width of the filaments ( and ) with excellent spatial resolution of Chandra, which are in the order of the size of the point spread function of Chandra on the upstream side and 49.5 (36.0–88.8) arcsec on the downstream side, respectively. The spectra of the filaments are very hard and have no line-like structure, and were well reproduced with an absorbed power-law model with 2.67 (2.55–2.77), or a SRCUT model with = 4.3 (3.4–5.3) Hz under the assumption of . These results imply that the hard X-rays are synchrotron radiation emitted by accelerated electrons, as mentioned previously. Using a correlation between a function and the SNR age, we estimated the distance and the age of Vela Jr.: the estimated distance and age are 0.33 (0.26–0.50) kpc and 660 (420–1400) years, respectively. These results are consistent with previous reports, implying that –age relation may be a useful tool to estimate the distance and the age of synchrotron X-ray emitting SNRs.
1 Introduction
Supernova remnants (SNRs) play crucial roles for heating and chemical evolution of galaxies. Their shocks are also famous as cosmic-ray accelerators. Koyama et al. (1995) discovered synchrotron X-rays from shells of SN 1006, which is the first observational result indicating that SNRs accelerate electrons up to TeV. At present, several SNRs have been identified as synchrotron X-ray emitters (e.g. RX J1713.73946, Koyama et al. 1997; Slane et al. 1999; RCW 86, Bamba, Tomida, & Koyama 2000; Borkowski et al. 2001; Rho et al. 2002; Cas A., Vink & Laming 2003; see also Bamba et al. 2005; Bamba 2004).
The most plausible acceleration mechanism is the diffusive shock acceleration (DSA) (e.g. Bell, 1978; Drury, 1983; Blandford & Eichler, 1987; Jones & Ellison, 1991; Malkov & Drury, 2001), which can accelerate charged particles on the shock into a power-law distribution, similar to the observed spectrum of cosmic rays on the earth. However, since there is still little observational information and theoretical understanding, there are many unresolved problems, such as the injection efficiency, the maximum energy of accelerated particles, the configurations of magnetic field, and so on. The magnetic field amplification is also pointed out as an remarkable process (Bell & Lucek, 2001; Lucek & Bell, 2000). Recently, it is found that nonthermal X-rays from the shells of historical SNRs concentrate on very narrow filamentary regions (Bamba et al., 2003b, 2005). Together with the roll-off frequency () of synchrotron X-rays (Reynolds, 1998; Reynolds & Keohane, 1999), Bamba et al. (2005) found that an empirical function, , decreases with the age of an SNR (—age relation). The relation may reflect the time evolution of the magnetic field around the shock front (Bamba et al., 2005). However, the —age relation has still many uncertainties because of poor statistics. Clearly other new samples with synchrotron X-ray filaments are desired.
Vela Jr. (RX J0852.04622, G266.61.2) is one of the most curious galactic SNR with large radius of about 60 arcmin (Green, 2004). It was discovered by ROSAT (Aschenbach, 1998). and well known that the COMPTEL team reported a possible detection of MeV -ray line emitted by 44Ti (Iyudin et al., 1998). This fact strongly indicates that Vela Jr. is a nearby and very young SNR because the half lifetime of 44Ti is only about 60 years, however, there remains some doubt about the detection (Shonfelder et al., 2000). Tsunemi et al. (2000) reported the presence of Ca K line, suggesting that there are a plenty of Ca produced from 44Ti. On the other hand, Slane et al. (2001) reported that the 1 upper-limit of Sc-K line is cm-2s-1. Recently, Iyudin et al. (2005) found the possible detection of Ti and Sc K emission lines with XMM-Newton. For the 78.4 keV line emission from 44Ti, von Keinlin et al. (2004) obtained the upper-limit of cm-2s-1 with INTEGRAL/SPI. The presence of a central source has been also suggested (Aschenbach, 1998), which was confirmed with Chandra (Pavlov et al., 2001). The spectrum of the source, CXOU J085201.4461753, together with the absence of any optical counter part (Mereghetti, Pellizzoni, & de Luca, 2002), reminds us of a neutron star. These observational reports might indicate that the progenitor is a core-collapse supernova (SN).
The other fact which makes this SNR famous is the existence of nonthermal X-rays from the rims (Slane et al., 2001), which implies that the rims of Vela Jr. are cosmic ray accelerators like SN 1006 (Koyama et al., 1995) and other SNRs with synchrotron X-rays (e.g. Bamba, 2004, and references therein). Recently, TeV -rays with energies greater than 500 GeV are also detected at the 6 level from the north-western rim of the SNR with CANGAROO-II (Katagiri et al., 2005) and H.E.S.S. (Aharonian et al., 2005). These -rays are produced by accelerated electrons and/or protons with energies more than TeV.
Despite such an interesting source, the precise age of the remnant is still unknown. There are some spikes in nitrate concentration measured in an Antarctic ice core, which might be regarded as signals of SNe (Burgess & Zuber, 2000). One of them is not yet identified with historical SNe ever known. If the spike really associated with the progenitor of Vela Jr., the SN may have occurred around AD 1320 and the age of the remnant is about 680 yrs. However, there are many uncertainties, hence further studies are necessary. In addition, an unclear issue is the distance to the remnant, which brings us numerous information, such as the total luminosity of the 44Ti emission line, the average expansion velocity, and so on. It may also give us some answer on the current debate whether or not Vela (the distance of 250 pc; Cha et al., 1999) and Vela Jr. interact with each other. Iyudin et al. (1998) estimated the distance to be 200 pc with an assumption that the age is 680 years mentioned above, while Slane et al. (2001) suggested that the distance is 1–2 kpc from the relatively large absorption column. Although Moriguchi et al. (2001) observed the molecular distribution using 12CO (J = 1—0) emission with NANTEN, they could not determine the precise distance because the remnant is located near the tangential point of a galactic arm. The upper limit of the distance they estimated is 1 kpc.
In this paper, using the Chandra data for the first time, we report on the analysis of hard X-ray filaments associated with Vela Jr. and discuss on the acceleration mechanism at the shock of the SNR, its age, and the distance to the SNR. This paper is organized as follows. We summarize the observation details of Vela Jr. with Chandra in § 2. Section 3 describes the results of the observations. We discuss on 44Sc emission line reported by Iyudin et al. (2005) in § 4, the origin of nonthermal X-rays in § 5, on the interaction between the SNR and molecular clouds (§ 6), and on the origin of TeV -rays (§ 7). In § 8, we argue the distance and the age of the SNR using the correlation between a function and the SNR age.
2 Observations
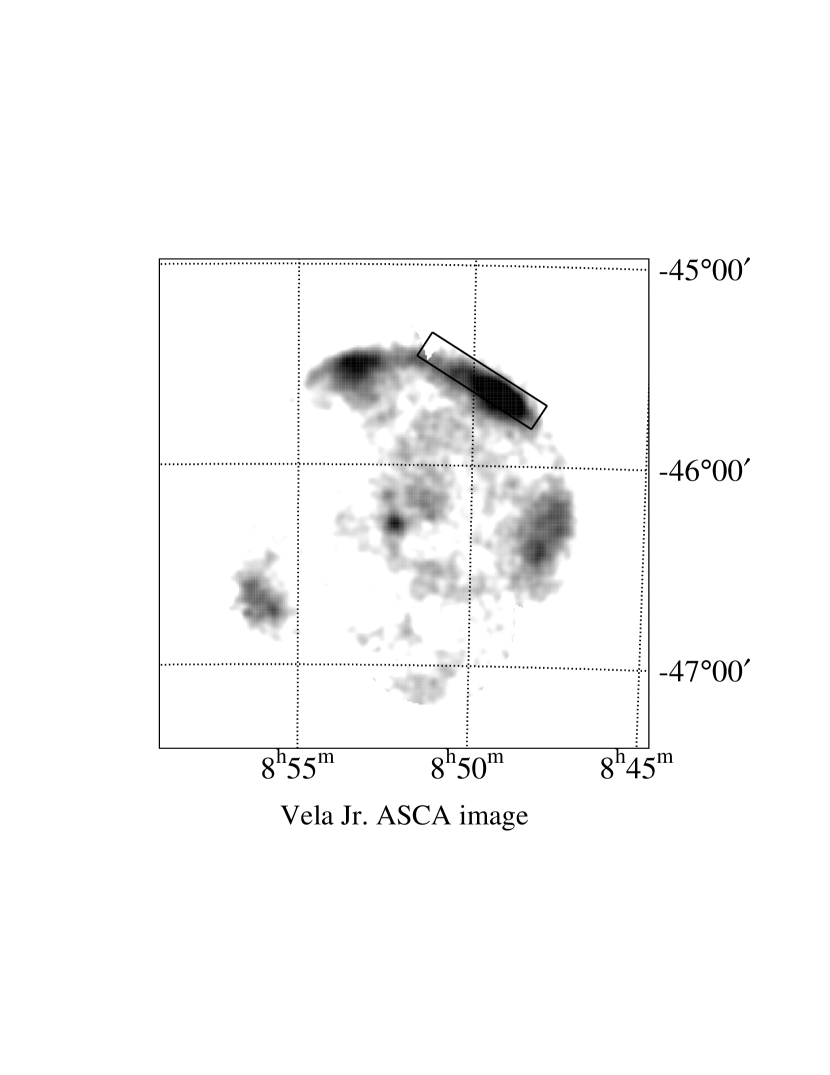
We used the Chandra archival data of the ACIS of the north-western (NW) rim of Vela Jr. (ObsID = 3846 and 4414). Figure 1 shows the ASCA GIS image (Tsunemi et al., 2000) with the field of view of Chandra observations. The satellite and the instrument are described by Weisskopf et al. (2002) and Garmire et al. (2000), respectively. Data acquisition from the ACIS was made in the Timed-Exposure Faint mode. The data reductions and analysis were made using the Chandra Interactive Analysis of Observations (CIAO) software version 3.0.2. Using the Level 2 processed events provided by the pipeline processing at the Chandra X-ray Center, we selected ASCA grades 0, 2, 3, 4, and 6, as the X-ray events. The “streak” events on the CCD chip S4 were removed by using the program destreak111See http://asc.harvard.edu/ciao2.3/ahelp/destreak.html. in CIAO. In order to make statistics better, we improved the astrometory of the data following the CIAO data analysis threads and combined these data. The exposure time of each observation is 39 ks (ObsID = 3846) and 35 ks (ObsID = 4414), respectively. Table 1 summarizes about these observations. Hereinafter, all results are from the combined data so far as there is no mention.
3 Results
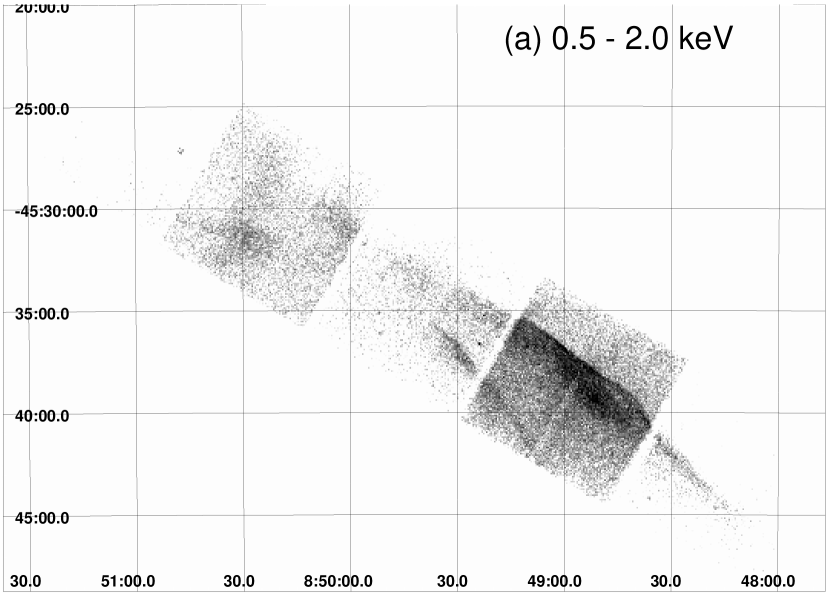
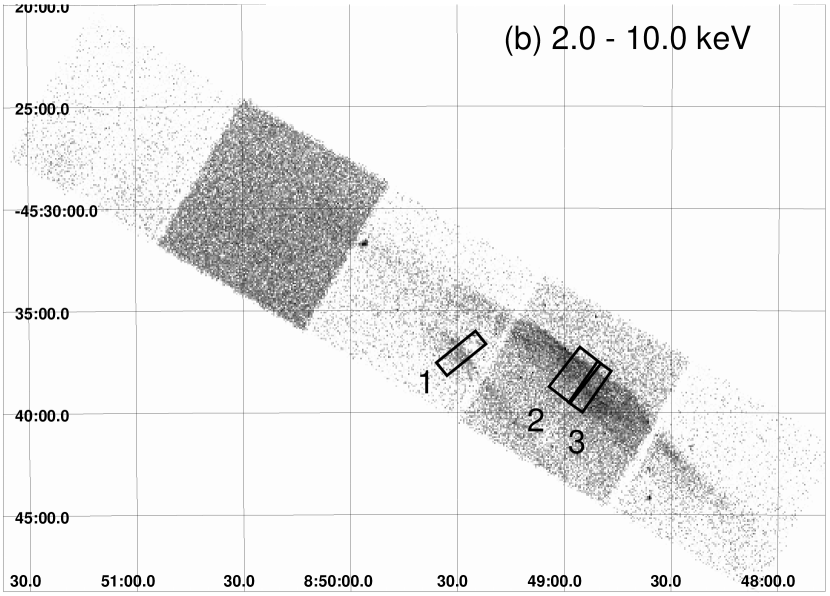
Figure 2 shows images of the NW rim in the 0.5–2.0 keV (a) and 2.0–10.0 keV (b) bands, binned with 4 arcsec scale. Neither the subtraction of background photons, smoothing process, nor correction of the exposure time did not be performed. The difference of background level among the chips are caused by that of the CCD chips (back-illuminated and front-illuminated). These images look alike, and show very straight filamentary structures clearly on the outer edge of the rim. Two filaments can be well recognized especially in the upper panel. Iyudin et al. (2005) suggests that the inner filament may be the reverse shock emission. However, we have no clue to distinguish whether it indicates the reverse shock or apparently overlaid forward shock via the projection effect. The filaments are very similar to those in SN 1006 (Long et al., 2003; Bamba et al., 2003b), indicating that they may be efficient accelerators of electrons like SN 1006 filaments. Then we made analysis in the same way to our previous one for SN 1006 (Bamba et al., 2003b).
For the first step, we made a spectrum from the whole emitting region of this rim. Since the rim is covered by two CCD chips (chip 6 and 7), source spectra were made separately from each chip. Background photons were accumulated from outer regions of the rim. All the spectra extend up to 2 keV, indicating that the hard X-ray emission is nonthermal. There is some line-like feature below 2 keV, which probably comes from thermal emission of Vela and/or Vela Jr. as already mentioned (Slane et al., 2001). Since our data does not have sufficient statistics to examine the properties of thermal plasma, we ignored the component. In Hiraga et al. (2005), detailed analysis for the thermal plasma is done with the XMM-Newton deep observation. We fitted the spectra with an absorbed power-law model only with photons above 2 keV, in order to avoid the contamination of thermal photons. The absorption column was subsequently calculated using the cross sections by Morrison & McCammon (1983) with the solar abundances (Anders & Grevesse, 1989). The best-fit parameters are shown in Table 2.
The best-fit values of the photon index and absorption column are consistent with those of the nonthermal component in previous results (Slane et al., 2001; Iyudin et al., 2005; Hiraga et al., 2005), indicating that almost all photons above 2 keV are nonthermal origin. Thus, we regarded all the photons above 2 keV as nonthermal in the following. As shown in Figure 2(b), three filaments were selected (filament 1–3) in order to study their spatial and spectral characteristics, which are straight and free from other structures, in the same way to the analysis of SN 1006 case (Bamba et al., 2003b). Since all the filaments are located within 4 arcmin from the aim-point (see Table 1), the size of a point spread function (PSF) is about 0.5 arcsec. Although we can see the filaments more clearly in the soft X-ray band in Figure 2, Bamba et al. (2003b) showed us that the contamination of thermal photons makes filaments broader. Therefore, we conducted the spatial analysis only with photons above 2 keV. Figure 3 shows spatial profiles of the filaments in the 2.0–10.0 keV (nonthermal) band binned to a resolution of 1 arcsec. We can see profiles with clear decays on the downstream sides and sharp edges on the upstream sides in all profiles. The filament 2 and 3 are double peaked, as suggested by Iyudin et al. (2005). To estimate the scale width of these filaments on upstream () and downstream () sides, we fitted them with exponential function as a simple and empirical fitting model for the apparent profiles, which is the same as used in the previous analysis in the SN 1006 (Bamba et al., 2003b) and other historical SNR (Bamba et al., 2005) cases. Background photons were not subtracted and treated as a spatially independent component. For the filament 3, the could not be determined due to the lack of statistics, then it was frozen to be the PSF size (0.5 arcsec). For each filament, fitting region was limited around the outermost peak in order to avoid the influence of the inner structure. The model well reproduced the data. The best-fit models and parameters are shown in Figure 3 and Table 3, respectively.
For the next step, we made spectra of the filaments. The background regions were selected from the downstream sides of the filaments, where there was no other structure. The spectra were so hard and fitted with an absorbed power-law model again. The absorption column was fixed to be in order to make statistics better, which is the best-fit value for the total region (Table 2) and consistent with previous results. The index of the power-law component is similar to those of nonthermal shells in other SNRs (SN 1006, Bamba et al. 2003b; RX J1713.73946, Koyama et al. 1997; Slane et al. 1999), which is considered to be synchrotron emission. Therefore, we concluded that the nonthermal emission in Vela Jr. shell is synchrotron, and applied the SRCUT model, which is one of the model representing the synchrotron emission from electrons of power-law distribution with exponential roll-off in a homogeneous magnetic field (Reynolds, 1998; Reynolds & Keohane, 1999). The spectral index at 1 GHz was fixed to be according to a report by Combi, Romero, & Benaglia (1999). Since the value is rather smaller than those of ordinary SNRs, about 0.5, we also tested the model under the assumption of . All models can reproduce the data with similar values of reduced as shown in Table 4.
4 Comments on 44Sc fluorescent line
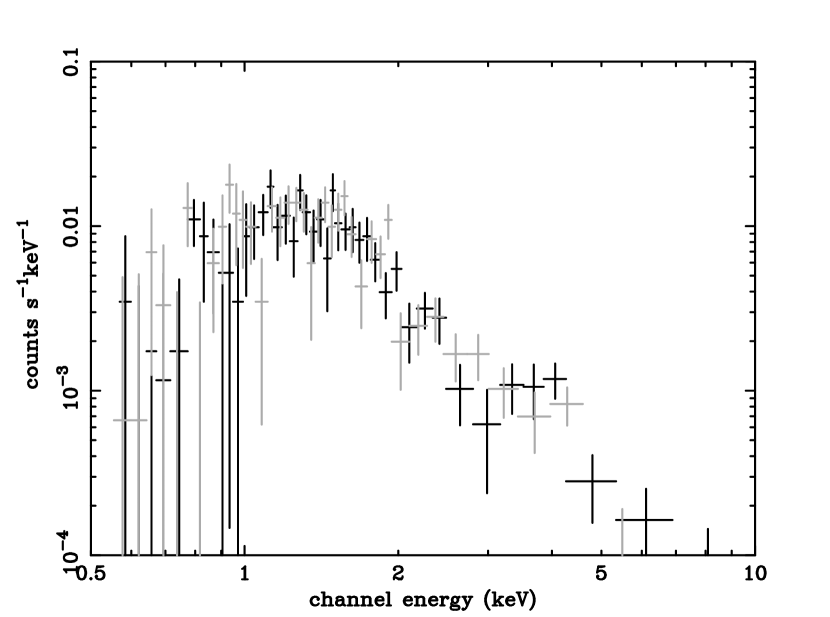
Iyudin et al. (2005) reported a significant emission line at 4.450.05 keV from the NW rim of Vela Jr. with XMM-Newton. We checked the spectrum of each filament as well as the averaged one so as to investigate the presence of some line-like feature. As a result, we found that the spectrum of filament 1 has an excess around 4 keV as shown in Figure 4, while the spectrum averaged for whole rim does not show the line feature. Since one can see the excess in the data of both observations, it may be a real line. Then, the power-law plus a narrow line model were applied and accepted, although the reduced does not improve significantly (/d.o.f.=69.5/79; see also Table 4). The center energy is keV, which is slightly lower than the averaged one by Iyudin et al. (2005) but consistent with the ASCA result (Tsunemi et al., 2000). The total flux, photons cm-2s-1, is about 10% of that derived by Iyudin et al. (2005) and Tsunemi et al. (2000), and consistent with the upper limit by Slane et al. (2001). The difference of the intensity may be because of our smaller region the spectra were accumulated than those by other authors. Moreover, the center energy and significance depend on the choice of the background region and the model of the continuum component. The lack of statistics prevents us from reliable conclusion. Detailed analysis with excellent statistics and spectral resolution are encouraged.
5 Origin of the Filaments
We found that the scale width of the filaments in Vela Jr. is much smaller than its radius. Filament 3 has a small in the order of Chandra PSF size (0.5 arcsec), indicating that the may be similar to or smaller than the PSF size. Although the other filaments have significantly larger than the PSF size, it may be caused by the projection effect or other structures, such as the second peak and/or other filaments. Therefore, we concluded that the scale width on the upstream side is similar to or smaller than the PSF size. On the other hand, the value of is much larger than the PSF size. These results are similar to other case of nonthermal filaments in young SNRs (Bamba et al., 2005). The power-law index is similar to the results with previous observations (Slane et al., 2001; Hiraga et al., 2005). These thin filaments with hard X-rays remind us the nonthermal X-rays from filaments in young SNRs. Wide band spectra of most of these SNRs show that the nonthermal X-rays are synchrotron radiation from highly accelerated electrons. Therefore, we consider that the filaments emit X-rays via synchrotron radiation. In order to confirm our conclusion, we need more information in the radio continuum band to make the wide band spectrum of synchrotron emission.
6 Interaction with Molecular Clouds?
The filaments in Vela Jr. are rather straight and their lengths are comparable to the radius of the SNR, that are similar to those in SN 1006 (Bamba et al., 2003b) and Tycho (Hwang et al., 2002), and are unlike clumpy filaments in Cas A (Vink & Laming, 2003), RCW 86 (Rho et al., 2002), and RX J1713.73946 (Uchiyama et al., 2003; Lazendic et al., 2004; Cassam-Chenaï et al., 2004). The former samples are located in tenuous interstellar space, whereas for the two SNRs in the latter cases, there are some reports about the interaction between shocks and molecular clouds (RCW 86: Moriguchi et al., private communication; RX J1713.73946: Fukui et al. 2003). Interactions with molecular clouds may distort beautiful filaments via turbulence and so on. There are molecular clouds around Vela Jr. (Moriguchi et al., 2001). However, it is not clear whether the shocks are interacting with them or not, because there is no observation with excited molecular cloud lines (CO(21) and so on). The straight filaments may indicate that there is no interaction between the shock and the molecular cloud in this region. Further observations with excited molecular lines are needed.
7 Origin of TeV -rays
Recently, two instruments have independently detected TeV -rays significantly (Katagiri et al., 2005; Aharonian et al., 2005). The reported differential flux is consistent with each other, but the photon index is slightly different. In this section, we examine the origin of the TeV -rays, considering the preferable values of the maximum energy of electrons () and the downstream magnetic field () (Yamazaki et al., 2004). Bamba et al. (2005) suggested that the width of the filament on the downstream side () and the roll-off frequency of synchrotron emission () reflect the value of and , then we can use these two observational value for the study on and . Hereinafter, we adopt flux-averaged mean values, such as
| (1) | |||||
| (2) |
where is the distance to Vela Jr. Considering the projection effect, can be written as
where , , , and are a correction factor of the projection effect, the compression ratio, the shock velocity, and synchrotron loss time scale (Bamba et al., 2005; Yamazaki et al., 2004). Although is an unknown parameter depending on the shape of profiles and the curvature radius, it becomes 1–10 as far as the width of filaments is negligible to the SNR radii (Berezhko & Völk, 2004). Then the above equations lead
| (3) |
On the other hand, the roll-off frequency is represented as (Reynolds & Keohane, 1999; Reynolds, 1998)222See http://heasac.gsfc.nasa.gov/docs/xanadu/xspec for the erratum of coefficients.
| (4) |
In the following, we adopt typical values and . Then, using Eqs. (3) and (4), we derived
| (5) | |||||
| (6) |
Katagiri et al. (2005) examined whether the TeV -rays arise from the inverse Compton emission via accelerated electrons or decay caused by accelerated protons. The former requires very high size ratio of X-ray and TeV -ray emission regions () and strong magnetic field of 1.6 mG. Then we obtain the shock velocity with eq.(6) as
| (7) |
so that the small distance, pc (the very small physical radius and the very young age, in other words) may be required, which is somewhat doubtful. This result is consistent with the discussion in Aharonian et al. (2005). On the other hand, -decay model, which requires the interaction of the SNR and molecular clouds, can naturally explain the multi-band spectrum (Katagiri et al., 2005). However, there might be some discrepancy between the observed straight filaments as discussed in § 6.
8 Estimation of the Age and the Distance
More determinative arguments on the distance () can be possible, and at this time, the age of the SNR () can be also discussed simultaneously. As a tool of the estimation, —age relation (Bamba et al., 2005) is used, where
| (8) | |||||
| (9) | |||||
| (10) |
Let () and () be the angular radius of the SNR and the observed angular scale width of synchrotron X-ray filaments on the downstream sides, respectively. Here is the radius of the SNR in the unit of pc. From the equation defining , we obtain
| (11) |
The thin solid and dashed lines in Figure 5 represent the relation between the age and the distance using eq.(11), (1), and (2).
On the other hand, is rewritten as
| (12) | |||||
| (15) |
The function is given by Truelove & McKee (1999) (see eq.(1) and (2), and table 6 and 7), which studies the shock dynamics of SNRs, where , , , and is the explosion energy in the unit of ergs, the ejecta mass in the unit of , the ambient density in the unit of g cm-3, and the time scale that SNRs enter the Sedov-Taylor phase (in which shock begins to deaccelerate due to the interstellar medium), respectively (Truelove & McKee, 1999). For simplicity, we consider the case of the constant interstellar medium, ,
where is the mean mass per hydrogen nucleus, g. In the following, we choose the kinetic energy of the ejecta, the ejecta mass, and to be ergs, 1.4, and 0.1 cm-3, respectively. Solving these equations, one can estimate both and .
Figure 5 represents the relation between the age and the distance. We derived the allowed range of the parameters to be
| (16) | |||||
| (17) |
When we vary the ambient number density into or the ejecta mass into , the result remains basically unchanged as can be seen in Figure 5.
Although the allowed regions are too wide to derive some conclusion, we may be able to say that Vela Jr. is a nearby and relatively young SNR. The results are consistent with previous reports, which may imply that this is an indirect confirmation of —age relation (Bamba et al., 2005) and our distance/age indicator may become a useful tool in the future. Furthermore, derived distance is significantly larger than that of Vela SNR (250 pc; Cha et al., 1999), then there may be no interaction between these two SNRs.
The most common distance indicator of SNR is an application of the relation between the surface brightnesses at 1 GHz and the diameters of SNRs (— relation; Case & Bhattacharya, 1998), however, the relation has still large uncertainties. Recent X-ray surveys recognize a new type of SNRs, which are dim in radio band and bright in hard X-ray band, such as RX J1713.73946 (Koyama et al., 1997), G28.60.1 (Bamba et al., 2001; Ueno et al., 2003), and so on (e.g. Combi et al., 2005; Yamaguchi et al., 2004). The number of such SNRs may be more than 20 (Bamba et al., 2003a). They must be significant accelerators of cosmic rays because most of them emit synchrotron X-rays, Unfortunately, they are dim in radio bands, so that the — relation cannot directly applied. Our method may also be an useful tool to estimate both and of such synchrotron X-ray emitting SNRs.
Again let us consider and using Eqs. (5) and (6). Assuming that , that is the most preferable value of our distance indicator, we obtain TeV and G. Although the uncertainty is very large, our result may indicate that the magnetic field is highly amplified.
These results does not include the uncertainty of the model of SNR dynamics and the function . Considered these uncertainty, the allowed regions for and become more larger. It is the uncertainty of ’s normalization which makes error regions the most widest, about 50%. In order to improve this method for and , more samples are needed to make the uncertainty of smaller.
9 Summary
We have conducted systematic spectral and spatial analysis of filamentary structures in Vela Jr. NW rim for the first time. A summary of our results is as follows:
-
1.
We found that nonthermal X-rays from Vela Jr. NW rim are concentrated on very thin filamentary structures. The average scale width on the upstream side is similar to or smaller than the PSF size of Chandra, whereas that on the downstream side is 49.5 (36.0–88.8) arcsec.
-
2.
The spectra of filaments are hard and have no line-like structure, which is well reproduced with an absorbed power-law model of = 2.67 (2.55–2.77), or SRCUT model with = 4.3 (3.4–5.3) Hz under the assumption of .
-
3.
We tried to estimate the distance and the age of Vela Jr. using the function and estimated that = 660 (420–1400) yrs and = 0.33 (0.26–0.50) kpc, which is consistent with previous reports. These results may suggest that there is no interaction between Vela SNR and Vela Jr.
-
4.
Using the estimated , we derived the most preferable values and G. Our result may imply that the magnetic field on the filament is highly amplified.
References
- Aharonian et al. (2005) Aharonian et al. 2005, accepted by A&Aletters (astroph/0505380)
- Anders & Grevesse (1989) Anders, E., & Grevesse, N. 1989, Geochim. Cosmochim. Acta, 53, 197
- Aschenbach (1998) Aschenbach, B. 1998, Nature, 396, 141
- Bamba et al. (2000) Bamba, A., Tomida, H., & Koyama, K. 2000, PASJ, 52, 1157
- Bamba et al. (2001) Bamba, A., Ueno, M., Koyama, K., & Yamauchi, S. 2001, PASJ, 53, L21
- Bamba et al. (2003a) Bamba, A., Ueno, M., Koyama, K., & Yamauchi, S. 2003a, ApJ, 589, 253
- Bamba et al. (2003b) Bamba, A., Yamazaki, R., Ueno, M., & Koyama, K. 2003b, ApJ, 589, 827
- Bamba (2004) Bamba, A. 2004, Ph.D. thesis (Kyoto University)
- Bamba et al. (2005) Bamba, A., Yamazaki, R., Yoshida, T., Terasawa, T., & Koyama, K. 2005, ApJ, 621, 793
- Bell (1978) Bell, A. R. 1978, MNRAS, 182, 443
- Bell & Lucek (2001) Bell, A. R. & Lucek, S. G. 2001, MNRAS, 321, 433
- Berezhko & Völk (2004) Berezhko, E.G., & Völk, H.J, 2004, A&A, 419, L27
- Blandford & Eichler (1987) Blandford, R. D., & Eichler, D. 1987, Phys. Rep., 154,1
- Borkowski et al. (2001) Borkowski, K. J., Rho, J., Reynolds, S. P. & Dyer, K. K. 2001, ApJ, 550, 334
- Blandford & Ostriker (1978) Blandford, R. D., & Ostriker, J. P. 1978, ApJ, 221, L29
- Burgess & Zuber (2000) Burgess, C. P. & Zuber, K. 2000, Astroparticle Physics, 14, 1
- Case & Bhattacharya (1998) Case, G. L., & Bhattacharya, D. 1998, ApJ, 504, 761
- Cassam-Chenaï et al. (2004) Cassam-Chenaï, G., Decourchelle, A., Ballet, J., Sauvageot, J.-L., Dubner, G., & Giacani, E. 2004, A&A, 427, 199
- Cha et al. (1999) Cha, A. N., Sembach, K. R., & Danks, A. C. 1999, ApJ, 515, L25
- Combi, Romero, & Benaglia (1999) Combi, J. A., Romero, G. E., & Benaglia, P. 1999, ApJ, 519, L177
- Combi et al. (2005) Combi, J.A., Benaglia, P., Romero, G.E., & Sugizaki, M. 2005, A&A, in press (astroph/0501051)
- Drury (1983) Drury, L.O’C. 1983, Rep. Prog. Phys., 46, 973
- Fukui et al. (2003) Fukui, Y., et al. 2003, PASJ, 55, L61
- Garmire et al. (2000) Garmire, G., Feigelson, E. D., Broos, P., Hillenbrand, L. A., Pravdo, S. H., Townsley, L.,& Tsuboi, Y. 2000, AJ, 120, 1426
- Green (2004) Green, D. A. 2004, A Catalogue of Galactic Supernova Remnants (2004 January version), (Cambridge, UK, Mullard Radio Astronomy Observatory) available on the WWW at http://www.mrao.cam.ac.uk/surveys/snrs/
- Hiraga et al. (2005) Hiraga, J. S., et al. 2005, ApJ, submitted
- Hwang et al. (2002) Hwang, U., Decourchelle, A., Holt, S. S., & Petre, R. 2002, ApJ, 581, 1101
- Iyudin et al. (1998) Iyudin, A. F., et al. 1998, Nature, 396, 142
- Iyudin et al. (2005) Iyudin, A. F., Aschenbachm B., Becker, W., Dennerl, K., & Haberl, F. 2005, A&A, 429, 225
- Jones & Ellison (1991) Jones, F.C., & Ellison, D.C. 1991, Space Science Rev., 58, 259 ApJ, 580, 1060
- Katagiri et al. (2005) Katagiri, H. et al. 2005, ApJ, in press (astro-ph/0412623)
- Koyama et al. (1997) Koyama, K., Kinugasa, K., Matsuzaki, K., Nishiuchi, M., Sugizaki, M., Torii, K., Yamauchi, S., & Aschenbach, B. 1997, PASJ, 49, L7
- Koyama et al. (1995) Koyama, K., Petre, R., Gotthelf, E.V., Hwang, U., Matsura, M., Ozaki, M., & Holt S. S. 1995, Nature, 378, 255
- Lazendic et al. (2004) Lazendic, J. S., Slane, P. O., Gaensler, B. M., Reynolds, S. P., Plucinsky, P. P., & Hughes, J. P. 2004, ApJ, 602, 271
- Long et al. (2003) Long, K. S., Reynolds, S. P., Raymond, J. C., Winkler, P. F., Dyer, K. K., & Petre, R. 2003, ApJ, 586, 1162
- Lucek & Bell (2000) Lucek, S. G. & Bell, A. R. 2000, MNRAS, 314, 65
- Malkov & Drury (2001) Malkov, E., & Drury, L.O’C. 2001, Rep. Prog. Phys., 64, 429
- Mereghetti, Pellizzoni, & de Luca (2002) Mereghetti, S., Pellizzoni, A., & de Luca, A. 2002, ASP Conf. Ser. 271: Neutron Stars in Supernova Remnants, 289
- Moriguchi et al. (2001) Moriguchi, Y., Yamaguchi, N., Onishi, T., Mizuno, A., & Fukui, Y. 2001, PASJ, 53, 1025
- Morrison & McCammon (1983) Morrison, R., & McCammon, D. 1983, ApJ, 270, 119
- Pavlov et al. (2001) Pavlov, G. G., Sanwal, D., Kızıltan, B., & Garmire, G. P. 2001, ApJ, 559, L131
- Reynolds (1998) Reynolds, S. P. 1998, ApJ, 493, 375
- Reynolds & Keohane (1999) Reynolds, S.P., & Keohane, J.W. 1999, ApJ, 525, 368
- Rho et al. (2002) Rho, J., Dyer, K. K., Borkowski, K. J., & Reynolds, S. P. 2002, ApJ, 581, 1116
- Shonfelder et al. (2000) Shonfelder, V., et al. 2000, in AIP Conf. Proc. 510, Fifth Compton Symp., ed. M. L. McConnell & J. M. Ryan (New York: AIP), 54
- Slane et al. (1999) Slane, P., Gaensler, B. M., Dame, T. M., Hughes, J. P., Plucinsky, P. P., & Green, A. 1999, ApJ, 525, 357
- Slane et al. (2001) Slane, P., Hughes, J. P., Edgar, R. J., Plucinsky, P. P., Miyata, E., Tsunemi, H., & Aschenbach, B. 2001, ApJ, 548, 814
- Truelove & McKee (1999) Truelove, J. K., & McKee, C. F. 1999, ApJS, 120, 299
- Tsunemi et al. (2000) Tsunemi, H., Miyata, E., Aschenbach, B., Hiraga, J., & Akutsu, D. 2000, PASJ, 52, 887
- Uchiyama et al. (2003) Uchiyama, Y., Aharonian, F. A., & Takahashi, T. 2003, A&A, 400, 567
- Ueno et al. (2003) Ueno, M., Bamba, A., Koyama, K., & Ebisawa, K. 2003, ApJ, 588, 338
- Vink & Laming (2003) Vink, J. & Laming, J. M. 2003, ApJ, 584, 758
- von Keinlin et al. (2004) von Keinlin, A., Atté, D., Schanne, S., Cordier, B., Diehl, R., Iyudin, A. F., Lichti, G. G., Roques, J. -P., Schönfelder, V., & Strong, A. 2004, Proc. of the 5th INTEGRAL Science Workshop, ESA SP-552 (astrpph/0407129)
- Weisskopf et al. (2002) Weisskopf, M. C., Brinkman, B., Canizares, C., Garmire, G., Murray, S., & Van Speybroeck, L. P. 2002, PASP, 114, 1
- Yamaguchi et al. (2004) Yamaguchi, H., Ueno, M., Koyama, K., Bamba, A., & Yamauchi, S. 2004, PASJ, 56, 1059
- Yamazaki et al. (2004) Yamazaki, R., Yoshida, T., Terasawa, T., Bamba, A., & Koyama, K. 2004, A&A, 416, 595


| ObsID | R.A. | Dec. | Date | Exposure (ks) |
|---|---|---|---|---|
| 3846 | 0849093 | -4537424 | 2003 Jan. 5 | 39 |
| 4414 | 0849093 | -4537423 | 2003 Jan. 6 | 35 |
| Parameters | Best-Fit Value |
|---|---|
| 2.67 (2.52–2.84) | |
| [ H cm-2]bbCalculated using the cross sections by Morrison & McCammon (1983) with the solar abundances (Anders & Grevesse, 1989). | 6.1 (2.4–9.9) |
| FluxccIn the 2.0–10.0 keV band. [ergs cm-2s-1] | 6.2 (5.9–6.5) |
| /d.o.f. | 114.4/135 |
| No. | Reduced | |||
|---|---|---|---|---|
| [cnts arcsec-1] | [arcsec] | [arcsec] | [/d.o.f.] | |
| 1 | 17.8 (15.8–19.9) | 19.0 (12.1–31.4) | 31.8 (23.7–47.1) | 143.4/121 |
| 2 | 41.4 (36.5–47.4) | 3.68 (2.69–5.75) | 65.0 (38.2–144.6) | 56/51 |
| 3 | 26.4 (22.4–30.7) | bbFixed to be 1 arcsec. | 37.1 (26.5–60.2) | 58/54 |
| meanccFlux-weighted mean value. | 49.5 (34.8–98.3) |
| power-law | srcut () | srcut () | |||||||
|---|---|---|---|---|---|---|---|---|---|
| No. | FluxbbAbsorption-corrected flux in the 2.0–10.0 keV band in the unit of ergs cm-2s-1. | /d.o.f. | ccRoll-off frequency in the unit of Hz. | ddFlux density at 1 GHz in the unit of Jy. | /d.o.f. | ccRoll-off frequency in the unit of Hz. | ddFlux density at 1 GHz in the unit of Jy. | /d.o.f. | |
| 1 | 2.87 | 0.74 | 76.2/81 | 2.7 | 4.4 | 79.2/81 | 3.7 | 148 | 76.1/81 |
| (2.71–3.06) | (0.63–0.85) | (1.8–3.8) | (2.8–3.8) | (2.6–5.8) | (95–230) | ||||
| 2 | 2.59 | 1.8 | 137.3/118 | 5.3 | 1.2 | 141.3/118 | 8.2 | 120 | 141.3/118 |
| (2.44–2.74) | (1.6–2.1) | (3.6–7.3) | (1.1–1.3) | (5.5–12.8) | (113–127) | ||||
| 3 | 2.45 | 0.76 | 56.2/44 | 7.4 | 0.93 | 57.7/44 | 11.6 | 32 | 57.4/44 |
| (2.23–2.68) | (0.61–0.92) | (4.1–13.2) | (0.84–1.01) | (6.4–25.7) | (28–36) | ||||
| Total | 2.67 | 3.2 | 276.8/245 | 4.3 | 8.8 | 286.6/245 | 6.6 | 282 | 284.9/245 |
| (2.57–2.77) | (2.9–3.6) | (3.4–5.3) | (8.1–9.5) | (5.0–8.7) | (262–301) | ||||
Note. — The absorption column was fixed to be H cm-2 according to Table 2.