Anti-correlated hard X-ray time lag in GRS 1915+105: evidence for a truncated accretion disc
Abstract
Multi-wavelength observations of Galactic black hole candidate sources indicate a close connection between the accretion disk emission and the jet emission. The recent discovery of an anti-correlated time lag between the soft and hard X-rays in Cygnus X-3 (Choudhury & Rao, 2004) constrains the geometric picture of the disk-jet connection into a truncated accretion disk, the truncation radius being quite close to the black hole. Here we report the detection of similar anti-correlated time lag in the superluminal jet source GRS 1915+105. We show the existence of the pivoting in the X-ray spectrum during the delayed anti-correlation and we also find that the QPO parameters change along with the spectral pivoting. We explore theoretical models to understand this phenomenon.
Subject headings:
accretion – binaries : close – stars : individual (GRS 1915+105) – X-rays : binaries1. Introduction
In the current era, discerned by the wide band X-ray spectral capability of the present day X-ray satellite observatories, the non-thermal component in the hard X-ray spectrum has emerged to be the most prominent and intriguing observational feature of the Galactic black hole candidates (see Barret, 2004, for a short review). Various conflicting hypotheses concerning the physical mechanism of the origin of this non-thermal emission have been offered to explain the phenomenon; ranging from synchrotron at the base of the jet (Markoff et al., 2001, 2003) to Comptonization of thermal photons by a hot corona with various geometrical structures (see, for eg., Poutanen, 1998) – the most favored being that of a hot quasi-spherical cloud inside a truncated disc (Zdziarski et al., 2002). In recent times, the existence of a truncated accretion disk near black holes is establishing itself as an emerging independent paradigm, with diverse theoretical formalisms, viz. ADAF (Narayan & Yi, 1994) and TCAF (Chakrabarti, 1996), requiring the given geometrical structure. The detection of an anti-correlated delay ( 1000 s) of the hard X-ray (20–50 keV) emission with respect to the soft X-ray (2–7 keV) emission in the X-ray hard state of the enigmatic X-ray binary Cygnus X-3 (Choudhury & Rao, 2004), giving rise to the pivoting behaviour in the spectrum (Choudhury et al., 2002), adds credence to this paradigm of truncated accretion disc, with the inner region consisting of (quasi-)spherical flow of highly energetic matter Comptonizing the soft seed thermal photons from the outer disc. The time scale of this delay may be attributed to the viscous time scale of flow of matter in the radiation pressure dominated optically thick accretion disk.
GRS 1915+105 (Castro-Tirado et al., 1992) is a black hole binary system which displays the most varied types of emission states ever seen in a Galactic microquasar, with the time scale of spectral variations/transitions ranging from minutes to months. Among all the various classes of behavioural features exhibited by GRS 1915+105, in the state (Belloni et al., 2000) it exhibits steady X-ray emission for long durations, further characterized by a pronounced QPO feature. McClintock & Remillard (2004) have examined the spectral classifications of black hole sources and have concluded that GRS 1915+105, in its steady states, shows characteristics closer to the Thermally Dominant state or Low Hard sates. The state, with its band limited power density spectrum, resembles the characteristics of the Low Hard state (though the luminosity and the X-ray spectral index are slightly different from those found in other black hole sources). In this state the X-ray spectra display a pivoting behaviour (for spectra obtained on different days, spanning the extent of the hard state), very similar to Cygnus X-3 (Choudhury et al., 2003). Also, the soft X-ray flux is correlated to the radio emission in this state, with the correlation spanning across 5 orders of magnitude of intrinsic luminosity for various black hole candidates (Choudhury et al., 2003), suggesting that the soft X-ray flux is driving both the hard X-ray as well as radio emission. Given the universality of the correlated behaviour of these systems, and the similarity of the spectral evolution in this state of GRS 1915+105 with Cygnus X-3, it was imperative that an anti-correlated delay between the hard and soft X-rays, analogous to Cygnus X-3, be present in GRS 1915+105, in the state.
Here we report the presence of such an anti-correlated time lag of the hard X-ray (20 – 50 keV) emission to that of the soft X-ray (2 – 7 keV) emission observed in six pointed observations by RXTE-PCA during the state of GRS 1915+105. During these particular pointings the ‘in situ’ pivoting feature in the spectra is seen similar to what reported for Cygnus X-3 (Choudhury & Rao, 2004). More importantly, we also report a corresponding change in the Quasi Periodic Oscillations (QPO) parameters ubiquitously present in the low hard state of this source, most notably being the shift in the centroid frequency.
2. Data and Analysis
The pointed observations of the narrow field of view instrument PCA aboard the RXTE are used for the timing as well as the spectral analysis. The lightcurves for the cross-correlation tests as well as the spectra (obtained from the PCA) use the standard 2 form of data (all PCUs added), with all the procedures of data filtering, background and deadtime corrections strictly adhered to. The lightcurve for the QPO analysis was obtained from the single bit mode data, covering the 2–7 keV band. The data reduction and analysis was carried out using HEASOFT (v5.2), which consists of (chiefly) FTOOLS (V5.2), XRONOS (v5.19) and XSPEC (V11.2).
2.1. Data Selection
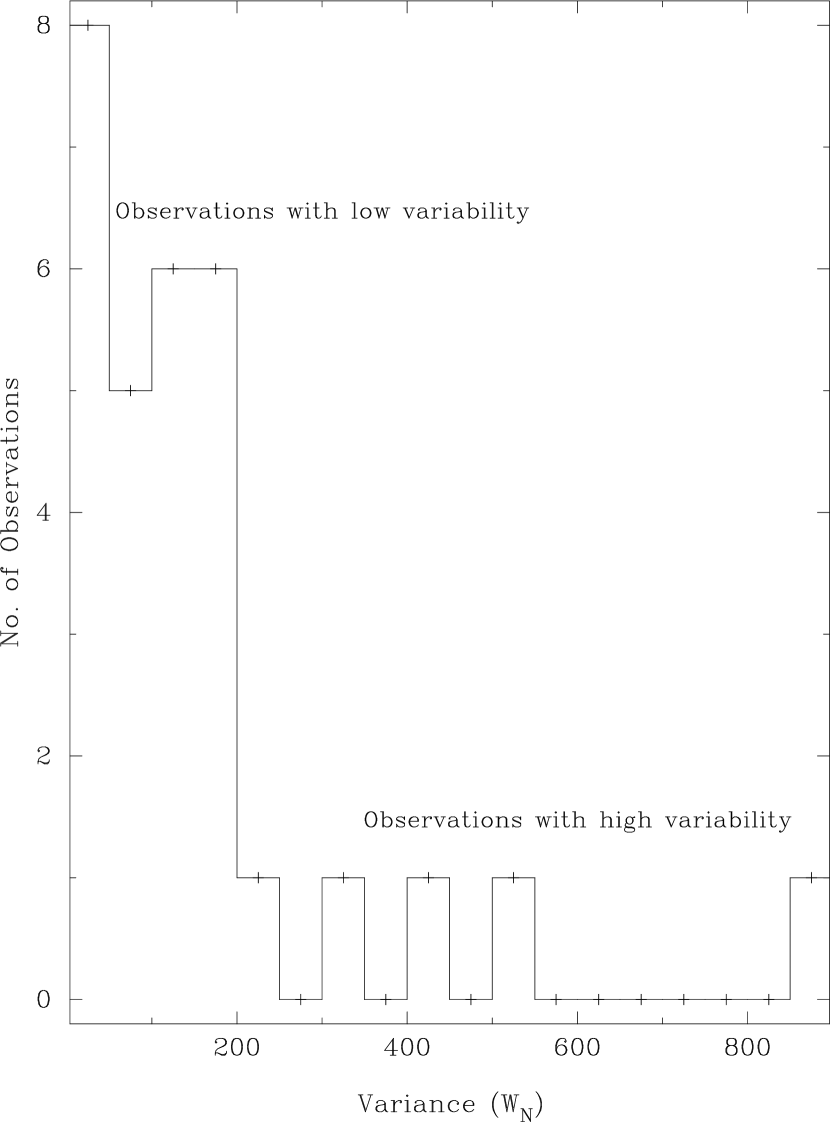
This source is extremely variable in nature and it has been classified into several variability classes (Belloni et al., 2000). Based on the RXTE pointed observations carried out in 1996-1997, Belloni et al. (2000) have identified long duration steady hard states (the ‘C’ state in their nomenclature) as the class. As discussed by McClintock & Remillard (2004) (see also Rao et al. 2000a and Vadawale et al 2001), this is the closest analogue to the canonical low-hard states of Galactic black hole sources, and it is in this state that the source seems to spend the most of its time. This state is further subdivided into 4 subclasses, to . The subclasses to are the long uninterrupted steady states whereas the class is a collection of isolated individual pointed observations with properties similar to to classes. Since a portion of other variability classes (like the class) can look like the class, we have only taken the to classes for the present study. Belloni et al. (2000) classification covers a total of 49 pointed observations from RXTE-PCA covering the early years of its operation with the source in the state, of these the (1–3) states consist of 30 observations (with some long observations separated into more than one observation IDs., in the RXTE data archives). All these observations pertaining to the (1-3) state, as per the classification covered by Belloni et al. (2000), was inspected for the presence of the anti-correlated lag between the hard (20–50 keV) and soft (2–7 keV) emission, following the analogous results obtained for Cygnus X-3 (Choudhury & Rao, 2004). Considering the fact that the mechanism causing the change in the soft X-ray spectrum (the accretion rate being one of the the most likely candidate), withthe corresponding delayed opposite change in the hard X-ray emission, is very unlikely to be a continuous process, a large number of long pointed observations are needed to serendipitously capture the occasional individual events that may have occurred during the pointings. The 30 observations (pertaining to the (1–3) states) are classified according to the variability exhibited by the source during the each particular pointed observation. To check for the variability we obtain the variance from a constant fit to the lightcurve (binned to ), normalized to the number of time bins (WN). The histogram giving the number of observations as a function WN is plotted in Figure 1, where it is clearly seen that for values of WN 250 there are four observations (occurring on MJD 50441-42, 50477, 50480, 50729) corresponding to the high variability cases, within the class of observations considered by us. It is interesting to note that the lagged anti-correlation of the hard X-rays (20-50 keV) with respect to the soft X-ray (2-7 keV) is seen in all these four cases. In Figure 1 only one observation corresponds to the variability measure (WN) in the range 200-250, and this band we use to demarcate the boundary of high and low variability, and this observation gives a marginal detection of the anti-correlated delay. Of the 25 observations corresponding to the low variability cases (Figure 1), only in one case the lagged anti-correlation is seen, in no other case there is any detection of the delay in the correlation results. The presumption behind the classification with respect to the variability was that the observations during which significant variability is seen will be the ones where noticeable features of the lagged anti-correlation can be obtained. Of course this precludes the fact that the variability should be non-monotonic in nature because, firstly the continuous monotonic evolution will result in state transition, and secondly, more importantly from the observational purview, a non-monotonic evolution with a point of maxima/minima is the best feature to measure the delay in the anti-correlation.

| MJD | Obs. Id. | Delay (sec) (error) | statistical correlation coefficient | ||
|---|---|---|---|---|---|
| F.F.T. (error) | Pearson (Null. Prob.) | Spearman (Null. Prob.) | |||
| 50441-42 | X-08-00, -08-01 | 220–1000 | |||
| 50477 | X-13-00 | ||||
| 50480 | X-14-00 | ) | |||
| 50729 | X-49-00 | ||||
| 5043611marginal case | X-07-00 | ||||
| 5045522anomalous case | X-10-00 | ||||
2.2. Hard X-ray delay and pivoting in the spectrum
Of the observations listed by Belloni et al. (2000) belonging to the (1–3) states, on four occasions (Figure 2), corresponding to the high variability cases (Figure 1), the cross-correlation results show the hard X-rays to be anti-correlated and lagging with respect to the soft X-ray emission (the details are given in Table 1). The cross-correlation is initially obtained using the XRONOS program ‘crosscor’, which uses the F.F.T. algorithm to compute the coefficient which is normalized by the square root of the product of number of good newbins of the concerned lightcurves, effectively this coefficient is the cross covariance of the two lightcurves. On MJD 50441-42, 50477 & 50480 the source was in the 2 state (also known as the radio-quiet state - Vadawale et al, 2001), and on MJD 50729 the source was in the 3 state (the radio-loud state). We further substantiate the correlation results by performing the Pearson’s test as well as the Spearman’s rank correlation test after correcting for the delay of the hard X-ray flux for each corresponding observation, the coefficients thus obtained are given in Table 1. In obtaining these coefficients, we have used data corresponding to only those time stamps for which both the fluxes are present after shifting the hard X-ray lightcurve to correct for the delay. In these cases if the hard X-ray lightcurve is not compensated for the delay, the correlation coefficients obtained are as follows; MJD 50441-42 – Pearson’s = 0.09 & Spearman’s = 0.12, MJD 50477 – Pearson’s = -0.03 & Spearman’s = 0.02, MJD 50480 – Pearson’s = -0.04 & Spearman’s = -0.06, MJD 50729 – Pearson’s = -0.28 & Spearman’s = -0.26. Comparing these values with the coefficients obtained for the delay compensated hard X-ray lightcurves (table 1) establishes that these 4 observations pertaining to the high variability cases, within the (1–3) class, do indeed exhibit this physical phenomenon of the hard X-ray emission being delayed as well as anti-correlated to the soft X-ray emission process. The relative closeness of the Pearson’s and Spearman’s rank (anti-)correlation values in the two cases (with and without the compensation for the delay in the hard X-rays) on MJD 50729 is easily attributed to the fact that the lag measured in this occasion is only .


On all these 4 days, the X-ray spectral evolution displays a pivoting pattern, during the individual pointings. The time scale of the delay in the cross-correlation gives the time scale for the spectra to harden after the softer flux decreases and/or vice-versa. The interesting feature in the spectral evolution is the difference in the pivot point on the different days, which further underlines the unique diverse variability features of this source. In the source, the pivoting occurs around 7 keV on MJD 50477 & 57480 and in the range 10–20 keV on MJD 50441-42 & 50729 (Figure 3, in contrast to the energy region of keV for observation taken on different days (Choudhury et al., 2003). Trudolyubov et al. (1999) & Trudolyubov (2001) have covered a large set of observations of GRS 1915+105 during this era, which overlaps with the states reported here. As reported by them, the spectra do show pivoting at similar energy, but for observations on different days. In Table 1, we report the time scale of this spectral evolution from the cross-correlation results, from observations with in the span of one pointed observations.
X-ray spectral fitting.
We have used the model prescribed by Vadawale et al (2003) to unfold the count spectrum. The value of the parameters and the error bars are similar to the other state spectra mentioned in Vadawale et al (2003). Detailed spectral analysis is out of scope of this paper and not needed as the given results are model independent, for the purpose of the spectral fit was to mimick the shape of the count spectrum in order to unfold it and not to provide any physical interpretation from the fit parameters.
2.3. Quasi Periodic Oscillation
Quasi periodic oscillation is an ubiquitous feature of this source in the low state. To characterize the nature of the physical phenomenon giving rise to the lagged anti-correlation, we have done a detailed study of the QPO characteristics, corresponding to the comparative softer and harder regions of the lightcurve. The power density spectra (PDS) was obtained from the single bit mode of data in the 2-7 keV band, with a bin size of 10 ms, using the XRONOS program ‘powspec’. This program where the PDS was computed by an FFT algorithm and the errors were obtained by propagating the theoretical error bars of the spectra from individual intervals (from the relevant chi-square distribution), while the normalization was such that the integral of the spectra gives the squared rms fractional variability (with the white noise subtracted). The QPO parameters were obtained by fitting a powerlaw to model the continuum of the PDS and a Lorentzian to fit the QPO profile (Figure 4), the details of which are given in Table 2. The centroid frequency of the QPO evolves consistently with the minute change in the X-ray emissions during the individual pointed observations. The frequency always has a higher value at the softer region of the X-ray emission. Further, the rms variability of the QPO is always more in the harder region of the lightcurve. This small but indisputable and consistent change in the QPO parameters provide further validation of the small but definitely perceptible change in the accretion state in the system during these episodes of soft X-ray emission impelling the hard X-ray emission, in the steady low states. Trudolyubov et al. (1999) & Trudolyubov (2001) have obtained the centroid frequencies of the QPO during the four states reported here, averaged over the entire individual observations, the values of which indeed lie between the two values obtained by us corresponding to the softer and harder regions of the lightcurve (except for observation on MJD 50477, when the averaged value coincides with the centroid frequency in the softest region of the lightcurve – Table 1).
| Centroid frequency, (Hz) | FWHM | RMS fluctuation | |||||||
|---|---|---|---|---|---|---|---|---|---|
| MJD | soft | hard | soft | hard | soft | hard | |||
| 50441-42 | 0.77 | 0.83 | 8.18 | 9.3 | |||||
| 50477 | 0.64 | 0.58 | 7.36 | 7.61 | |||||
| 50480 | 0.5 | 0.48 | 6.82 | 7.75 | |||||
| 50729 | 0.36 | 0.26 | 7.60 | 7.80 | |||||
| 5043611marginal case | 0.68 | 0.70 | 9.16 | 9.64 | |||||
| 5045522anomalous case | 0.38 | 0.53 | 8.23 | 8.74 | |||||
2.4. Marginal and anomalous cases
In Figure 1 the low variability and high variability cases are demarcated by the histogram bin corresponding to WN value of 200-250 which has only one observation (MJD 50436), and indeed there is a detection of lagged anti-correlation with a comparative smaller value of coefficient, and we classify this as the marginal case of detection of lagged anti-correlation. The lightcurve and the cross-correlation results are shown in Figure 5 (bottom panels). As is the normal case with the other observations without the lagged anti-correlation, at zero delay it shows a fairly strong positive correlation (but not so strong as the normal lower variability cases) but it shows a definite, albeit comparatively weaker, anti-correlation at a delay of . The spectra shows a weak pivoting at keV (Figure 6), and also the QPO parameters vary according to the so far established pattern (Figure 7), with the centroid frequency shifting by 0.1 Hz, whereas for the other high variability cases the shift is of the order of Hz (Table 2). This particular observation does indicate a gradual progression of the physical properties and phenomena which may be classified by the empirical measure of variability quantified in Figure 1.


Of the 25 cases of the low variability observations, only in one case the presence of the lagged anti-correlation is seen (on MJD 50455). Since this marks as an exception to the general behaviour, we classify this particular observation as anomalous case. The cross-correlation, depicted in Figure 5 (top panels), shows anti-correlation of the hard X-rays (20-50 keV) with respect to soft X-rays (2-7 keV), with a delay that is fairly widely spread, albeit with as strong and significant cross correlation coefficient as the high variability cases, but the Pearson and Spearman’s rank coefficient (after compensating the for a delay of in the hard X-ray emission) are significantly weaker.
3. Discussion
In Choudhury et al. (2003) it was shown that the characteristics of X-ray emission in the hard state of the Galactic black hole binary systems seem to possess universal features, leading to the picture of a truncated accretion disk system. Diverse sources, viz. Cygnus X-3, GRS 1915+105, Cygnus X-1 & GX 339-4 showed similar pivoting in X-ray spectrum, with the pivot point varying for the different sources. This pivot point was considered to be dependent on the extent of the truncation radius. In this geometrical structure, the Compton scattered X-rays originate from a region close to the compact object inside the truncated disk, giving rise to the non-thermal component in the hard X-ray regime. The extent of the accretion disk determines the amount of seed photons available for the Comptonizing component. With any change in the extent of the truncation radius (probably due to change in accretion rate) there is an opposite change in the flux of the Comptonizing component in the spectrum, leading to the anti-correlation between the hard and soft X-rays. This physical picture is applicable for all the models that require a truncated disk, viz. ADAF (Narayan & Yi, 1994) or TCAF (Chakrabarti, 1996).
Choudhury & Rao (2004) discovered a lagged anti-correlation between the hard and soft X-rays in Cygnus X-3, roughly the origins of which can be ordained to be from the inner Comptonizing cloud and the thermal disk, respectively. This delay may be attributed to the viscous time scale of matter in the truncated thermal disc, which is the readjustment time scale of the disk as well as the inner Comptonizing cloud. In this scenario, the soft X-ray flux changes due to any inherent accretion process (viz. the accretion rate), and after a lag of the observed time scale the disk readjusts its geometrical size effecting an opposite change in the Comptonizing cloud in the inner regions, and thence the non-thermal component of the spectra changes, resulting in the pivoting phenomenon.
Due to the similarity of the features of the X-ray emissions of GRS 1915+105 with that of Cygnus X-3 in the hard state we were prompted to search for analogous lagged anti-correlation of the hard X-ray emission (20-50 keV) with respect to the soft X-ray emission (2-7 keV) resulting in the pivoting in the spectrum. Inspection of all the observations compiled by Belloni et al. (2000) yielded 4 occasions when the pointed RXTE-PCA observations were able to catch the serendipitous events leading to the restructuring of the accretion system. The difference in the pivot point in the spectra for 3 and 2 (sub)states suggest that the intrinsic accretion system GRS 1915+105 is more complex than that of Cygnus X-3 with the broad scenario of the accretion system in the two (sub)states being not exactly the same. But the short time scale evolution of the accretion system in the X-ray hard state, resulting in the readjustment in the disk structure and size, is similar for both the (sub)states.
The presence of low-frequency QPO in GRS 1915+105 (Muno et al., 1999) is an inherent feature of the X-ray hard state (Rao, 2001). Various prescriptions exist without any general consensus as to the precise nature of this temporal characteristic. These low-frequency QPOs are found to be correlated to observed phase-lag in the Fourier cross-spectrum for two different channels (Reig et al., 2000) which may arise from the Compton spectrum in the inner regions of the disk (Nobili et al., 2000). Further, the centroid frequency is shown to be correlated to the spectral index (of the SED) in the hard state (Vignarca et al., 2004). Rao et al. (2000b) found the low-frequency QPO in the 3 state to originate in the region of the Comptonizing cloud, while Chakrabarti & Manickam (2000) interpret the QPO as due to oscillation of the region responsible for the hard X-ray emission. Arguing on a similar vein Titarchuk & Fiorito (2004) provide a two component model with a truncated thermal accretion disk with a quasi-spherical ‘transition layer’ inside (TL model) giving rise to the hard X-ray emission as well as the QPO. The general consensus seems to converge toward the idea that a physical model for the compact corona must naturally produce oscillations on time scales of hours to days (Remillard, 2004). Models not conforming directly to this geometrical structures, viz. magnetic flood scenario (Tagger & Pellat, 1999) leading to ‘accretion ejection instability’ (Tagger et al., 2004) also invoke advection as a necessary element of the theoretical formalism, and the QPOs are supposed to originate at inner regions of the accretion. The consistent increase in the centroid frequency of the QPO with the softening of the X-ray emission, in the small scale reported here, provides additional support as well as constraint on the physical scenario favoring a truncated disk and high energy inflow inside. This increase in frequency may indicate the decrease in truncation radius, resulting in a physically and geometrically bigger accretion disc (rendering the increased softness of the spectrum). Also, the decrease in the rms variability of the QPO with increasing softness may indicate the decrease in volume of the Comptonizing cloud, under the assumption that the physical origin of the QPO phenomenon lies in this highly energetic matter.
The discovery of the hard X-ray delay (anti-correlated) in the hard state of this source (second after Cygnus X-3) represses the accretion models without a truncated disk. In addition to the pivoting in the spectra, the consistent increase in the QPO centroid frequency puts the observational feature on very firm footing. Further search for such features in sources like Cygnus X-1 and GX 339-4, where the pivot point is at higher energy, 50–80 keV & 300 keV, respectively, is needed to get a complete picture of the X-ray emission in the hard state.
Acknowledgments
This research has made use of data obtained through the HEASARC Online Service, provided by the NASA/GSFC, in support of NASA High Energy Astrophysics Programs.
References
- Belloni et al. (2000) Belloni, T., Klein-Wolt, M., Mendez, M. et al. 2000, A&A, 355, 271
- Barret (2004) Barret, D. 2004, in AIP Conf. Ser. 703, Plasmas in the Laboratory and in the Universe, New Insights and New Challenges (Melville: AIP), 238 [astro-ph/0401100]
- Castro-Tirado et al. (1992) Castro-Tirado, A.J., Brandt., S. & Lund, N. 1992, IAU Circ., 5590
- Chakrabarti & Manickam (2000) Chakrabarti, S.K. & Manickam, S.G. 2000, ApJ, 531, L41
- Chakrabarti (1996) Chakrabarti, S.K. 1996, Phys. Rep., 266, 229
- Choudhury & Rao (2004) Choudhury, M., & Rao, A.R. 2004, ApJ, 616, L143
- Choudhury et al. (2003) Choudhury, M., Rao, A.R., Vadawale, S.V. and Jain, A.K. 2003, ApJ, 593,452
- Choudhury et al. (2002) Choudhury, M., Rao, A.R., Vadawale, S.V., et al. 2002, A&A, 383, L35
- Markoff et al. (2001) Markoff, S., Falcke, H. & Fender, R. 2001, A&A, 372, L25
- Markoff et al. (2003) Markoff, S., Nowak, M., Corbel, S., et al. 2003, A&A, 397, 645
- McClintock & Remillard (2004) McClintock, J.E. & Remillard, R.A. 2004, to appear in Compact Stellar X-ray Sources, W.H.G. Lewin and M. van der Klis eds., Cambridge University Press, preprint (astro-ph/0306213)
- Muno et al. (1999) Muno, M.P., Morgan, E.H. & Remillard, R.A. 1999, ApJ, 527, 321
- Narayan & Yi (1994) Narayan, R. & Yi, I. 1994, ApJ, 428, L13
- Nobili et al. (2000) Nobili, L., Turolla, R., Zampieri, L. & Belloni, T. 2000, ApJ, 538, L137
- Poutanen (1998) Poutanen, J. 1998, in Theory of Black Hole Accretion Discs, M. A. Abramowicz, G. Bjornsson & J. E. Pringle, eds., Cambridge Contemporary Astrophysics, Cambridge University Press, 100p.
- Rao (2001) Rao, A.R. 2001, A&AS, 276, 175
- Rao et al. (2000a) Rao, A. R., Yadav, J. S. & Paul, B. 2000a, ApJ, 544, 443
- Rao et al. (2000b) Rao, A. R., Naik, S., Vadawale, S.V. & Chakrabarti, S.K. 2000b, A&A, 360, L25
- Reig et al. (2000) Reig, P., Belloni, T., van der Klis, M., Mendez, M., Kylafis, N.D. & Ford, E.C. 2000, ApJ, 541, 883
- Remillard (2004) Remillard, R.A. 2004, in AIP Conf. Ser. 714, X-ray Timing 2003: Rossi and Beyond (Melville: AIP), 13
- Rodriguez et al. (2004) Rodriguez, J., Corbel, S., Hannikainen, D.C., Belloni, T., Paizis, A. & Vilhu, O. 2004, ApJ, 615, 416
- Tagger & Pellat (1999) Tagger, M. & Pellat, R. 1999, A&A, 349, 1003
- Tagger et al. (2004) Tagger, M., Varniere, P., Rodriguez, J. & Pellat, R. 1999, ApJ, 607, 410
- Titarchuk & Fiorito (2004) Titarchuk. L. & Fioroti, R. 2004, ApJ, 612, 988
- Trudolyubov et al. (1999) Trudolyubov, S.P., Churazov, E.M. & Gilfanov, M.R. 1999, Astronomy Lett., 25, 718
- Trudolyubov (2001) Trudolyubov, S.P. 2001, ApJ, 558, 276
- Vadawale et al (2001) Vadawale, S.V., Rao, A.R., & Chakrabarti, S.K. 2001, A&A, 372, 793
- Vadawale et al (2003) Vadawale, S.V., Rao, A.R., Naik, S., Yadav, J.S., Ishwara-Chandra, C.H., Pramesh Rao, A. & Pooley, G.G. 2003, ApJ, 597, 1023
- Vignarca et al. (2004) Vignarca, F., Migliari, S., Belloni, T., Psaltis, D. & an der Klis, M. 2003, A&A, 397, 729
- Zdziarski et al. (2002) Zdziarski, A.A., Poutanen, J., Paciesas, W.A., et al. 2002, ApJ, 578, 357