Near and Mid Infrared Observations of Ultracompact HII Regions
Abstract
This review discusses near- and mid- infrared observations of Ultracompact (UC) HII regions. The importance of ISO mid-IR fine-structure nebular lines is emphasised, since only a small fraction of UCHII regions are observed directly in the near-IR. The reliability of contemporary atmospheric models for such indirect diagnostics is discussed, whilst a revised spectral type-temperature calibration is presented for Galactic O3 to B3 dwarfs. In particular, fine-structure line derived properties of G29.96–0.02 differ from the direct near-IR spectroscopic result and represents a serious discrepancy which needs to be addressed. Mid-IR MSX and Spitzer imaging permits the identification of those UCHII regions for which far-IR IRAS fluxes are reliable, relevant to the single versus cluster nature of individual sources. High spatial resolution imaging with ground-based 8m telescopes allows more direct tests, as recently applied to G70.29+1.60. Finally, recent Spitzer mid-IR observations of Giant HII regions are briefly discussed.
keywords:
stars: formation, ISM: HII regions, infrared: stars1 Introduction
The formation and early evolution of massive stars remains one of the outstanding puzzles in astrophysics. Despite the ubiquitous presence of massive stars in galaxies, conventional theory fails to explain how these stars are born. Ultracompact HII (UCHII) regions represent the first evolutionary stage of massive stars in which their Lyman continuum radiation escapes in the form of free-free emission at cm wavelengths. Consequently, UCHII regions connect the early ‘hot core’ stage to later phases when the ionizing source reveals itself optically. UCHII regions possess high densities of typically 104 cm-3 and have yet to break out of their natal dust cocoons. Consequently, the ultraviolet radiation from their hot, massive stars is re-radiated in the thermal infrared. It is widely acknowledged that massive stars do not form in isolation. However, individual star forming regions may host a number of UCHII regions, which may be dominated by one massive star rather than a cluster. This review presents recent observations of UCHII regions at near- and mid- infrared wavelengths, which aim to address this question.
| Dwarf | M | log | log | |||||
|---|---|---|---|---|---|---|---|---|
| Sp Type | kK | cgs | mag | ph/s | ph/s | |||
| O3 | 45 | 4.0 | 13.8 | 5.85 | 69 | –5.8 | 49.7 | 49.1 |
| O4 | 43 | 12.3 | 5.67 | 57 | –5.5 | 49.4 | 48.8 | |
| O5 | 41 | 11.1 | 5.50 | 48 | –5.2 | 49.2 | 48.5 | |
| O6 | 39 | 4.05 | 10.0 | 5.32 | 41 | –4.9 | 49.0 | 48.3 |
| O7 | 37 | 9.4 | 5.17 | 37 | –4.7 | 48.8 | 47.9 | |
| O8 | 35 | 8.9 | 5.03 | 34 | –4.5 | 48.5 | 47.4 | |
| O9 | 33 | 8.4 | 4.88 | 32 | –4.3 | 48.1 | 46.3 | |
| O9.5 | 31.5 | 4.1 | 8.3 | 4.78 | 30 | –4.1 | 47.9 | 45.8 |
| B0 | 29.5 | 7.8 | 4.65 | 28 | –4.0 | 47.4 | 45.2 | |
| B0.5 | 28 | 7.4 | 4.48 | 26 | –3.7 | 46.8 | 44.3 | |
| B1 | 26 | 6.6 | 4.26 | 22 | –3.3 | 46.3 | 43.9 | |
| B1.5 | 24 | 4.15 | 5.7 | 3.98 | 17 | –2.8 | 46.0 | 43.6 |
| B2 | 21 | 5.3 | 3.69 | 15 | –2.4 | 45.3 | 42.5 | |
| B2.5 | 19 | 4.2 | 4.8 | 3.43 | 13 | –2.0 | 44.7 | 41.5 |
| B3 | 17.5 | 4.1 | 3.15 | 10 | –1.5 | 44.1 | 40.4 |
2 Near-IR observation of UCHII regions
Hanson et al. (2002) carried out a H-band imaging survey of 63 radio-selected UCHII regions, of which only a small fraction have near-IR counterparts, with typical extinctions of 30–50 mag. Of course, the youngest OB stars are deeply embedded, with perhaps 1000 mag, so near-IR or even mid-IR detection indicates a somewhat more mature ( yr) system. The well known UCHII region G5.89–0.39 represents an excellent case. The ionizing star is absent in H-band imaging by Hanson et al., whilst higher spatial resolution K′-band imaging by Alvarez et al. (2004) reveals a number of faint sources in the vicinity of the radio peak. It is only in the thermal L′-band where this source is clearly seen (Feldt et al. 2003), with L′=8.6 mag and Ks-L′=6.1 mag!
Amongst the small fraction of the ionizing stars that can be seen in the K-band, the dominant spectral signature is nebular emission in Br and in some cases He i, with H2 usually also seen (Hanson et al. 2002). In principal, nebular He i and Br emission lines can be used as indirect probes of the ionizing star (Lumsden et al. 2001), although mid-IR fine structure lines offer a more sensitive probe, and direct spectroscopic classification is, of course, preferable to both. Near-IR stellar spectroscopy is more straightforward for sources within the same star forming complexes as UCHII regions, albeit away from the strong nebulosity (Bik et al. 2005).

To date, the best known example of an UCHII region for which the principal ionizing star can be observed in the near-IR is G29.96–0.02, for which Watson & Hanson (1997) estimated O5–6V from low resolution K-band spectroscopy. Martin-Hernandez et al. (2003) present high spectral resolution VLT/ISAAC spectroscopy of G29.96–0.02, confirming a mid O spectral type. Indeed, Hanson et al. (these proc.) have presented yet higher quality H and K-band Subaru/IRCS spectroscopy of this source. Quantitative near-IR analysis of this dataset by Hanson et al. reveals 41kK. Notably, the wind properties of the ionizing star in G29.96–0.02 appear to be normal with regard to optically visible OB stars, in contrast with weak-lined, so-called, OVz stars.
The role of quantitative near-IR spectroscopy of OB stars has recently been investigated by Lenorzer et al. (2004) and by Repolust et al. (2005). The spectral type-temperature calibration of optically visible O stars has been significantly revised in recent years due to the inclusion of line blanketing and stellar winds in atmospheric models (e.g. Crowther et al. 2002; Massey et al. 2005). A revision to the recent Martins et al. (2005) compilation is indicated in Table 1 to incorporate early B dwarfs. Consequently, kK for G29.96–0.02 is representative of a Galactic O5V, in agreement with the original spectral type of Watson & Hanson (1997).
3 Mid-IR imaging of UCHII regions
The greatly reduced extinction at mid-IR wavelengths mean that most UCHII regions can be observed, albeit indirectly. For a typical visual extinction of 50 mag towards an UCHII region, only 5 mag are suffered in the K-band, or 0.25 mag at 25m.
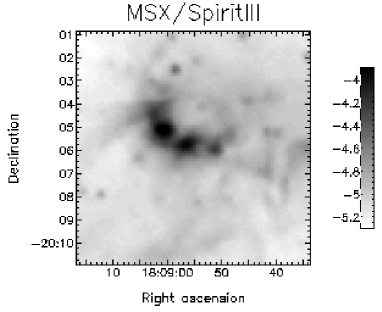
The energy emitted from the dust cocoons surrounding individual UCHII regions peaks in the far-IR, sampled by the IRAS 60 and 100m filters. However, the poor spatial resolution of IRAS has severely hindered the interpretation of far-IR fluxes until now. Prior to the Spitzer MIPS far-IR instrument, the Spirit III instrument aboard the Midcourse Space Experiment (MSX) satellite carried out a mid-IR (8-21m) imaging survey of the Galactic plane. IRAS has a 2 arcmin spatial resolution at 100m, but has nevertheless been used to obtain an integrated luminosity for individual UCHII regions. This has been combined with high spatial resolution (few arcsec) radio fluxes to investigate the single versus cluster nature of UCHII regions (e.g. Lumsden et al. 2003).
The large IRAS far-IR footprint led Crowther & Conti (2003) to obtain MSX imaging of UCHII regions from Wood & Churchwell (1989) and Kurtz et al. (1994) to investigate multiplicity. A mid-IR counterpart was identified for 50/51 sources111One source from the original compilations, G5.97-1.17, is now known as a proplyd (Stecklum et al. 1998), with the exception of G23.26-0.20. The majority of sources were detected with MSX Band C (12m), although some were very red (e.g. 21m/12m 30 for G45.47–0.05). Unsurprisingly, no correspondence was obtained between the moderate resolution (18 arcsec) mid-IR spatial morphologies and the 2–6cm VLA datasets at high resolution (few arcsec). Given et al. (2005) have recently provided a much more extensive radio compact HII region catalogue, the majority of which are also red in MSX colours.
Better morphological agreement is obtained with respect to lower spatial resolution radio observations that are sensitive to the extended emission, such as 21 cm data for G10.30–0.15 by Kim & Koo (2001). High spatial resolution mid-IR datasets closely resemble the radio morphology in some cases (e.g. G29.96–0.02, Ball et al. 1996), although this is not universally true, according to recent ground-based mid-IR imaging (De Buizer, priv. comm.) for which arcsec resolution is achievable.
Approximately 35% of the UCHII regions were either double or multiple in the MSX images, indicating that the IRAS fluxes are significantly contaminated by near neighbours in those cases. Although the peak dust emission falls longward of the 8–21m region, the superior spatial resolution of MSX relative to IRAS does allow the identification of those UCHII regions for which far-IR fluxes are reliable. In Fig. 1 we compare radio derived Lyman continuum fluxes of isolated UCHII regions with bolometric luminosities, together with predictions from Lumsden et al. (2003) for a single star versus a cluster with a Salpeter Initial Mass Function (IMF). These predictions used Co-Star non-LTE models (Schaerer & de Koter 1997). Similar predictions are presented by Sternberg et al. (2003) using WM-basic non-LTE models.
As anticipated, UCHII regions scatter around the cluster case in Fig. 1, although the quoted radio fluxes exclude the extended (15-60 arcsec) emission. Observations which also include this typically lead to a factor of 3 increase (Kurtz et al. 1999; Kim & Koo 2001), although recent observations by Ellingsen et al. (2005) find more modest increases in their sample of UCHII regions. Nevertheless, in all cases allowance for extended emission shifts individual points to towards the single star dominated models. In addition, dust may absorb the ionizing photons or photons may leak from the region without ionizing the surrounding material (density rather than ionization bounded case). Consequently, one has to take care when interpreting these observations.
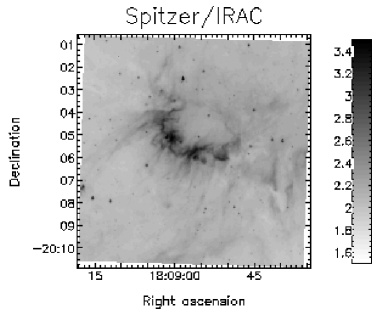
Of course, Spitzer now routinely provides a high spatial resolution view at mid- to far-IR wavelengths with IRAC (4-8m) and MIPS (24, 70m). With regard to UCHII regions, the GLIMPSE survey (Benjamin et al. 2003) has provided IRAC imaging (e.g. G10.30-0.15 in Fig. 2), although 24–70m MIPS images await a Cycle 2 Guest Observer program (P.I. Sean Carey).

4 Mid-IR spectroscopy
The Infrared Space Observatory (ISO) has made a significant contribution to the study of UCHII regions spectroscopically in the mid-IR, since important fine-structure lines (e.g. [NeIII] 15.5m, [SIII] 18.7m) are unavailable from the ground. The ISO SWS and LWR instruments were well suited to large aperture (1420 to 2033 arcsec) observations of bright sources. Due to spatial crowding, care has to be taken regarding contamination of ISO datasets by near neighbours. Peeters et al. (2002) present ISO spectroscopy of UCHII regions, revealing nebular (hydrogen recombination and metallic fine-structure) emission lines superimposed upon a hot dust continuum, together with dust bands (6–13m PAH, 9.7m silicate) and molecular ices (CO2, H2O). A representative spectrum of G29.96–0.02 is presented in Fig. 3. Radiative transfer modelling of dust has been discussed by Faison et al. (1998) and Arthur et al. (2004), whilst 3D modelling is presented by Whitney (these proc.).
Fine-structure lines originate either from (i) the photo-dissociation region (PDR), diagnosing the warm gas outside the HII region (e.g. [CII], [OI]), or (ii) the ionized nebula, providing an indirect tracer of the extreme ultraviolet (EUV) energy distribution of the OB stars within the UCHII region (e.g. [ArII-III], [NeII-III], [SIII-IV]). This is an extremely useful means of studying the stellar content of the UCHII region, although different atmospheric models differ in the EUV flux distributions. In recent years, significant progress has been made in the development of atmospheric models for OB stars.
Fully-line blanketed LTE and non-LTE model atmospheres have been developed by Kurucz (1992) and Lanz & Hubeny (2003), respectively. The latter, TLUSTY, models are appropriate for stars without stellar winds. Since OB stars do possess strong stellar winds, either an approximate treatment of metal line blanketing is necessary, e.g. CoStar (Schaerer & de Koter 1997), WM-basic (Pauldrach et al. 2001), FASTWIND (Puls et al. 2005), or the metals considered are incomplete e.g. CMFGEN (Hillier & Miller 1998). FASTWIND and CMFGEN currently represent the leading atmospheric models capable of reproducing the observed UV wind and optical photospheric features simultaneously (e.g. Crowther et al. 2002).
Unfortunately, these non-LTE models disagree with each other at energies significantly above the Lyman edge (13.6eV), which are sampled by the mid-IR fine-structure lines (e.g. Ar+ 28eV, S2+ 35eV, Ne+ 41eV). Nevertheless, attempts have been made to derive stellar temperatures from combining selected non-LTE models with photoionization codes (e.g. Giveon et al. 2002; Mokiem et al. 2003). In particular, from comparison between ratios of fine-structure lines observed in ISO spectroscopy of HII regions with atmospheric model predictions, Morisset et al. (2004) concluded that CoStar models are too hard at high energies due to the approximate treatment of blanketing, TLUSTY and Kurucz models are too soft at high energies due to the neglect of stellar winds, and CMFGEN and WM-basic models are in reasonable agreement with observations222FASTWIND models are not widely available, although Puls et al. (2005) conclude their EUV energy distributions are similar to WM-basic., though fare no better than blackbody distributions across selected energy intervals! This is of course, far from satisfactory such that further improvements in model atmospheres are necessary.
One may attempt to estimate the stellar temperature of the most massive star in UCHII regions from photoionization modelling of mid-IR fine structure lines. Amongst the most detailed studies carried out to date was that of Morisset et al. (2002) who derived T3kK for G29.96–0.02 based on CMFGEN and WM-basic models, together with a two component density distribution – a small, high density region (0.1pc, 104.75 cm-3) surrounded by an extended halo (1pc, 102.8 cm-3).
The nebular derived stellar temperature corresponds to an O81.5 dwarf (Table 1). However, the ionizing star of G29.96–0.02 has been observed in the K-band revealing an O5V star with 41kK (Hanson et al, these proc.). This represents a serious discrepancy, and needs to be resolved in order to progress our understanding of UCHII regions from mid-IR spectroscopy. Ideally, the EUV energy distribution derived for the ionizing star should be combined with a photoionization model to reproduce the near and mid-IR nebular emission. Clumping in HII regions doubtless also plays a role (Ignace & Churchwell 2004). Whatever the cause, we cannot hope to understand more complex cases, such as the integrated mid-IR spectra from starburst galaxies (Verma et al. 2003; Schaerer et al., these proc.), until we have resolved with such apparently simple cases as G29.96–0.02.
Recently, Okamoto et al. (2003) have presented high resolution Subaru observations of G70.29+1.60 (K3-50A), revealing the first direct evidence for a cluster, since fine-structure maps of [ArIII], [SIV] and [NeII] indicates multiple sources, one mid- and two late- type O stars. The presence of multiple sources in G70.29+1.60 was supported by K′-band speckle imaging by Hofmann et al. (2004). Clearly, this technique has great promise for the near future.
5 Mid-IR observations of Giant HII (GHII) regions
For OB stars formed in a cluster, their combined Lyman continuum luminosity can ionize a substantial volume, resulting in a GHII region ( Lyman photons/s). Near-IR imaging and spectroscopy of GHII regions has been discussed by Damineli et al. (these proc.), and individual Spitzer IRAC images have been presented by Churchwell et al. (2004) for RCW49, Chini (these proc.) for M17 and Brandl (these proc.) for NGC3603 and W49. Conti & Crowther (2004) have obtained a revised catalogue of 50 Galactic GHII regions, and compared their MSX derived mid-IR properties with those of UCHII regions. In contrast with UCHII regions, where dust intercepts most stellar radiation, GHII regions are no longer optically thick so some radiation escapes.
Spitzer spectroscopy and imaging of one GHII region, G10.2–0.3 within the W31 complex, has recently been obtained in a Cycle 1 Guest Observer program (P.I. Crowther). Amongst GHII regions, W31 is notable since it contains (i) massive young stellar objects without radio emission, (ii) UCHII regions and (iii) ’naked’ O stars (Blum et al. 2001). Spitzer IRS spectroscopy reveals the characteristic mid-IR fine structure lines in individual sources. By way of example, [NeIII] 15.5m/[NeII] 12.8m = 0.3 for one of the naked O stars, W31-3, suggesting a mid-O spectral type. Qualitatively, this agrees with that obtained directly from near-IR spectroscopy of W31-3 by Blum et al. (2001). Although a detailed study remains to be carried out, W31-3 indicates a consistent K-band stellar versus mid-IR nebular result, in contrast with G29.96–0.02, so it is unclear at present which is the more typical.
Finally, whilst UCHII regions represent the nearby Galactic counterparts of so-called extragalactic ultra-dense HII (UDHII) regions (Johnson, these proc.), Westerlund 1 (Clark et al. 2005) is currently the best candidate for a Galactic counterpart to extragalactic Super Star Clusters (SSCs). These are much more massive and denser than normal Galactic GHII regions and are common in the starburst galaxies M82 and the Antennae, but were hitherto unknown in the Milky Way. In contrast with UCHII and GHII regions, Westerlund 1 is sufficiently mature to have already shed its natal dust cocoon and ionized gas, such that it is faint at radio wavelengths, and is only bright in the near and mid-IR due to its stellar content which includes red supergiants and yellow hypergiants. Other examples undoubtedly await detection in the Milky Way.
Acknowledgements.
Thanks to Peter Conti for introducing the author to the wonderful world of massive star formation in Boulder, Martin Cohen for bringing MSX to my attention, and the Royal Society for continuing financial support.References
- [] Alvarez C., Feldt M., Henning T., Puga E., Brandner W., 2004, ApJS 155, 123
- [] Arthur S.J., Kurtz S.E., Franco J., Albarran M.Y., 2004, ApJ 608, 282
- [] Ball R., Meixner M.M., Keto E., Arens J.F., Jernigan J.G., 1996, AJ 112, 1645
- [] Benjamin R.A., Churchwell E., Babler B.L. et al. 2003, PASP 115, 943
- [] Bik A., Kaper L., Hanson M.M., Smits, M., 2005, A&A in press (astro-ph/0505293)
- [] Blum R.D., Damineli A., Conti P.S., 2001, AJ 121, 3149
- [] Churchwell E., Whitney B.A., Babler B.L. et al. 2004, ApJS 154, 322
- [] Clark J.S., Negueruela I., Crowther P.A., Goodwin S.P., 2005, A&A 434, 949
- [] Conti P.S, Crowther P.A., 2004, MNRAS 355, 899
- [] Crowther P.A., Conti P.S., 2003, MNRAS 343, 143
- [] Crowther P.A., Hillier D.J., Evans C.J. et al. 2002, ApJ 579, 774
- [] Ellingsen S.P., Shabala S.S., Kurtz S.E., 2005, MNRAS 357, 1003
- [] Faison M., Churchwell E., Hofner P., Hackwell J., Lynch D.K., Russell R.W., 1998, ApJ 500, 280
- [] Feldt M., Puga E.,, Lenzen R. et al. 2003, ApJ 599, L91
- [] Giveon U., Sternberg A., Lutz D., Feuchtgruber H., Pauldrach A.W.A., 2002, ApJ 566, 880
- [] Giveon U., Becker R.H., Helfand D.J., White R.L., 2005, AJ 129, 348
- [] Grigsby J.A., Morrison N.D., Anderson L.S., 1992, ApJS 78, 205
- [] Hanson M.M., Luhman K.L., Rieke G.H., 2002, ApJS 138, 35
- [] Heap S.R., Lanz T., Hubeny I., 2005, ApJ in press (astro-ph/0412345)
- [] Hillier D.J., Miller D.L., 1998 ApJ 496, 407
- [] Hofmann K.-H., Balega Y.Y., Preibisch T., Weigelt G., 2004, A&A 417, 981
- [] Ignace R., Churchwell E., 2004, ApJ 610, 351
- [] Kilian J., Montenbruck O., Nissen P.E., 1994, A&A 284, 437
- [] Kim K.-T., Koo B.-C., 2001, ApJ 549, 979
- [] Kurucz R., 1991, in Precision Photometry: Astrophysics of the Galaxy, Philip A.G.D., Upgren A.R., Janes K.A. (eds), L. Davis Press
- [] Kurtz S.E., Churchwell E., Wood D.O.S., 1994, ApJS 91, 659
- [] Kurtz S.E., Watson A.M., Hofner P., Otte B., 1999, ApJ 514, 232
- [] Lanz T., Hubeny I., 2003, ApJS 146, 417
- [] Lenorzer A., Mokiem M.R., de Koter A., Puls J., 2004, A&A 422, 275
- [] Lumsden S.L., Puxley P.J., Hoare M.G., 2001, MNRAS 320, 83
- [] Lumsden S.L., Puxley P.J., Hoare M.G., Moore T.J.T., Ridge N.A., 2003, MNRAS 340, 799
- [] Martin-Hernandez M.L., Bik A., Kaper L., Tielens A.G.G.M., Hanson M.M., 2003, A&A 405, 175
- [] Martins F., Schaerer D., Hillier D.J., 2005, A&A 436, 1049
- [] Massey P., Puls J., Pauldrach A.W.A., Bresolin F., Kudritzki R.P., Simon T. 2005, ApJ in press (astro-ph/0503464)
- [] Mokiem M.R., Martin-Hernandez M.L., Lenorzer A., de Koter A., Tielens A.G.G.M., 2004, A&A 419, 319
- [] Morossi C., Malagnini M.L., 1985, A&AS 60, 365
- [] Morisset C., Schaerer D., Martin-Hernandez M.L. et al. 2002, A&A 386, 558
- [] Morisset C., Schaerer D., Bouret J.-C., Martins F., 2004, A&A 415, 577
- [] Okamoto Y.K., Kataza H., Yamashita T. et al. 2003, ApJ 584, 368
- [] Pauldrach A.W.A., Hofmann T.L., Lennon M., 2001, A&A 375, 161
- [] Peeters E., Martin-Hernandez M.L., Damour F, et al. 2002, A&A 381, 571
- [] Puls J., Urbaneja M.A., Venero R. et al. 2005, A&A 435, 669
- [] Repolust T., Puls J., Hanson M.M., Kudritzki R.-P., Mokiem M.R., 2005 A&A in press (astro-ph/0501606)
- [] Schaerer D., de Koter A., 1997, A&A 322, 598
- [] Smith L.J., Noris R.P.F., Crowther P.A., 2002, MNRAS 337, 1309
- [] Stecklum B., Henning T., Feldt M. et al. 1998, AJ 115, 767
- [] Sternberg A., Hoffmann T.L., Pauldrach A.W.A., 2003, ApJ 599, 1333
- [] Vacca W.D., Garmany C.D., Shull J.M., 1996, ApJ 460, 914
- [] Verma A., Lutz D., Sturm E. et al. 2003, A&A 403, 829
- [] Watson A.M., Hanson M.M., 1997, ApJ 490, L165
- [] Wood D.O.S., Churchwell E.D., 1989, ApJS 69, 831