22email: matilde@mpia-hd.mpg.de 33institutetext: European Southern Observatory, Karl-Schwarzschild-Strasse 2, D-85748 Garching, Germany
33email: fcomeron@eso.org
Mass loss at the lowest stellar masses††thanks: Based on observations obtained at the European Southern Observatory using the Very Large Telescope in Cerro Paranal, Chile (observing runs 67.C-0549(B), 69.B-0126(A), 71.C-0429(C) and 71.C-0429(D)).
We report the discovery of a jet in a [SII] image of Par-Lup3-4, a remarkable M5-type pre-main sequence object in the Lupus 3 star-forming cloud. The spectrum of this star is dominated by the emission lines commonly interpreted as tracers of accretion and outflows. Par-Lup3-4 is therefore at the very low-mass end of the exciting sources of jets. High resolution spectroscopy shows that the [SII] line profile is double-peaked, implying that the low excitation jet is seen at a small angle (probably 8∘) with respect to the plane of the sky. The width of the Hα line suggests a dominating contribution from the accretion columns and from the shocks on the stellar surface. Unresolved Hα emission coming from an object located at 42 from Par-Lup3-4 is detected at a position angle 30∘ or 210∘, with no counterpart seen either in visible or infrared images.
We also confirm previous evidence of strong mass loss from the very low mass star LS-RCrA 1, with spectral type M6.5 or later. All its forbidden lines are blueshifted with respect to the local standard of rest (LSR) of the molecular cloud at a position very close to the object and the line profile of the [OI] lines is clearly asymmetric. Thus, the receding jet could be hidden by a disk which is not seen edge-on.
If an edge-on disk does not surround Par-Lup3-4 or LS-RCrA 1, an alternative explanation, possibly based on the effects of mass accretion, is required to account for their unusually low luminosities.
Key Words.:
Stars: individual: Par-Lup3-4; Stars: individual: LS RCrA-1; Stars: low-mass, brown dwarfs; Stars: pre-main sequence; ISM: jets and outflows1 Introduction
In the last decade evidence has been found that the mass accretion model that simultaneously explains the mass accretion and mass loss features observed in a great variety of sources, from active galaxies to low-mass pre-main sequence stars (classical T Tauri stars), can be also applied at very low stellar masses and, possibly, below the substellar limit (e.g., Fernández & Comerón Fernandez01.1 (2001), Muzerolle et al. Muzerolle03.1 (2003), Comerón et al. Comeron03.1 (2003), Natta et al. Natta04.1 (2004), Barrado y Navascués & Jayawardhana Barrado04.2 (2004)). In fact, in the framework of low mass star formation, the mass accretion - mass loss proportionality proposed by Cabrit et al. (Cabrit90.1 (1990)) seems to hold below the substellar limit. Natta et al. (Natta04.1 (2004)) have studied the accretion properties of very low mass objects, more than doubling the number of substellar objects for which the mass accretion rate, Ṁacc, is known. They confirm the trend of lower Ṁacc for lower M∗, although with a large spread, possibly due to an age effect. This trend has been recently confirmed for the entire substellar domain, down to nearly the deuterium-burning limit (Mohanty et al. Mohanty05.1 (2005)). Little information can be found for mass loss rates, but the estimation made by Comerón et al. (Comeron03.1 (2003)) for the very low mass star LS-RCrA 1 falls in the expected range of values, according to the mentioned proportionality.
In order to confirm that the classical T Tauri star paradigm also applies at the very low mass regime, it is necessary to find out whether these objects can be the exciting sources of jets or outflows. Here we report the discovery of a jet emanating from a M5 star (Par-Lup3-4) and we confirm previous evidence (Fernández & Comerón Fernandez01.1 (2001), Barrado y Navascués et al. Barrado04.1 (2004)) that the M6.5, or later, star LS RCrA-1 is the exciting source of an outflow. Both stars were discovered in the course of Hα surveys carried out in the Lupus 3 and R CrA regions, respectively (Comerón et al. Comeron03.1 (2003); Fernández & Comerón Fernandez01.1 (2001)). Their strong emission at permitted lines indicates a strong mass accretion process, while the forbidden emissions make them very good candidates in the search for jets or outflows. These two stars also share an unexpected property: they are quite underluminous (Fernández & Comerón Fernandez01.1 (2001); Comerón et al. Comeron03.1 (2003)). When compared to other young objects of similar spectral types, Par-Lup3-4 and LS-RCrA 1 happen to be fainter by almost 4 mag and 1.8 mag, respectively. These low luminosities put both stars on the 50 Myr isochrone on the HR diagram. This age is much older than those estimated for the other members of their young associations, which are well below 10 Myr. The results reported here suggest that neither of these objects is obscured by an edge-on disk, thus constraining possible explanations of the underluminosity.
2 Observations
All the observations reported in this paper were carried out with the VLT (Cerro Paranal, Chile) in service mode. The narrow-band [SII] and Hα imaging observations of Par-Lup3-4 took place on the night of May 2, 2003. They are integrations of 950 s each using the visible imaging and low-resolution spectrograph FORS1. We have measured a seeing of 06 for the [SII] image and of 07 for the Hα one.
High resolution ( = 57,000) spectroscopy of Par-Lup3-4 was carried out over 5 nights in 2003, from July 4 to 30, using UVES, the Ultraviolet and Visual Echelle Spectrograph (Kaufer et al. Kaufer03.1 (2003)). Each observation consisted of two consecutive spectra covering the range 3300 to 6800 Å with exposure times of 1512 s. The slit width was always 12. Since imaging and spectroscopy were scheduled in the same period, recognition of the Par-Lup3-4 jet in the FORS1 images was possible only after the UVES observations had been obtained, thus preventing the selection of a position angle (PA) of the UVES slit matching the direction of the jet. Instead, the parallactic angle was set so as to minimize losses due to atmospheric differential refraction, thus resulting in our observations probing a range of PAs. The log of spectroscopic observations is presented in Table 1. The third column contains the seeing values measured with the DIMM (Differential Image Motion Monitor) during the time of the exposures; such values are stored in the ESO Observatories Ambient Conditions Database111http://archive.eso.org/asm/ambient-server. The range of parallactic angles covered, as well as the average one for each pair of exposures, are also listed.
Narrow-band imaging observations of LS-RCrA 1 using the same setup as for Par-Lup3-4 were carried out on June 2, 2003. High resolution spectroscopic observations of LS-RCrA 1 were carried out from June 3 to July 4, 2003. The instrumental setup was the same as for Par-Lup3-4.
The spectra were reduced and analyzed using IRAF222IRAF is distributed by the National Optical Astronomy Observatories, which are operated by the Association of Universities for Research in Astronomy, Inc. (AURA), under cooperative agreement with the National Science Foundation, USA., paying special attention to the small spatially extended structure present in some of the spectra. All velocities are referred to the local standard of rest (LRS).
| Date | Time | Seeing | Parallactic angle | ||
| Start (UT) | Range | Average | |||
| Par-Lup3-4 | h m s | ||||
| -54° | |||||
| -22° | |||||
| 33° | |||||
| 84° | |||||
| 71° | |||||
| LS-RCrA 1 | |||||
| 63° | |||||
| 74° | |||||
| 82° | |||||
| 45° | |||||
| -73° | |||||
3 Results
3.1 Par-Lup3-4
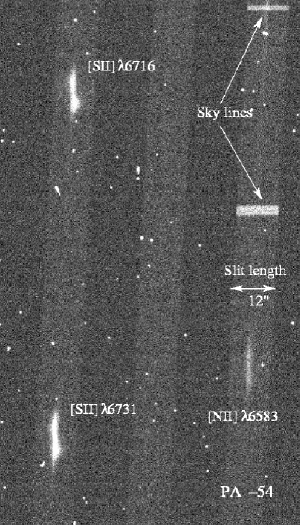
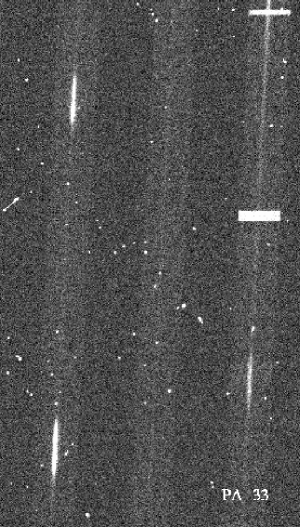
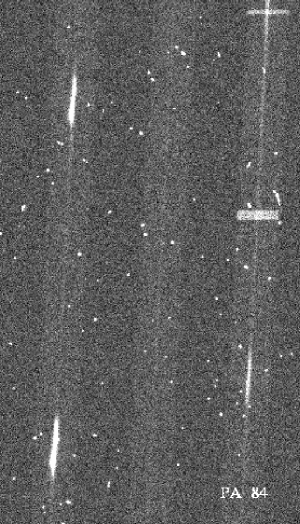
Figure 1 shows three of the echellograms obtained for Par-Lup3-4. Each of them is the average of two consecutive exposures. The echellogram taken on July 27 (central panel) shows spatially unresolved [SII] emission lines, as expected from a point source. The data from the other two nights show emission from the surroundings of the star. The fact that on each of these two nights the redshifted emission (bottom of the lines) originates at opposite sides of the star is due to the different parallactic angles; all the emission comes, spatially, from the same side of the star. The observed emission can be traced up to 36 from the star. Hints of very faint blueshifted emission coming from the other side of the star can be seen on the echellogram from July 4.
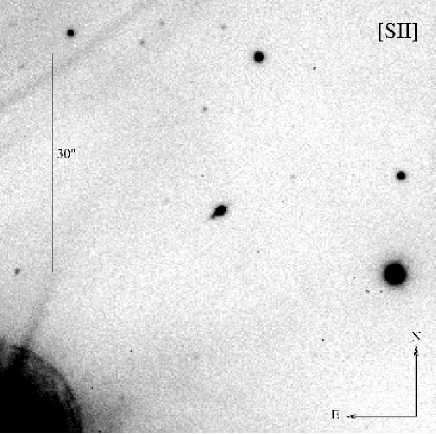
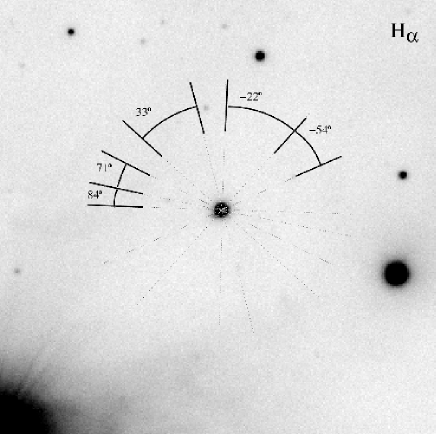
The extended emission is clearly detected on the [SII] narrow band image of Par-Lup3-4 (see Fig. 2), where a distinct knot is seen at a PA = 1297 and at a distance of 13 from the star, corresponding to a 260 AU projected distance from the star assuming a distance of 200 pc for the Lupus region; see discussion in Comerón et al. (Comeron03.1 (2003)). Fainter jet-like emission can be traced further away up to 42 from the star (840 AU), as well as in the opposite direction reaching up to 20 (400 AU). The orientation of these features implies that the slit was oriented along the jet in our spectra of July 4, as seen on the right panel of Fig. 2, where the range of slit PAs covered by the echelle observations are plotted, giving the average PAs as a reference. The extended emission is, nevertheless, difficult to see on the narrow band Hα image, most probably due to the dominance of the Hα emission from the star. This extended emission is not detected on the Hα echellogram taken along the orientation of the jet.
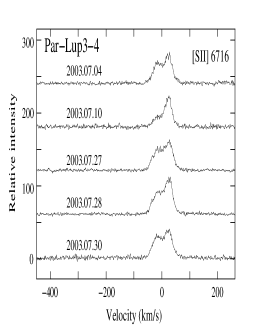
The [SII] lines, presented in Fig. 3, show a double-peaked profile, in which the relative intensities of both peaks change. Since variability with time scales of weeks is not expected at such a distance from the exciting source, changes are likely to be due to the different PA of the slit probing different parts of the extended emission. The brighter and redshifted component is associated with the emission knot seen in the [SII] images to the south-east of Par-Lup3-4.
| Target | [OI] 6300 | [OI] 6363 | [NII] 6548 | [NII] 6583 | [SII] 6716 | [SII] 6731 |
|---|---|---|---|---|---|---|
| Par-Lup3-4 | 0.761.36 | 2.501.41 | 6.414.5 | 1.375.0 | -15.61.9, 25.01.5 | -18.31.6, 23.61.4 |
| LS-RCrA 1 | -4.90.8 | -5.51.0 | -18.34.37 | -22.31.46 | -11.6 1.7 | -13.4 1.1 |
The [NII] lines are in emission in some of the spectra, but they are absent in others. We have found no correlation between the intensity of these lines and the slit PA, but the intensity seems to correlate with the seeing at the time of the observations: the better the seeing, the more intense the lines are. The spectra with better signal to noise show a double-peaked profile. This is a clear signature of a bipolar jet, since [NII] emission only originates in the high-velocity component of the bipolar outflows (Hirth et al. Hirth97.1 (1997)). The [OI] 6300 and the [OI] 6363 emission lines, on the contrary, present single peak profiles.
The LSR velocities measured for the [OI], [NII], and [SII] lines are listed in Table 2. These velocities correspond to the central position of each line or line component, in the case of double-peaked profiles.
We have also detected emission from the HeI 5876 permitted line. Since this line is too noisy in the individual spectra, we have added up all of them and we have measured an equivalent width of 3.7 Å. An equivalent width of 1.6 Å was already reported for the HeI 6678 emission of this star by Comerón et al. (Comeron03.1 (2003)).
Hα emission, coming from an object located at 42 from Par-Lup3-4, has been detected in the two spectra taken at PA 24∘ and 42∘ (average PA of 33∘). Several reasons let us discard the possibility that it is an artifact, i.e. light reflection: the little resemblance to the Hα profile of Par-Lup3-4; the lack of any bright feature on the spectrum (the brightest one amounts to less than 1000 counts); the fact that its position does not change from one spectrum to the next one, but it gets fainter, as if the object slowly moves out of the slit; and the fact that the Hα profile of the closest bright star (RX J1608.9 3905, located at 1’) is not in emission, but filled. From the position of this spectrum on the echellogram we estimate a PA of 30∘ or 210∘ for the unknown object333The uncertainty in the PA is due to the fact that the spectrograph is allowed to turn 360∘.. The line that connects Par-Lup3-4 and this object subtends, thus, an angle of 80∘ with the jet. An outflow direction perpendicular to a binary axis has been reported for V536 Aql (Mundt & Eislöffel, Mundt98.1 (1998)); the distance between both components being 052 ( 120 AU). The Hα emission of the new object, presented in Fig. 4, shows a wide, double-peaked profile with extended wings covering more than 300 kms-1. The two peaks are centered at -10 kms-1 and 90 kms-1, the red peak being the faintest one. No visible counterpart has been found on R, I, and z band images up to limiting magnitudes of R=24 mag, I=22 mag, and z=21 mag (Comerón et al. in preparation). No infrared counterpart has been found brighter than J=20.8 mag, H=17.5 mag and K20.8 mag in images obtained at the New Technology Telescope (NTT), at La Silla, with SOFI in June 2001 (J band) and July 2002 (H band), and with ISAAC at the VLT (H2 filter) in August 2003. The line profile, as well as the velocities of the two intensity peaks, resembles the Hα emission of pre-main sequence objects (Fernández et al. Fernandez95.1 (1995); Reipurth et al. Reipurth96.1 (1996)). If this is the case, and taking into account the fact that the object is more than 8 mag fainter than the young M5 stars of this star forming region, its position on the luminosity vs. age diagram of Burrows et al. (Burrows97.1 (1997), see their Fig.7) would fall on the regime of the young, very low mass brown dwarfs and planetary mass objects. Its Hα emission could be due to mass accretion or to a flare, like the one that has been recently observed with UVES on the old M9 dwarf DENIS 104814.7-395606.1 (Fuhrmeister & Schmitt Fuhrmeister04.1 (2004)). The flare option is, nevertheless, less plausible, because the Hα intensity does not change much from the first spectrum to the second and both were taken over a time interval of 50 minutes. Mass accretion, on the other hand, is known to play a very important role in the formation of brown dwarfs and, possibly, of Jovian planets (Quillen & Trilling Quillen98.1 (1998)). A conservative value of the full width at 10% of the Hα peak profile is in the range of 250300 kms-1, which supports the hypothesis of mass accretion (see Sec. 4.1).
Deep H2 (2.12 m) images of Par-Lup3-4 taken with ISAAC in August 2003 show a point source located at 12 from it, at a PA63°. If it has no emission lines in this band, the source is about 6 mag fainter than Par-Lup3-4 in KS, reaching K19.6 mag. If physically related to Par-Lup3-4 the object could be in the planetary mass regime (Burrows et al. Burrows97.1 (1997)). On the echellograms obtained on July 4, 2003, we are not able to detect Hα emission at this position, perhaps because it is dominated by the emission from Par-Lup3-4, due to a seeing 1″.


3.2 LS-RCrA 1
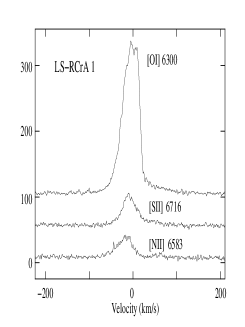
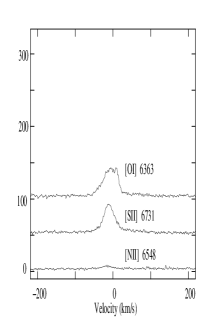
The echellograms show no hint of extended emission close to the star and therefore there is no dependence on the PA of the slit. Fig. 5 shows, for this reason, the average forbidden lines obtained for LS-RCrA 1.
Unlike in the case of Par-Lup3-4, no double-peaked profile is identified in any of the forbidden lines. However, asymmetric profiles are clearly seen. We like to note that such types of profiles are more common among classical T Tauri stars than the double-peaked profiles seen in Par-Lup3-4 (see Hirth et al. Hirth97.1 (1997)). The asymmetry of the [OI] lines seems to be due to the absorption of the redshifted emission; while the [SII] lines show a bump on the red wing, centered at 50 km s-1. The [NII] lines present quite symmetric profiles, but both of them show faint emission at 50 km s-1. All the forbidden lines have a FWHM of about 40 kms-1.
We detect emission from both [NII] 6583 and [NII] 6548, two lines that have been reported to form only a high velocity component (HVC) and not a low velocity component (LVC) in classical T Tauri stars (Hirth et al. Hirth97.1 (1997)).
4 Discussion
4.1 Par-Lup3-4
As expected from its low resolution spectrum (Comerón et al. Comeron03.1 (2003)), the observed forbidden lines of Par-Lup3-4 are characteristic of the shocked gas usually observed in jets from pre-main sequence stars. The precise physical characteristics of Par-Lup3-4 are difficult to determine due to its anomalously low luminosity, which prevents its comparison with theoretical evolutionary tracks in the temperature-luminosity diagram. Nevertheless, the late-type spectrum of the central object places Par-Lup3-4 among the least massive objects known to excite a jet. Other very low mass objects have been also reported to power outflows. Froebrich et al. (Froebrich03.1 (2003)) found VLA 1623 to be the lowest mass star among a sample of Class 0 sources powering outflows; they estimate that it will reach a mass of 0.07 M⊙. Very low masses are also expected for BKLT J162658-241836 and WLY 2-36, the likely exciting sources of Herbig-Haro objects in the Ophiuchi embedded cluster (Gómez et al. Gomez03.1 (2003)).
The fact that only one side of the jet is clearly detected on the visible images is not strange among young stars. One-sided jets, with a very faint counterjet, have been reported for several of them (e.g., DG Tau, Solf & Böhm Solf93.1 (1993)). Hirth et al. (Hirth94.1 (1994)) discuss asymmetries in bipolar jets from young stars, which can be related to the source itself or to its immediate environment.
The lack of photospheric features on the weak continuum of the high resolution spectra prevents us from computing the LSR velocity of the star. Nevertheless, an estimation of this velocity can be obtained from the CO observations carried out by Gahm et al. (Gahm93.1 (1993)) towards the Lupus 3 cloud, which gave an average value between 5 and 6 kms-1. More recently, Hara et al. (Hara99.1 (1999)) measured the LSR velocities of a C18O core located at less than 1’ from the position of Par-Lup3-4; the beam size of the telescope was 26. They measured a velocity of 4.13 1.2 kms-1. Since C18O traces only the dense parts of the clouds, unlike 12CO, the C18O velocity relates more to young stars formed very recently. The average LSR velocities that we measure for the jet of Par-Lup3-4, 4.71.7 kms-1 for [SII] 6716 and 2.71.5 kms-1 for [SII] 6731, match the values obtained from radio observations, thus confirming that the red- and blue-shifted peaks come from the jet and the counterjet, respectively.
Gaussian fits to the double-peaked [SII] lines show an average difference between peaks of kms-1. If we assume a jet velocity of 150 kms-1 perpendicular to the plane of the disk, we get a disk tilt of 8° with respect to the plane of the sky, if there is a symmetric distribution of velocities in the jet. For a velocity of about 100 kms-1 (the measured velocity width at the base of the individual line components of the [SII] emissions) the corresponding inclination is 12°. Flared disks, for which the ratio of the disk scale height H to the radial distance R increases with R (see Hartmann Hartmann98.1 (1998)), can hide the star more easily than flat disks. To date only small samples are available for the study of the frequency of flared disks among brown dwarfs; nevertheless, this frequency does not seem to be high. From the study of the disks around 12 brown dwarfs, Natta et al. (Natta02.1 (2002)) concluded that nine of them might have flat disks, in spite of the strong bias of their sample against objects with flat disks. Mohanty et al. (Mohanty04.1 (2004)), on the other side, found strong evidence of flared disks for two brown dwarfs out of a sample of three and Sterzik et al. (Sterzik04.1 (2004)) reported a flare disk geometry for ChaHα1.
The Hα emission of three T Tauri stars with edge-on disks, where the contributions arising from the surface and its closest vicinity are blocked from direct view, has been recently studied by Appenzeller et al. (Appenzeller05.1 (2005)). In all cases the line has a narrow profile, with a full width half maximum (FWHM) below 100 kms-1. Appenzeller et al. interpret it as the Hα contribution to the outflows. This result strongly supports the conclusion of White & Basri (White03.1 (2003)), confirmed by Natta et al. (Natta04.1 (2004)), that Hα emission can only be undoubtedly attributed to the mass accretion process, if the full width of the emission profile at 10% of the maximum intensity (hereafter 10% width) is above444For a Gaussian function the 10% width is 1.8226 times the FWHM. Note, however, that stellar line profiles are not always Gaussian. 270 kms-1. Jayawardhana et al. (Jayawardhana03.1 (2003)) suggest, nevertheless, that for some accreting objects the 10% width could be as low as 200 kms-1. The wide and complex Hα profile that we have observed for Par-Lup3-4, with a 10% width in the range from 340 to 400 kms-1, should come, then, from the accretion related regions, which lie very close to or on the stellar surface, strongly supporting the non-edge disk hypothesis. We also detect in our spectra HeI 5876 emission, which is usually interpreted as being formed very close to the stellar surface. However, Appenzeller et al. (Appenzeller05.1 (2005)) have detected it also in the spectrum of their sample of stars with edge-on disks, thus suggesting that HeI emission can also be produced far from the surface.
The flux ratios of the observed forbidden lines inform about the physical characteristics of the jet. Bacciotti & Eislöffel (Bacciotti99.1 (1999)) have developed a technique which allows one to determine the local ionization fraction, the electron density and electron temperature using these ratios. The low signal to noise along the jet prevents us from carrying a detailed spatial study of these line ratios, but we can get average values for the whole jet. The observed line ratios are
From comparison to other jets for which these lines have been measured (Bacciotti & Eislöffel 1999), we can conclude that we deal with a low excitation jet.
The widths of the [OI] lines are very similar to those of the [SII] lines, in contrast to what has been observed for some classical T Tauri stars (Hirth et al. Hirth94.1 (1994)). Hirth et al. showed that the [OI] lines form at smaller distances from the star than the [SII] lines. The fact that the velocities involved in the formation of both sets of lines seem to be similar could suggest that the collimation mechanism is already working very close to the star.
4.2 LS-RCrA 1
Like for Par-Lup3-4, the non-detection of the photospheric continuum in the high resolution spectra of LS-RCrA 1 prevents us from computing the LSR velocity of the star. Barrado y Navascués et al. (Barrado04.1 (2004)) have measured a radial velocity of 2 kms-1. This velocity falls slightly outside of the range of velocities that Neuhäuser et al. (Neuhaeuser00.1 (2000)) have measured for 12 earlier type T Tauri stars in the CrA complex (0 to -5 kms-1), but it contains within its error bars the LSR H2CO velocity reported by Loren (Loren79.1 (1979)) at a position located at less than 40” from the star and measured with a beam size of 23; for this position Loren reported a velocity of 6.10.6 kms-1. More recently, Vilas-Boas et al. (VilasBoas00.1 (2000)) observed C18O emission from a condensation located at less than 4’ from LS-RCrA 1, using a beam size of about 15, and they obtained a LSR velocity of 5.651.18 kms-1.
Taking either 6 or 2 kms-1 as the stellar LSR velocity, all the measured forbidden lines are blueshifted with respect to the star (see Table 2). This may be interpreted as meaning that only the blueshifted component of the outflow is seen from our vantage point, with the redshifted one probably occulted by a circumstellar disk, as observed in most classical T Tauri stars. This hypothesis is supported by the asymmetric line profile of the [OI] lines, which display an extended blue wing but miss the red wing. These results, together with the fact that the forbidden lines are known to form at different distances from the star, strongly argue in favor of a disk seen at a geometry markedly different from edge-on. As in the case of Par-Lup3-4, the 10% width of the Hα emission, with values in the range from 265 to 300 kms-1, indicates that Hα is dominated by the accretion component formed near the surface of the star.
Barrado y Navascués et al. (Barrado04.1 (2004)) favour the hypothesis of an edge-on disk, as an explanation for the puzzling aspects of LS-RCrA 1, namely the lack of near-infrared (NIR) excess combined with accretion, the unusually prominent outflow signatures without high-velocity components or asymmetries, the very broad Hα, and the sub-luminosity. Nevertheless, we think that there are also explanations for all these features in the framework of the non edge-on disk hypothesis. No NIR excesses are expected for very low mass stars and brown dwarfs, as has been modeled by Natta & Testi (Natta01.1 (2001)) and has been confirmed by Barrado y Navascués et al. (Barrado04.3 (2004)), except for very few objects; such an excess is predicted for wavelengths longer than 3m. Our high resolution spectra show asymmetries on the forbidden line profiles. The very broad Hα profile indicates an unimpeded view to the close proximity of the stellar surface, where the largest velocities of the Hα-emitting gas arise (Appenzeller et al. Appenzeller05.1 (2005)). Concerning the sub-luminosity, we still support the hypothesis suggested by Fernández & Comerón (Fernandez01.1 (2001)) that, at these low masses, strong mass accretion might have an important effect on the position of the star on the HR diagram.
The central velocities measured for the forbidden lines differ notably. The lower velocities are found for the [OI] lines, while the [NII] lines give the highest values (see Table 2). The [OI] 6300 line has a critical density higher than that of [NII] 6583, and roughly 100 times that of the [SII] lines (Hartigan et al. Hartigan95.1 (1995)). Hartigan et al. analyzed a sub-sample of four stars for which they detect emission from three lines, [OI] 5577, [OI] 6300, and [SII] 6731, that have very different critical densities. The low velocity component of the three emission lines show a correlation in which the lower velocities correspond to the line with highest critical density ([OI] 5577); a similar behaviour is observed for LS-RCrA 1. They found this correlation to be consistent with acceleration in a disk wind, but also with an origin in an accretion column, because in either case the lines with higher critical density (like [OI]) form closer to the disk than the lines with low critical density, and the flow accelerates as it rises from the disk. Hirth et al. (Hirth97.1 (1997)) found that for a sample of 12 T Tauri stars, located at 120-140 pc, the centroid of the [OI] 6300 emission is located at an average distance of 02 from the star, whereas that of the [SII] 6731 and [NII] 6583 lines are factors of 3 and 3.5 times further away, respectively.
The bumps observed at about 50 kms-1 on the [SII] and [NII] lines may be due to either matter ejected closer to our line of sight or to a faster knot. Similar bumps have been observed, e.g., for the T Tauri stars DK Tau, GG Tau ad IP Tau (Hartigan et al. Hartigan95.1 (1995)).
5 Conclusions
We report the discovery of a jet emanating from the very low mass star Par-Lup3-4 (M5), and we confirm previous evidence of strong mass loss from another very low mass star, LS-RCrA 1 (M6.5 or later), most probably in the form of a jet or disk wind.
The line ratios of the forbidden lines of the jet of Par-Lup3-4 point to a low excitation jet. The double-peaked [SII] emission, centered on the LSR velocity of the Lupus 3 cloud in this region, allows us to set lower limits for the jet inclination: angles below 8°, with respect to the plane of the sky, would imply unlikely velocities above 150 kms-1. With such inclination only a very flared disk would hide the star. The large 10% width is attributed to the accretion related regions, which lie very close to or on the stellar surface, suggesting that the large Hα equivalent width measured for this object is not due to the selective blocking of the central object by an edge-on disk.
Hα emission, coming for an object located at 42 from Par-Lup3-4, has been detected in the two spectra taken at PA 33∘. The line profile, different from that of Par-Lup3-4, resembles that of other pre-main sequence objects. Upper limits for its brightness at visible and near infrared wavelengths suggest that, if associated with the Lupus 3 star forming region, it could be a young, very low mass brown dwarf.
All the forbidden lines that we have measured for LS-RCrA 1 are blueshifted with respect to the LSR velocity of the star. The emission from the receding part of the jet seems to be hidden by a non edge-on disk; a hypothesis that is supported by the fact that we detect Hα emission coming from the accretion related regions located close to the surface of the star. The velocities of the [OI] and [SII] forbidden emission lines are ordered inversely with their respective critical densities. This has been interpreted by Hartigan et al. (Hartigan95.1 (1995)), for more massive classical T Tauri stars, as acceleration from the most dense regions, close to the star, what would be consistent with acceleration in a disk wind, but also with an origin in an accretion column.
If both Par-Lup3-4 and LS-RCrA 1 have no edge-on disk, an alternative explanation is required in order to explain their unusual low luminosities. Strong accretion has been suggested to modify the position of classical T Tauri stars on the HR diagram (Hartmann et al. Hartmann97.1 (1997), Siess et al. Siess97.1 (1993)). Extending the modelling of the accretion effects towards the lowest stellar and substellar masses may indicate whether or not this is a viable explanation for the observed properties of these objects.
Acknowledgements.
We acknowledge the ESO staff who carried out the service mode observations, the ESO User Support Group for their valuable assistance in the preparation of our observations, and the ESO Data Flow Operations Group for the preparation of our data package. A. Kaufer, S. D’Odorico and L. Kaper, authors of the UVES User Manual, are also acknowledged, as well as those who prepared the UVES web pages. Fruitful discussions with Eike Guenther, Jochen Eislöffel, Jens Woitas, Enrique Pérez, Reinhard Mundt and Ferdinando Patat were very helpful, as were comments from David Barrado y Navascués and from David Butler. MF acknowledges ESO and the Thüringer Landessternwarte (Germany) for their hospitality. She received support from the Deutsches Zentrum für Luft- und Raumfahrt (DLR), Förderkennzeichen 50 OR 0401, and from the Spanish grant AYA2004-05395. This work has made use of the Digitized Sky Surveys, produced at the Space Telescope Science Institute under U.S. Government grant NAG W-2166, and of the NASA/IPAC Infrared Science Archive, which is operated by the Jet Propulsion Laboratory, California Institute of Technology, under contract with the National Aeronautics and Space Administration.References
- (1) Appenzeller, I., Bertout, C., & Stahl, O. 2005, A&A, in press
- (2) Bacciotti, F., & Eislöffel, J. 1999, A&A, 342, 717
- (3) Barrado y Navascués, D., & Jayawardhana, R. 2004, ApJ, 615, 840
- (4) Barrado y Navascués, D., Mohanty, S., & Jayawardhana, R. 2004, ApJ, 604, 284
- (5) Barrado y Navascués, D., Stauffer, J.R., Bouvier, J., Jayawardhana, R., & Cuillandre, J.-C. 2004, ApJ, 610, 1064
- (6) Burrows, A., Marley, M., Hubbard, W.B., et al. 1997, ApJ, 491, 856
- (7) Cabrit, S., Edwards, S., Strom, S.E., & Strom, K.M. 1990, ApJ, 354, 687
- (8) Comerón, F., Fernández, M., Baraffe, I., Neuhaeuser, R. & Kaas, A.A. 2003, A&A, 406, 1001
- (9) Fernández, M. Ortiz, E., Eiroa, C., & Miranda, L.F. 1995, A&AS, 114, 439
- (10) Fernández, M., & Comerón, F. 2001, A&A, 380, 264
- (11) Froebrich, D., Smith, M. D., Hodapp, K.-W., & Eisloeffel, J. MNRAS, 346, 163
- (12) Fuhrmeister, B., & Schmitt, J.H.M.M. 2004, A&A, 420, 1079
- (13) Gahm, G.F., Johansson, L.E.B., & Liseau, R. 1993, A&A, 274, 415
- (14) Gómez, M., Stark, D.P., Whitney, B.A., & Churchwell, E. 2003, ApJ, 126, 863
- (15) Hara, A., Tachihara, K., Mizuno, A., Onishi, T., Kawamura, A., Obayashi, A., & Fukui, Y. 1999, PASJ, 51, 895
- (16) Hartmann, L., 1998, “Accretion processes in star formation” Cambridge University Press, p.101
- (17) Hartmann, L., Cassen, P., & Kenyon, S.J. 1997, ApJ, 475, 770.
- (18) Hartigan, P., Edwards, S., & Ghandour, L. 1995, ApJ, 452, 736
- (19) Hirth, G.A., Mundt, R., Solf, J., & Ray, T.P. 1994, ApJ, 427, L99
- (20) Hirth, G.A., Mundt, R., & Solf, J. 1997, A&AS, 126, 437
- (21) Jayawardhana, R., Mohanty, S., & Basri, G. 2003, ApJ, 592, 282
- (22) Kaufer, A., D’Odorico, S., & Kaper, L. 2003 UV-Visual Echelle Spectrograph (UVES) User Manual, Doc. No. VLT-MAN-ESO-13200-1825, http://www.eso.org/instruments/uves/userman/
- (23) Loren, R.B., 1979 ApJ, 227, 832
- (24) Mohanty, S., Jayawardhana, R., Natta, A. et al. 2004, ApJ, 609, L33
- (25) Mohanty, S., Jayawardhana, R., & Basri, G. 2005, ApJ, in press
- (26) Mundt, R., & Eislöffel, J., 1998 AJ, 116, 860
- (27) Muzerolle, J., Hillenbrand, L., Calvet, N., Briceño, C., & Hartmann, L. 2003, ApJ, 592, 266
- (28) Natta, A., & Testi, L. 2001, A&A, 376, L22
- (29) Natta, A., Testi, L., Comerón, F., et al. 2002, A&A, 393, 597
- (30) Natta, A., Testi, L., Muzerolle, J., et al. 2004, A&A, 424, 603
- (31) Neuhäuser, R., Walter, F.M., Covino, E., et al. 2000, A&AS, 146, 323
- (32) Quillen, A.C., & Trilling, D.E. 1998, ApJ, 508, 707
- (33) Reipurth, B., Pedrosa, A., & Lago, M.T.V.T. 1996, A&AS, 120, 229
- (34) Siess, L., Forestini, M., & Bertout, C. 1997, A&A, 326, 1001
- (35) Solf, J., & Böhm, K.H. 1993, ApJ, 410, L31
- (36) Sterzik, M.F., Pascucci, I., Apai, D., van der Bliek, N., & Dullemond, C.P. 2004, A&A, 427, 245
- (37) Vilas-Boas, J.W.S., Myers, P.C., & Fuller, G.A. 2000, ApJ, 532, 1038
- (38) White, R.J., & Basri, G. 2003, ApJ, 582, 1109