X-rays from the Type II quasar in the hyperluminous infrared galaxy IRAS F15307+3252
Abstract
We report the detection of X-ray emission from the hyperluminous infrared galaxy IRAS F15307+3252 at and its properties obtained from XMM-Newton observations. Although the X-ray emission is very faint and the data are noisy, a prominent line-like feature in the observed 3–4 keV range is inferred from both photometric and spectroscopic techniques. It indicates an X-ray spectrum dominated by 6.4 keV Fe K emission and the presence of a Compton-thick AGN. Our estimate of the luminosity of the illuminating source (erg s-1), required to produce the observed Fe K emission in reflection from cold matter, means that the hidden quasar nucleus accounts for a significant fraction of the large bolometric luminosity. The soft X-ray emission below 2 keV is found to be spatially extended and probably of a separate origin. The temperature and bolometric luminosity ( keV and erg s-1) obtained from a thermal spectrum place this X-ray source on the - relation of galaxy clusters. The possible association with a galaxy cluster can be added to the list of remarkable similarities between IRAS F15307+3252 and another hyperluminous infrared galaxy IRAS 09104+4109 (), both of which have bolometric luminosities dominated by hidden quasar nuclei. Our result on IRAS F15307+3252 illustrates how difficult it is to detect Compton thick Type II quasars at , particularly if their bolometric outputs do not rival the hyperluminous population.
keywords:
Galaxies: individual: IRAS F15307+3252 — X-rays: galaxies — X-rays: galaxies: clusters — infrared: galaxies1 Introduction
The class of hyperluminous infrared galaxies, whose bolometric luminosities exceed L⊙, have been found through far-infrared and submillimetre surveys by IRAS and SCUBA (e.g., Rowan-Robinson 2000), and more are expected from the Spitzer Space Telescope. Some of them may be massive galaxies in formation at high redshift and, given the suggested link between galaxy spheroids and central black holes in them (e.g., Tremaine et al 2002), they might represent an important galaxy evolution phase where a quasar nucleus is forming amid heavy dust obscuration (e.g., Sanders et al 1988). A population of mid-infrared-selected hyperluminous objects at , which appear to be powered mainly by obscured active galactic nuclei (AGN), are emerging from Spitzer surveys (Houck et al 2005). As well as the origin of the enormous luminosity being of a great interest, examining the role of luminous counterparts of nearby Compton-thick Seyfert AGN to the X-ray background (XRB) and their detectability is also important, since the higher energy part of the XRB is not yet fully resolved (Worsley et al 2005).
IRAS F15307+3252 is one of the few classical IRAS-selected hyperluminous infrared galaxies at redshift of (Cutri et al 1994). With the currently popular cosmology with km s-1 Mpc-1, , and , the luminosity distance is 6.1 Gpc and and the bolometric luminosity is estimated to be L⊙.
The large bolometric luminosity was once suspected to be the result of gravitational lensing (Liu, Graham & Wright 1996) as in the case of IRAS F10214+4724 at (e.g., Broadhurst & Lehar 1995). However Farrah et al (2002) have ruled this out based on HST imaging. Therefore, IRAS F15307+3252 indeed belongs among the most luminous objects in the universe.
The UV/optical emission-line spectrum of IRAS F15307+3252 is of Seyfert 2 type (Cutri et al 1994; Soifer et al 1994; Liu et al 1996; Evans et al 1998). Optical spectropolarimetry has revealed broad MgII emission and a rest-frame UV spectrum which is very similar in shape and intensity to that of typical quasars, indicating the presence of a dust-shrouded quasar nucleus (Hines et al 1995).
Despite the optical evidence for hidden active nuclei, hyperluminous infrared galaxies are generally very faint in X-ray (Wilman et al 1998; 2003; see Franceschini et al 2000; Iwasawa, Ettori & Fabian 2000 for IRAS P09104+4101; Iwasawa 2001; Alexander et al 2005 for IRAS F10214+4724). IRAS F15307+3252 is no exception and previous X-ray observations with ROSAT and ASCA failed to detect any X-rays (Fabian et al 1996; Ogasaka et al 1997). We report here the detection of faint X-ray emission from this hyperluminous infrared galaxy and its properties obtained from XMM-Newton observations, and discuss their implications.
2 Observations
IRAS F15307+3252 was observed with the EPIC cameras of XMM-Newton on three occasions (Table 1). Both EPIC pn and MOS cameras operated in the full-window mode with the medium filter in all the three observations. A significant fraction of the datasets are affected by high radiation background. A larger fraction of the observed intervals are affected in the pn data than in the MOS data. Time intervals of quiescent background (count rate less than 0.3 ct s-1 for each of the MOS and less than 1.2–1.5 ct s-1 for the pn) were selected, based on the single event light curves at energies above 10 keV taken from the whole field of each detector. The useful exposures from the three observations are 6, 10, and 5 ks (21 ks in total) for the pn camera, and 10, 12, and 11 ks (33 ks in total) for the MOS cameras. Single and double events recorded by the detectors were used for the data analysis presented here. The data reduction was performed by the standard XMM-Newton software package SAS 6.1 and LHEASOFT 5.3.1.
| Date | pn | MOS |
|---|---|---|
| ks | ks | |
| 2002 Jul 30 | 6.7 (24) | 10 (25) |
| 2004 Jul 29 | 9.6 (30) | 12 (31) |
| 2004 Dec 30 | 5.1 (23) | 11 (18) |
3 Results
3.1 Photometric study
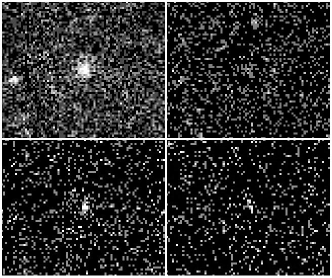
IRAS F15307+3252 is detected with XMM-Newton but is very faint, particularly at energies above 2 keV. With so few detected counts, the individual observations do not warrant an independent analysis. We integrated all three datasets to examine source detection first in different energy bands. Compton-thick obscuration can be a plausible explanation for the X-ray faintness of IRAS F15307+3252. Since a strong Fe K feature at rest-frame 6–7 keV would characterise the X-ray spectrum in such a case, we designed a photometric study by dividing the whole bandpass into the following four bands: 0.5–2 keV, 2–3 keV, 3–4 keV, and 5–10 keV, so that Fe K feature falls in the 3–4 keV band by the galaxy redshift (). X-ray images in the four bands were constructed by adding all the pn and MOS data from the three observations, which are shown in Fig. 1.
IRAS F15307+3252 is detected at more than in all but the 2–3 keV band images (see Table 1). The source is strongly detected at lower energies below 2 keV for which further details are presented below. This component does not seem to stretch well above 2 keV, as suggested by the lack of detection in the 2–3 keV band. Note, however, a remarkable recovery of the source in the 3–4 keV band. This indicates a strong excess in the 3–4 keV range, where Fe K emission is expected. The 2–3 keV drop-out and the marginal detection in the 5–10 keV band suggest a rather hard underlying continuum in the 2–10 keV (the rest frame 4–20 keV) range. These are characteristics of the X-ray spectrum of a heavily absorbed active nucleus.
3.2 Extended soft X-ray emission and its origin

The soft X-ray emission below 2 keV found at the position of IRAS F15307+3252 is not point-like. The radial profile of the soft band source is compared with that of the nuclear source in NGC4395, which was also observed with the XMM-Newton in the full-window mode (Fig. 2). Since the X-ray emission from NGC4395 has been found to be point-like as viewed by the Chandra ACIS-S (Moran et al 2005), it represents the point spread function (PSF). Although adding different detectors and observations together might have resulted in a blurred PSF at some degree, a comparison of the radial profile with other point sources in the field confirms the extended nature of the soft X-ray emission from IRAS F15307+3252.
The angular scale at with the adopted cosmology is kpc arcsec-1. Detection of a source size broader than the PSF (FWHM 5-6 arcsec) means that the source is extending at least kpc. Fitting a Lorentzian function to the respective radial profiles of IRAS F15307+3252 and NGC4395 implies that the FWHM of the intrinsic source extension is about arcsec, corresponding to 85 kpc in radius. This is larger than the effective radius ( kpc, Farrah et al 2002) of the giant elliptical host of IRAS F15307+3252, of which the surface brightness distribution is described well with the de Vaucouleur’s profile (see also Liu et al 1996).
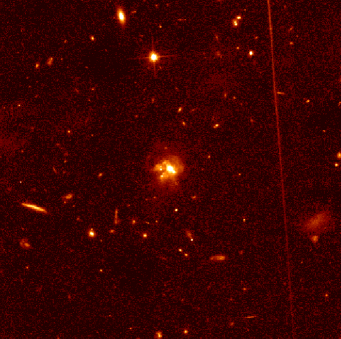
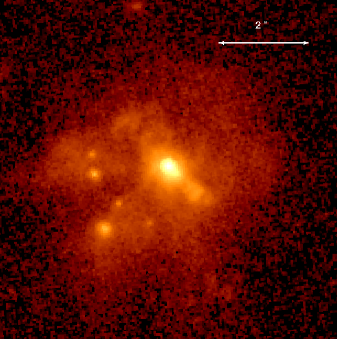
No galaxy cluster has so far been reported for the region around IRAS F15307+3252. However, IRAS F15307+3252 is a luminous (, Farrah et al 2002) giant elliptical, inside which some substructures have been found, indicating galaxy mergers or interaction (Fig. 3, also Soifer et al 1994; Liu et al 1996; Farrah et al 2002). The galaxy is mag more luminous than the Virgo brightest galaxy M87, and should be in a relatively massive dark matter halo. Fig. 3 shows the HST/ACS image of the region around IRAS F15307+3252, retrieved from the HST archive at STScI. The data were taken on 2002 August 18 in a 2,120-s exposure, using the F814W filter (approximately band). While there is no clear evidence for a galaxy concentration centred on the IRAS galaxy as such expected in a rich cluster, a chain of several small galaxies 11–15 arcsec ( kpc) to the south is seen, which lies within the X-ray extension, indicating a moderate galaxy over-density. The HST image also shows that both IRAS F15307+3252 and the several nearby compact knots (which Farrah et al 2002 ascribe to the remnants of merging companions) are embedded in an envelope of diffuse emission out to a radius of 3 arcsec. There is considerable structure within this emission, including a sharp conical-shaped cavity to the SE with its apex at the AGN. Further arc-shaped structures concentric to the active nucleus and perpendicular to the cavity are also apparent, which could be due to [OII] located near the edge of the filter bandpass, representing ionization cones.
Fitting jointly the pn and MOS spectra (Fig. 4) gives a temperature of keV (hereafter, the errors for spectral parameters are of the 90 per cent confidence region for one parameter of interest). The 0.4–2.8 keV band was fitted with half solar metallicity and Galactic absorption of cm-2 (Dickey & Lockman 1990) being assumed. The observed 0.5–2 keV flux is erg cm-2 s-1. The absorption-corrected bolometric luminosity is estimated to be erg s-1. The temperature and bolometric luminosity are on the - relation for galaxy clusters, groups and elliptical galaxies (e.g., Fukazawa et al 2004), and IRAS F15307+3252 lies in the region for a poor cluster (it is comparable to the Virgo cluster in temperature and luminosity). We tentatively identify the extended soft X-ray emission with hot gas associated with a relatively poor cluster around the IRAS galaxy.
Whilst soft X-ray emission in some hyperluminous infrared galaxies has been ascribed to star formation (Wilman et al 2003; Alexander et al 2005), the large source size, high temperature and large soft X-ray to infrared luminosity ratio suggest that a starburst is unlikely to be a major component of the soft X-ray emission in IRAS F15307+3252 (see also Section 4.2). The cluster emission has a relatively short radiative cooling time of Gyr. This would lead to a cooling flow of yr-1 if there is no heating to balance cooling (there is a 6 mJy FIRST radio source at 1.4 GHz; Becker, White & Helfand 1995).
3.3 Fe K line and hard X-ray emission

The photometric study (Section 3.1) demonstrated that X-ray emission of IRAS F15307+3252 shows a strong excess in the 3–4 keV range, which is probably due to a redshifted Fe K line. There is a very faint underlying continuum, which extends to higher energies. The faint 5–10 keV band is too noisy for a spectral study and only fit for a photometric measurement. The spectral data in the 2–5 keV band can be fitted with a narrow gaussian with a flat power-law (). The centroid of the gaussian is keV in the rest frame. The fit shows a line width of 0.1 keV in gaussian dispersion, but the data also agree with no broadening. Assuming this feature is all due to line emission yields a line flux of ph s-1 cm-2. Since the continuum is too faint to obtain a reasonable constraint, the equivalent width (EW) of the line is accordingly uncertain, but it is likely to be larger than 2 keV.
The observed 2–5 keV flux is erg cm-2 s-1 (corresponding to a 4–10 keV rest frame luminosity of erg s-1), most of which originates from the line feature. Extrapolating the 2–5 keV continuum model with predicts source counts which are comparable to the detected counts in the 5–10 keV image at the given exposure times. The observed 5–10 keV flux derived from the extrapolation is erg cm-2 s-1, and the rest-frame 10–20 keV luminosity estimated from the flux is erg s-1.
4 Discussion
4.1 The hidden quasar nucleus
The detection of the prominent Fe K line strongly indicates the presence of a Compton-thick AGN in IRAS F15307+3252. The large EW of the Fe K and the deficit of X-ray emission just below the line imply the lack of the direct continuum emission in the Fe K band, which means the absorbing column density to be cm-2 or larger. Thus, together with the line centroid at 6.4 keV, the hard X-ray emission from IRAS F15307+3252 is dominated by reflection.
Using the observed line luminosity, we made a rough estimate of the minimum rest-frame 2–10 keV luminosity which is required to produce the observed Fe K emission. Assumptions made for this calculation are as following: Fe K emission is produced in cold matter with Solar abundance (, Morrison & McCammon 1983), irradiated by a power-law source with a typical quasar photon-index of ; the continuum photons above the K-shell ionization threshold energy (7.11 keV) are converted into Fe K at 6.4 keV with the efficiency calculated by Basko (1978) and George & Fabian (1991), as such that would produce eV, if an observer see both the illuminating source and reflection from the cold slab behind it; and the solid angle of the cold matter viewed by the illuminating source is . With these assumptions, the ratio is found to be about 3 per cent. Since not all the reflecting surfaces are likely visible to an observer, the minimum 2–10 keV luminosity to produce the observed Fe K line is estimated to be erg s-1. The ratio of bolometric to the 2–10 keV band luminosity, , is typically 30–50 for quasars (Elvis et al 1994). With this bolometric correction, the bolometric luminosity of the AGN in IRAS F15307+3252 is found to be erg s-1, where . Therefore a large fraction of the bolometric luminosity (erg s-1) is likely to be powered by the hidden AGN, consistent with previous estimates (e.g., Yun & Scoville 1998; Aussel et al 1998; Verma et al 2001; Peeters, Spoon & Tielens 2004).
The reflected X-ray emission originates from optically thick matter and is of a distinct origin from the scattered UV/optical light revealed by spectropolarimetry (Hines et al 1995). The large polarization in the UV/optical bands (16–20 per cent) is presumably due to dust scattering.
4.2 Black holes in hidden quasars and their environment
The black hole masss hosted in IRAS F15307+3252 is estimated to be M⊙, using the empirical relation based on the virial theorem for the BLR obtained by McLure & Jarvis (2002) with the MgII line width of FWHM km s-1 and the 3000 Å luminosity (erg s-1) of the intrinsic UV spectrum derived from the spectropolarimetry (Hines et al 1995). The bolometric luminosity of this object is then about half the Eddington luminosity for the estimated black hole mass.
IRAS F15307+3252 shares many properties with another hyperluminous infrared galaxy IRAS 09104+4109. In their spectral energy distribution, the infrared to optical and 60 m to 1.5 GHz luminosity ratios for both galaxies are around 300 and 50, respectively (Cutri et al 1994). Both contain a hidden quasar revealed by optical spectropolarimetry (Hines et al 1999), which appears to dominate the energetics of the infrared emission, and their X-ray spectra show characteristics of Compton-thick AGN (Franceschini et al 2000; Iwasawa et al 2001). The black hole mass of IRAS 09104+4109 estimated by the same technique as described above is M⊙(V.D. Ivanov, priv comm), similar to that of IRAS F15307+3252. These suggest that both galaxies have a well-grown black hole emitting at a high efficiency, although their radiation is strongly attenuated by dust shrouds in the optical wavelength and by cold gas with a large Thomson depth () in the line-of-sight in X-ray, respectively. Non-detection of CO (Evans et al 1998; Yun & Scoville 1998) in either galaxies limits the material needed for a vigorous star formation. The deficit of cold ( K) dust in both galaxies inferred by the non-detection with SCUBA (Deane & Trentham 2001; which places the limit of the contribution of cold dust to the bolometric luminosity less than 0.3 per cent) can be a natural consequence of the absence of a strong starburst. Perhaps in these two galaxies, a mature black hole is still efficiently accreting material from small radii, while star formation on a large scale has already been terminated. As Hines et al (1995) suggested, the AGNs in these galaxies are viewed from an unfavourable direction but otherwise are indistinguishable from normal quasars.
One remaining similarity between the two objects is their environment. IRAS 09104+4109 is a giant elliptical located at the centre of a rich cluster at (Kleinmann et al 1988), which is one of the most luminous X-ray clusters with erg s-1(Fabian & Crawford 1995; Iwasawa et al 2001). Despite the much lower luminosity and higher redshift, IRAS F15307+3252 appears to be in a cluster as the extended X-ray emission indicates. If this is the case, galaxy mergers in an overdensity region may be a necessary condition for making a luminous quasar. This contrasts with nearby lower luminosity infrared galaxies which are not usually found in a rich environment (Sanders & Mirabel 1996). On the other hand, quasars (Wold et al 2000, 2001) and possibly hyperluminous infrared galaxies (Farrah et al 2004) tend to reside in a moderately dense environment, and which is in agreement with galaxy and quasar formation model based on a hierarchical assembly scenario (e.g., Enoki, Nagashima & Gouda 2003). This has implications for a search for Type II quasars in X-ray. In an unobscured quasar, the nuclear emission dominates the total X-ray emission even if there is some emission from a cluster with which the quasar is associated. However, in an obscured quasar, the nuclear emission is suppressed and soft X-ray emission from a putative cluster could be a main X-ray source rather than the quasar itself. Whether faint reflected light of a hidden nucleus is detectable depends on its luminosity. Since such a component was only barely detected in IRAS F15307+3252, one of the most luminous galaxies, with a 30 ks XMM-Newton exposure, there are clear difficulties in detecting Compton-thick AGN at redshift of .
Acknowledgements
This paper is based on observations obtained with XMM-Newton, an ESA science mission with instruments and contributions directly funded by ESA Member States and NASA. ACF and CSC thank the Royal Society for support. KI thanks PPARC for support.
References
- [1] Alexander D.M., Chartas G., Bauer F.E., Brandt W.N., Simpson C., Vignali C., 2005, MNRAS, in press
- [\citeauthoryearAussel et al.1998] Aussel H., Gerin M., Boulanger F., Desert F. X., Casoli F., Cutri R. M., Signore M., 1998, A&A, 334, L73
- [2] Basko M.M., 1978, ApJ, 223, 268
- [3] Becker R.H., White R.L., Helfand D.J., 1995, ApJ, 450, 559
- [\citeauthoryearBroadhurst & Lehar1995] Broadhurst T., Lehar J., 1995, ApJ, 450, L41
- [4] Cutri R.M., Huchra J.P., Low F.J., Brown R.L., van den Bout P.A., 1994, ApJ, 424, L65
- [\citeauthoryearDeane & Trentham2001] Deane J. R., Trentham N., 2001, MNRAS, 326, 1467
- [\citeauthoryearDickey & Lockman1990] Dickey J. M., Lockman F. J., 1990, ARA&A, 28, 215
- [5] Elvis M., et al, 1994, ApJS, 95, 1
- [6] Enoki M., Nagashima M., Gouda N., 2003, PASJ, 55, 133
- [\citeauthoryearEvans et al.1998] Evans A. S., Sanders D. B., Cutri R. M., Radford S. J. E., Surace J. A., Solomon P. M., Downes D., Kramer C., 1998, ApJ, 506, 205
- [7] Fabian A.C., Crawford C.S., 1995, MNRAS, 274, L63
- [\citeauthoryearFabian et al.1996] Fabian A. C., Cutri R. M., Smith H. E., Crawford C. S., Brandt W. N., 1996, MNRAS, 283, L95
- [\citeauthoryearFarrah et al.2002] Farrah D., Verma A., Oliver S., Rowan-Robinson M., McMahon R., 2002, MNRAS, 329, 605
- [8] Farrah D., Geach J., Fox M., Serjeant S., Oliver S., Verma A., Kaviani A., Rowan-Robinson M., 2004, MNRAS, 349, 518
- [\citeauthoryearFranceschini et al.2000] Franceschini A., Bassani L., Cappi M., Granato G. L., Malaguti G., Palazzi E., Persic M., 2000, A&A, 353, 910
- [9] Fukazawa Y., Makishima K., Ohashi T., 2004, PASJ, 56, 965
- [10] George I.M., Fabian A.C., 1991, MNRAS, 249, 352
- [\citeauthoryearHines et al.1995] Hines D. C., Schmidt G. D., Smith P. S., Cutri R. M., Low F. J., 1995, ApJ, 450, L1
- [\citeauthoryearHouck et al.2005] Houck J. R., et al., 2005, ApJ, 622, L105
- [11] Iwasawa K., 2001, AIP Conf. Proc. 599,: X-ray Astronomy: Stellar Endpoints, AGN, and the Diffuse X-ray Background, 599, 169
- [\citeauthoryearIwasawa, Fabian, & Ettori2001] Iwasawa K., Fabian A. C., Ettori S., 2001, MNRAS, 321, L15
- [\citeauthoryearKleinmann et al.1988] Kleinmann S. G., Hamilton D., Keel W. C., Wynn-Williams C. G., Eales S. A., Becklin E. E., Kuntz K. D., 1988, ApJ, 328, 161
- [\citeauthoryearLiu, Graham, & Wright1996] Liu M. C., Graham J. R., Wright G. S., 1996, ApJ, 470, 771
- [\citeauthoryearMcLure & Jarvis2002] McLure R. J., Jarvis M. J., 2002, MNRAS, 337, 109
- [12] Moran E., Eracleous M., Leighly K.M., Chartas G., Filippenko A.V., Ho L.C., Blanco P.R., 2005, AJ, 129, 2108
- [\citeauthoryearMorrison & McCammon1983] Morrison R., McCammon D., 1983, ApJ, 270, 119
- [\citeauthoryearOgasaka et al.1997] Ogasaka Y., Inoue H., Brandt W. N., Fabian A. C., Kii T., Nakagawa T., Fujimoto R., Otani C., 1997, PASJ, 49, 179
- [\citeauthoryearPeeters, Spoon, & Tielens2004] Peeters E., Spoon H. W. W., Tielens A. G. G. M., 2004, ApJ, 613, 986
- [\citeauthoryearRowan-Robinson2000] Rowan-Robinson M., 2000, MNRAS, 316, 885
- [13] Sanders D.B., Mirabel F.I., 1996, ARAA, 34, 749
- [\citeauthoryearSanders et al.1988] Sanders D. B., Soifer B. T., Elias J. H., Madore B. F., Matthews K., Neugebauer G., Scoville N. Z., 1988, ApJ, 325, 74
- [14] Stanford S.A., Stern D., van Breugel W., De Breuck C., 2000, ApJS, 131, 185
- [\citeauthoryearSoifer et al.1994] Soifer B. T., Neugebauer G., Matthews K., Armus L., 1994, ApJ, 433, L69
- [15] Tremaine S.D., et al, 2002, ApJ, 574, 740
- [\citeauthoryearVerma et al.2002] Verma A., Rowan-Robinson M., McMahon R., Andreas Efstathiou A. E., 2002, MNRAS, 335, 574
- [\citeauthoryearWilman et al.2003] Wilman R. J., Fabian A. C., Crawford C. S., Cutri R. M., 2003, MNRAS, 338, L19
- [\citeauthoryearWilman et al.1998] Wilman R. J., Fabian A. C., Cutri R. M., Crawford C. S., Brandt W. N., 1998, MNRAS, 300, L7
- [\citeauthoryearWold et al.2001] Wold M., Lacy M., Lilje P. B., Serjeant S., 2001, MNRAS, 323, 231
- [\citeauthoryearWold et al.2000] Wold M., Lacy M., Lilje P. B., Serjeant S., 2000, MNRAS, 316, 267
- [\citeauthoryearWorsley et al.2005] Worsley M. A., et al., 2005, MNRAS, 357, 1281
- [\citeauthoryearYun & Scoville1998] Yun M. S., Scoville N. Z., 1998, ApJ, 507, 774