Integral Field Spectroscopy of Faint Haloes of Planetary Nebulae
Abstract
We present the first integral field spectroscopy observations of the two planetary nebulae NGC 3242 (catalog ) and NGC 4361 (catalog ) with the VIMOS instrument attached to VLT-UT3. By co-adding a large number of spaxels we reach an emission line detection limit of erg cm-2 s-1 arcsec-2. In the case of NGC 3242 (catalog ), we succeed in determining some properties of the halo. The radial surface brightness profile in [O iii] implies increasing mass loss before the formation of the PN. Traces of the mysterious ‘rings’ are clearly visible. We find for the first time an apparent temperature gradient across a halo: from about 16 000 K close to the shell/halo transition to 20 000 K at the halo’s outer edge. No line emission is seen in the suspected halo region of NGC 4361 (catalog ) down to the sensitivity limit.
1 Introduction
Next to supernova explosions, stellar winds on the asymptotic giant branch (AGB) make significant contributions to the recycling of chemically enriched material to the interstellar medium. The physics of AGB mass loss is therefore a key ingredient for our understanding of the evolution of galaxies, as far as the recycling of matter, processed by different stellar populations, is concerned. Despite considerable progress in our theoretical understanding of stellar evolution and mass loss during the last AGB phase, observational details of this critical period have remained obscure. Haloes of planetary nebula (PN) are fossil records of the mass loss history at the tip of the AGB, which, in principle, can be investigated with the plasmadiagnostic tools for gaseous nebulae. However, spectroscopy of these low surface brightness regions is extremely difficult to perform with conventional slit spectrographs.
Encouraged by successful experiments with the PMAS instrument (Roth et al., 2004, 2005), we have employed the technique of integral field spectroscopy (IFS) to obtain unprecedented sensitivity for the measurement of PN emission line intensities, by co-adding very many spatial elements (spaxels) over the field-of-view (FOV) of an integral field unit (IFU). We have used the unique light-collecting properties of the VIMOS IFU at the VLT for a plasma diagnostic analysis of selected targets from the catalogue of PN haloes of Corradi et al. (2003) with the goal to measure , , and chemical composition in order to test the most recent theoretical predictions.
Here we present first results from the spatially resolved spectrophotometry in the outskirts of NGC 4361, which is a low-metallicity galactic halo object, and of the disk PN NGC 3242. Both objects are well developed PNe with central stars of very similar effective temperatures, viz. of for NGC 3242 (catalog ) and for NGC 4361 (catalog ), respectively (Mendez et al., 1992). NGC 3242 (catalog ) has a well defined halo at the percent level of the peak surface brightness (Corradi et al., 2003), where recently mysterious ‘rings’ have been detected (Corradi et al., 2004). To date, no halo has been reported for NGC 4361 (catalog ). Also, due to its low metal content, the electron temperature of NGC 4361 (catalog ) () is unusually large (Torres-Peimbert et al. 1990).
2 Observations
We performed VLT observations at UT3 “Melipal” on April 17 and 18, 2004, using the VIMOS-IFU.The instrument was setup in the LR_blue mode with a spaxel scale of 067, a FOV of , a nominal wavelength range of 3700–6700 Å, 5.3 Å pix-1 reciprocal dispersion, and a spectral resolution of . Both nights were photometric, with a seeing of and FWHM, respectively. We observed each object with a series of snapshot exposures centered on the central star in order to obtain a reference in the bright part of the nebula, and a series of deep exposures in one or two halo fields as the major objective of this run: s centered on NGC3242, s offset by 55 and 63 arcsec to the west (halo fields), mosaic centered on NGC 4361 with 300 s each, and s adjacent to this mosaic to the west (see Fig. 1, Fig. 2). Internal continuum and arc lamp flatfield as well as spectrophotometric standard star exposures were taken throughout the night.
3 Data Reduction
The data reduction was performed with a modified subset of routines from the PMAS P3d pipeline (Becker, 2002; Roth et al., 2005). An input list of data and calibration files was processed by an IDL script such that each of the four VIMOS channels was treated separately, dissecting each CCD frame into four subfields which correspond to a bank of spectra from the same pseudo-slit. Thus a total of 16 subfields was piped into the P3d routines, which then operated like with ordinary PMAS frames.
The data reduction proceeded as follows: firstly, the bias level was subtracted and cosmic ray hits were removed. Secondly, a trace mask was generated from an internal continuum calibration lamp exposure, identifying the location of each spectrum on the CCD along the direction of dispersion. In order to make this procedure robust, it was necessary to truncate the spectra on each side and discard regions with contamination from adjacent spectra of a neighbouring bank. Since VIMOS calibration spectra are taken only when the telescope is pointing to the zenith, and because of the presence of significant flexure, the trace mask had to be shifted in x and y to match the location of the actual science exposure. The offset for this task was obtained from a cross-correlation between the calibration lamp and science exposure. Thirdly, the spectra were extracted using a simple swath extraction technique (no profile fitting). After this, the data had changed from a CCD-based format to the so-called row-stacked-spectra (RSS) format, which is a 2-dimensional image where each row represents a spectrum. As the fourth step, the RSS frame was wavelength-calibrated with an arc exposure, which turned out to be a critical step since spectral line artefacts (zero and higher order contamination) sometimes confused the P3d line search algorithm. The last step consisted in a correction of the spectrum-to-spectrum sensitivity variation, which was performed by dividing by an extracted and normalized continuum lamp flatfield exposure.
Flux calibration was performed from a series of standard star exposures which were taken in different quadrants of the IFU in order to obtain an idea of the achievable accuracy. There is considerable scatter, indicating that the flux calibration is not uniform over the face of the IFU. Secondly, an inspection of the standard deviation as a function of wavelength shows that only within a window of [4200 Å,6100 Å] the variation is reasonably behaved ( % r.m.s). The region of the spectra beyond 6100 Å presents an artifact probably due to other orders contamination. In addition, wavelength calibration in this range was not accurately enough and some spectra lacked a red continuum for H which prevents us for using this line in the analysis.
4 Results and Discussion
4.1 Maps, IFU defects, PN morphologies
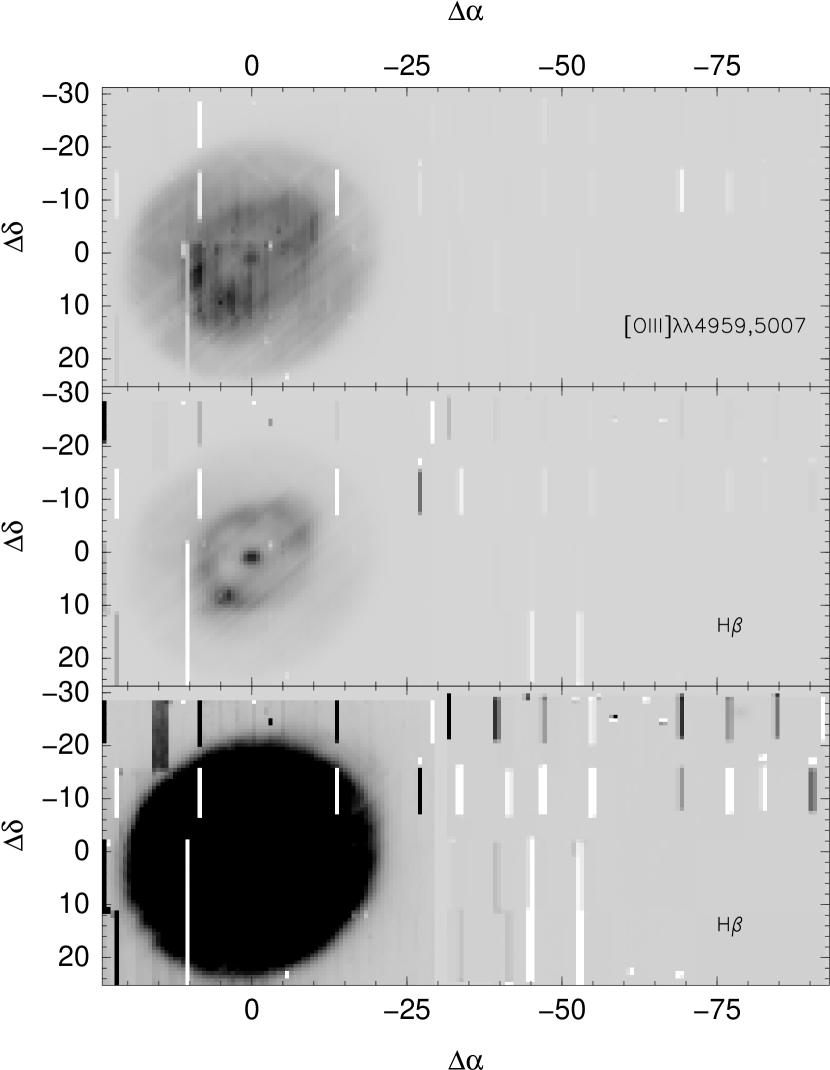
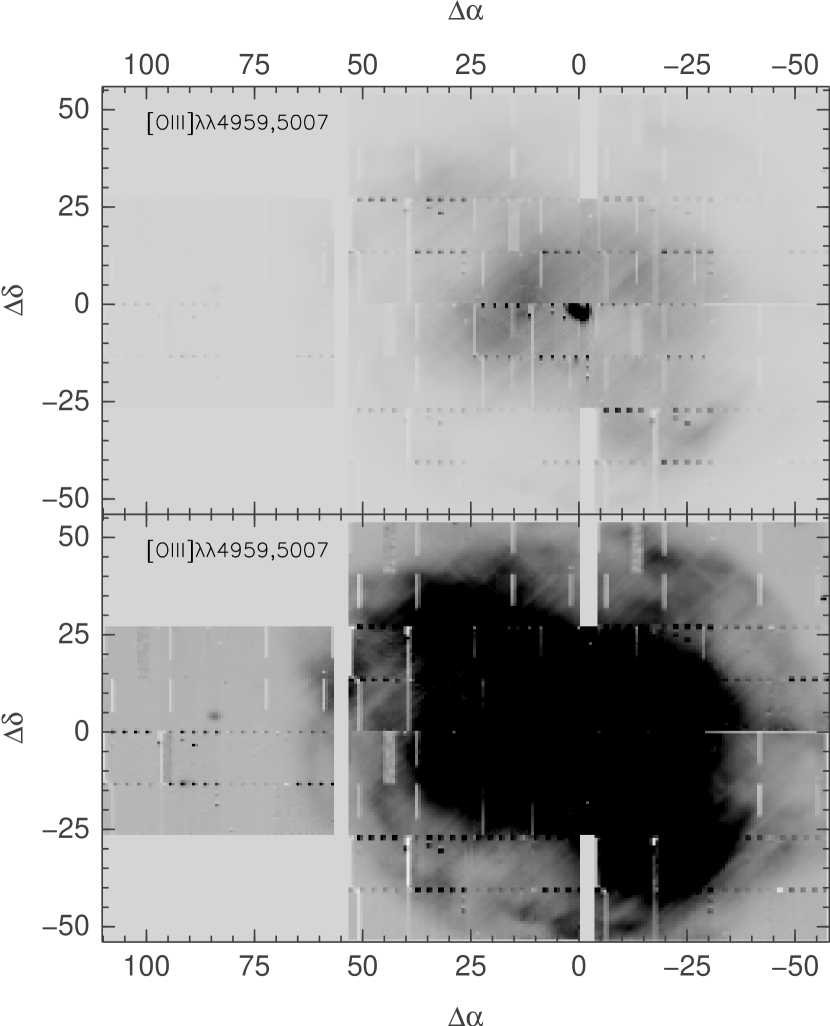
Figures 1 and 2 show maps of NGC 3242 (catalog ) and NGC 4361 (catalog ) in the emission lines of [O iii]4959,5007 Å and H, respectively. Various IFU defects are scattered over the FOV as distinct rectangles, which needed to be discarded from the subsequent analysis. The limited accuracy of the calibration of spaxel-to-spaxel response variation is visible in some vertical or diagonal intensity enhancements, e.g. in the [O iii]4959,5007 Å and H frames of NGC 3242 (catalog ).
Despite these cosmetic limitations, the fundamental morphological appearance as described in Corradi et al. (2003) is clearly visible as far as the brighter parts of the nebulae are concerned: central star, central cavity with enhanced rim, and shell. This gross morphology can be fully explained by the combined action of thermal pressure due to the heating of the nebular gas by photo-ionization and of dynamical pressure excerted by the fast stellar wind (cf. Perinotto et al., 2004). As can be seen from the Figs. 1 and 2, the surface-brightness distribution of NGC 4361 (catalog ) appears to be much smoother, with no clear distinction between rim and shell. This difference in morphology may well be caused by the low metallicity, since it is known that stellar winds become less vigorous for metal-poor stars (cf. Vink et al., 2001). A faint halo is not directly visible in any of the maps at the chosen constrast level.
4.2 Emission line intensities, radial profiles
Fig. 3 shows observed and continuum substracted radial profiles in [O iii]4959, 5007 Å along RA and DEC axes. The faint nebular continuum and emission lines make an appreciable background contribution, which is roughly a factor of 50 below the [O iii] lines intensity, but which becomes negligible as the former approaches the level of the night sky continuum background. For NGC 3242 (catalog ), this happens beyond a radial distance of arcsec from the central star, from where we have chosen an average as an estimate of the true sky background at the wavelength of the [O iii] lines (NGC 4361 (catalog ): also beyond arcsec). Using this procedure, we measure the averaged halo [O iii]4959,5007 Å intensity, corrected for sky, as 4.1 erg cm-2 s-1 arcsec-2, which is a factor of below the the intensity of the rim. For NGC 4361 (catalog ), having a more than two orders of magnitude fainter surface brightness than NGC 3242 (catalog ), no halo emission is seen in Fig. 3.
In order to increase the sensitivity for the outer halo regions, we co-added very many spaxels over extended regions beyond the shell to obtain an estimate of the average emission line intensity of the halo. Fig. 4 illustrates the results. For NGC 3242 (catalog ), the average spectrum clearly confirms the presence of an emission-line halo. Besides the detection of H, which is blended with a sky background feature, there is also the line blend of H and [O iii]4363, the latter being important for measuring the electron temperature. We have measured mean intensities for H, [O iii]4363, H and [O iii]4959,5007 of (8.9, 9.9, 19.8, 411.9) and (51.4, 66.8, 114.7, 4426.4) erg cm-2 s-1 arcsec-2 for the outer and inner region of the halo respectively. Obviously, the accuracy of this result would significantly benefit from higher spectral resolution, e.g. the VIMOS-IFU HR modes, offering a 10-fold higher resolving power than our current data, at the expense of a 4 times smaller FOV.
In the case of NGC 4361 (catalog ), however, there is no detection of halo line emission. We derived the detection limit by simulating emission lines with different intensities, which where superimposed on the co-added NGC 4361 (catalog ) spectrum, and attempting to recover these lines with gaussian fits. Our detection limit estimate in the halo of NGC 4361 (catalog ) is erg cm-2 s-1 arcsec-2. This value is not quite 2 orders of magnitude below the rim surface brightness, i.e. not sufficient for the typical intensity contrast of (Corradi et al., 2003). Also for this object, suppressing the sky background with higher spectral resolution would significantly lower the detection limit, most probably down to the expected halo surface brightness on the order of erg cm-2 s-1 arcsec-2.
4.3 The halo of NGC 3242
The background-subtracted intensity profile in [O iii]4959,5007 Å for the halo of NGC 3242 (catalog ) is shown in Fig. 5. We attribute small intensity ‘bumps’ to the existence of so-called halo ‘rings’ found recently in a number of PNe (Balick et al., 2001; Corradi et al., 2004). The agreement with the radial positions given by Corradi et al. is good, except in a few cases. We have no indication of a ‘ring’ at 25′′, and instead of the 2 ‘rings’ at 40 and 46′′ we found only 1 located at a radial distance of . Our marginal detection at corresponds to an arc visible in Fig. 1 of Corradi et al. at position angle –, but not annotated as ‘ring’ by the authors.
The halo of NGC 3242 (catalog ) is obviously limb-brightened, as the wide bump around 80′′ indicates. These haloes are very common and are explained by hydrodynamical effects when a strong AGB wind interacts with slower, less dense matter expelled earlier during the aftermath of a helium shell flash (Schönberner & Steffen, 2002). Matter piles up into a denser shell which, once ionized, is resposible for the bright limb of the halo.
The overall slope of the halo brightness, however, is constant and can well be approximated by a power-law representaion, , with . With the reasonable assumption that in the halo all the oxygen is doubly ionized one can deduce the radial density profile of the halo as a power-law profile . Such a rather strong density decline with distance from the star is consistent with the rather large shell expansion velocity of 36 km s-1 and hints to strongly increasing mass loss towards the end of the AGB evolution (cf. Schönberner et al., 2005, Fig. 13 therein).
We determined the electron temperature, , from the [O iii] lines in the vicinity of the main body of the PN and at the outer edge of the halo, employing the low-density limit, using a value for the extinction of (Balick et al., 1993) and the extinction curve of Fluks et al. (1994). We found an apparent temperature gradient across the halo: close to the PN shell (, with 766 spaxels) we have K, and at the halo’s edge (, with 4547 spaxels), K. For comparison, we determined also the electron temperatures of the rim (i.e. the bright part of the PN) and the shell and found, as averages over spaxels, and K, resp., in good agreement with the determinations of Balick et al. (1993). Our error estimates are K for the halo and K for the PN.
The existence of hot haloes has already been reported in the past for NGC 6543 (catalog ), NGC 6826 (catalog ), and NGC 7662 (catalog ) (Middlemass et al., 1989, 1991), based on long-slit observations. The (mean) halo temperatures range from 13 000 K to 17 500 K, but temperature gradients have not been established. High temperatures in the halo can easily be set up by the rapid passage of an ionization front once the main PN becomes optically thin for ionizing photons (Marten, 1993). Due to the low densities, the halo matter is far from being in thermal equilibrium, and a positive radial temperature gradient will develop because the cooling rate depends on density squared. Judging from the existence of hot haloes around PNe with quite different evolutionary stages, the cooling times seem to be comparable with the nebular lifetime, an important constraint for hydrodynamic models.
5 Summary and Conclusions
IFS has shown to be capable of performing spatially resolved spectrophotometry down to sky-limited intensity levels. We have been able to find halo emission lines down to a detection limit of erg cm-2 s-1 arcsec-2, with positive detections of [O iii]5007,4959 Å, [O iii]4363 Å and H in the halo of NGC 3242 (catalog ). We confirmed the existence of the mysterious ‘rings’ and found, for the first time, an apparent electron temperature gradient across the halo which, if confirmed, poses a challenge for evolutionary models of planetary nebulae. Haloes are obviously not in thermal equilibrium, making a plasma analysis based on steady state photoionization models highly questionable. From the steep radial intensity profile of the halo it follows that the mass loss rate must have increased until the very end of the AGB evolution. No emission line is seen in the putative halo region of NGC 4361 (catalog ) down to the sensitivity limit. Owing to the low surface brightness of this PN, the expected halo is too faint to be detected with the present low-resolution observing mode.
References
- Balick et al. (1993) Balick, B., Rugers, M., Terzian, Y., & Chengalur, J. N. 1993, ApJ, 411, 778
- Balick et al. (2001) Balick, B., Wilson, J., & Hajian, A. R. 2001, AJ, 121, 354
- Becker (2002) Becker, T. 2002, Thesis, University of Potsdam
- Corradi et al. (2003) Corradi, R. L. M., Schönberner, D., Steffen, M., & Perinotto, M. 2003, MNRAS, 340, 417
- Corradi et al. (2004) Corradi, R. L. M., Sánchez-Blázquez, P., Mellema, G., Giammanco, C., & Schwarz, H. E. 2004, A&A, 417, 637
- Fluks et al. (1994) Fluks, M. A., Plez, B., The, P. S., de Winter, D., Westerlund, B. E., & Steenman, H. C. 1994, A&AS, 105, 311
- Marten (1993) Marten, H. 1993, A&A, 277, L9
- Mendez et al. (1992) Mendez, R. H., Kudritzki, R. P., & Herrero, A. 1992, A&A, 260, 329
- Middlemass et al. (1989) Middlemass, D., Clegg, R. E. S., & Walsh, J. R. 1989, MNRAS, 239, 1
- Middlemass et al. (1991) Middlemass, D., Clegg, R. E. S., Walsh, J. R., & Harrington, J. P. 1991, MNRAS, 251, 284
- Perinotto et al. (2004) Perinotto, M., Schönberner, D., Steffen, M., & Calonaci, C. 2004, A&A, 414, 993
- Roth et al. (2004) Roth, M. M., Schönberner, D., Steffen, M., & Becker, T. 2004, Astron. Nachr., Supplement, 325, 46
- Roth et al. (2005) Roth, M. M., et al. 2005, PASP, 117, 620
- Schönberner & Steffen (2002) Schönberner, D., & Steffen, M. 2002, Rev. Mex. Astron. Astrofis. Ser. Conf., 12, 144
- Schönberner et al. (2005) Schönberner, D., Jacob, R., Steffen, M., Perinotto, M., Corradi, R. L. M., & Acker, A. 2005, A&A, 431, 963
- Torres-Peimbert et al. (1990) Torres-Peimbert, S., Peimbert, M., & Pena, M. 1990, A&A, 233, 540
- Vink et al. (2001) Vink, J. S., de Koter, A., & Lamers, H. J. G. L. M. 2001, A&A, 369, 574