Spectroscopic classification of cataclysmic variable candidates ††thanks: Based on observations collected at the NOAO Cerro Tololo Interamerican Observatory, Chile and the European Southern Observatory, La Silla, Chile.
Abstract
We present low resolution optical spectroscopy for six cataclysmic variable candidates and the old nova V888 Cen. We confirm the classification as cataclysmic variable for LB 9963 and FQ Mon, while the other four candidates turn out to be different type of stars. We discuss the individual spectra and pay special attention to the mass transfer rate and disc temperature and density of the three cataclysmic variables.
1 Introduction
Cataclysmic Variables (CVs) are close, interacting binary systems, with a white dwarf primary receiving mass from a Roche–lobe–filling late–type star. In absence of strong magnetic fields, the mass transfer takes place via an accretion disc; otherwise the matter is channeled along the magnetic field lines directly onto the surface of the white dwarf (see Warner, 1995, for a thorough introduction to these objects).
The online edition of the CV catalog of Downes et al. (2001) contains many objects with uncertain classification. The majority of these do not have any published spectra, which are essential for a classification and for the confirmation of the CV nature of these objects.
| Object | RA2000 | DEC2000 | Telescope/Instrument | Date | [s] |
|---|---|---|---|---|---|
| FBS 0204-024 | 02:06:44.5 | -02:12:17 | CTIO1.5m/R-C | 2004-02-06 | |
| CTIO1.5m/R-C | 2004-02-09 | 1800 | |||
| LB 9963 | 02:50:24.6 | -87:30:23 | CTIO1.5m/R-C | 2004-02-06 | |
| ESO3.6m/EFOSC/Gr10 | 2004-03-16 | 600 | |||
| ESO3.6m/EFOSC/Gr7 | 2004-03-16 | 600 | |||
| WY CMa | 07:11:40.1 | -26:58:40 | CTIO1.5m/R-C | 2004-02-06 | |
| CTIO1.5m/R-C | 2004-02-09 | ||||
| FQ Mon | 07:16:41.2 | -06:56:49 | CTIO1.5m/R-C | 2004-02-06 | |
| ESO3.6m/EFOSC/Gr6 | 2004-03-16 | ||||
| ESO3.6m/EFOSC/Gr6 | 2004-04-31 | ||||
| ESO3.6m/EFOSC/Gr6 | 2004-11-14 | ||||
| ESO3.6m/EFOSC/Gr6 | 2004-11-19 | ||||
| FV Cnc | 08:48:01.8 | 18:40:37 | CTIO1.5m/R-C | 2004-02-09 | |
| V591 Cen | 12:42:18.1 | -33:34:10 | CTIO1.5m/R-C | 2004-02-06 | |
| V888 Cen | 13:02:31.9 | -60:11:36 | CTIO1.5m/R-C | 2004-02-07 | 1200 |
| CTIO1.5m/R-C | 2004-02-09 |
As part of the REU (Research Experiences for Undergraduates) observation campaign at CTIO (Cerro Tololo Inter-American Observatory) in February 2004, we have taken optical spectra of six CV–candidates with the purpose of classification. We here present the results on these stars. We also include the first optical spectrum of Nova 1995 Cen (V888 Cen) in quiescence.
2 Data and reduction
We observed the CV–candidates in low resolution with the R-C spectrograph at the 1.5 m telescope at CTIO. Some follow–up observations have been done with EFOSC at the 3.6m telescope of ESO, La Silla, see Table 1 for the details. The spectra were all taken with the spectrograph slit aligned with the parallactic angle. Standard reduction was performed for all data with IRAF. The bias were subtracted and the data were divided by a flat field, which was normalized by fitting Chebyshev functions of high order to remove the detector specific spectral response. For those objects where the observation had been divided in several exposures, the individual frames have been averaged. The spectra have been optimally extracted (Horne, 1986). Wavelength calibration yielded a final FWHM resolution of 1.5 nm and a spectral range of 370–970 nm for the CTIO data. The EFOSC spectra were taken with a slitwidth of 1.0”. For grism #6 this yields a FWHM resolution of 1.3 nm with a range of 390–800 nm, for grisms #7 and #10, we get a resolution of 0.6 nm and a range of 330-520 nm and 630-820 nm respectively. The CTIO spectra have been normalized by fitting splines to the continuum. The La Silla spectra have been corrected for the instrument curve using standard star observations. While the absolute flux values have to be regarded with caution, the relative fluxes can be used to compare different parts of the spectrum.
For LB 9963 we also performed time resolved V–photometry using the 90 cm telescope at CTIO. The reduction was done using the quadproc package in IRAF. The data have been corrected for overscan, bias and flatfields. Aperture photometry for LB 9963 and three reference stars was done with apphot inside IRAF.
All subsequent analysis of the data has been done using MIDAS.
3 Results

In Fig. 1, the normalized CTIO–spectra are plotted for all observed objects. In the following we will discuss these objects in detail.
3.1 FBS 0204-024
The background information on this object is rather unclear. In Downes et al. (2001) it is named Cet and given as a candidate CV. For the classification they refer to Abrahamyan et al. (2003) where the object has the catalog number FBS 0204-024. However, Abrahamyan et al. classified this object as a B2e star by prism spectroscopy without mentioning a possible CV classification. They identified the star in the catalog of Berger & Fringant (1980), possibly as object PB 6657, which is the closest coordinate match. Still, PB 6657 lies about 2.5 arcmin to the south and is 3 mag fainter than FBS 0204-024, so the identification seems rather doubtful. The finding chart provided by Downes et al. (2001) is established via coordinate match with FBS 0204-024.
The spectrum, that we show in Fig. 1, is taken of this object. It shows the object to be a late B-type star; best match of the absorption lines has been achieved with a B6-9V template. Note that we find no evidence for emission lines, in contrast to the classification by Abrahamyan et al. (2003). Since Be stars are known to also show phases without emission lines, we restrain ourselves from comments on the specific nature of this object.
3.2 LB 9963
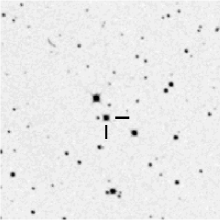
is indicated.

The object was first investigated by Kilkenny (1995). From Strömgren photometry he classified the object as a heavily reddened hot subdwarf: sdOr. He also presents a low resolution spectrum covering the range 3600–5000Å. Although very noisy, faint Balmer emission lines can be seen, which lead to the classification as a possible CV.
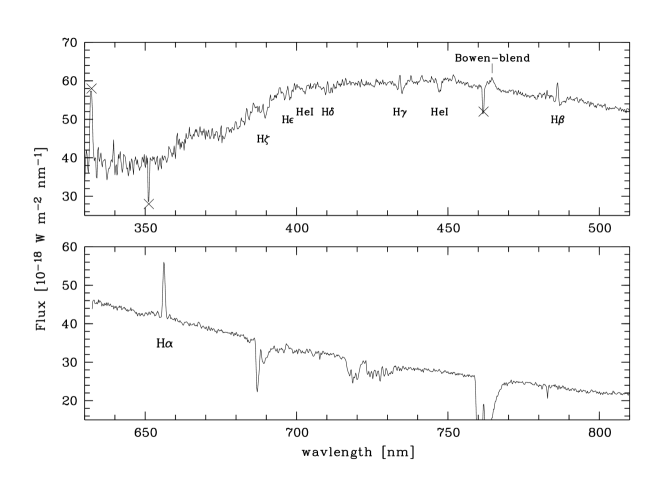
No candidate is given on the finding chart provided by Downes et al. (2001), where the object is called Oct. From private communication with Dave Kilkenny we identified the probable candidate at RA = 02:50:22, DEC = -87:30:23 (J2000) which we indicate in the chart in Fig. 2. The CTIO spectrum of this object (Fig. 1) shows faint and narrow H emission but no other Balmer emission lines. H is present in absorption with a slight hint of an emission core. The same is found for H and H, although the spectrum gets very noisy in this range. He I at 588 nm is found in absorption but blended with the Na doublet at 589 nm. No other He lines are found in this spectrum. Two emission features are found at 581 nm and 465 nm. They are probably due to the C IV doublet (580/1 nm) and the Bowen blend of N III, C III, and C IV at 465 nm. Similar features have been found in a few other CVs (for a summary, see Schmidtobreick et al., 2003), usually indicating a very high mass transfer rate and a probably evolved secondary.
The classification as a cataclysmic variable or at least a similar object is confirmed by a short photometric run. For observational details see section 2. The lightcurve is plotted in Fig. 3. A general decrease of brightness might be due to a periodical variation, which would then imply an orbital period of at least five hours. However, the more important variation is the observed flickering of the star which is a valuable evidence for the CV classification of LB 9963.
To verify the presence of emission cores in the Balmer absorption lines we performed follow–up observations with EFOSC2 at the 3.6m telescope at La Silla as described in section 2. The two spectra (one red, one blue) have been flux–calibrated with an accuracy of about 10% but not corrected for interstellar extinction. They are plotted in Fig. 4. In the red spectrum, H is clearly seen in emission. In the blue spectrum, emission cores are confirmed in the absorption troughs of H, H, H, and H. All the blue He I lines are found in absorption, and only a faint emission is found for He II at 468.6 nm. We find no indication of He I in the red spectrum. The strongest emission in the blue is found at 465 nm and can be associated with the N III, C III and C IV emission in the Bowen blend. From the properties of the emission lines, LB 9963 would thus be characterized as a novalike variable with high mass transfer and accordingly optical thick accretion disc of high temperature. Still, the absence or weakness of He II is puzzling.
Such a hot disc however, is supposed to have a strong blue continuum. The continuum of LB 9963, instead, shows a steep rise between 350 nm and 400 nm, which is not at all typical for a cataclysmic variable. We have examined our reduction process several times and cannot find any indication of it artificially producing this unusual continuum. The spectrum has been taken at a high airmass of 1.9 but under parallactic angle to minimize the effect of differential refraction. Furthermore, the spectrum of Kilkenny (1995) shows a similar behavior. We thus believe this continuum to be real.
Since we have only little information on the interstellar extinction, the cut towards the blue might be due to an exceptionally high interstellar reddening. Although we cannot rule out this possibility, we believe it rather unlikely as the galactic latitude of LB 9963 is and the average extinction in this area of the sky is with rather low (Drimmel et al., 2003). However, a thin dust filament is distinguished in the IRAS maps of this region and might enhance the local extinction of LB 9963. The higher resolved dust maps of Schlegel et al. (1998) e.g. yield a reddening . This value is supported by the equivalent width of the Na I absorption line. We find nm for Na I (D1 + D2) which converts to using the empirical relation discussed by Munari & Zwitter (1997). We used the equations of Howarth (1983) to deredden the spectra with either value. It does not improve the continuum shape significantly. In fact, a reddening as high as is needed to get a ”normal” novalike continuum.
Assuming that the disc and the white dwarf do not contribute a lot to the continuum, alternatively, a late F-type secondary could explain the shape of the continuum. One would then expect to also see the absorption lines of this star, which would thus naturally explain the presence of the Balmer absorption troughs without assuming a hot disc. However, this does not explain the He absorption, which is not present in F-type stars. Also, the Ca II–line at 393.4 nm, which is typically a clear indication for an F–type star, is not present in the spectrum. We thus rank this possibility of an F-type secondary very low.
On the balance, we think that, however unlikely, a highly reddened novalike variable matches the spectrum better than a CV with F-type star secondary.
3.3 WY Canis Majoris
WY CMa has been classified as a Cepheid by van Hoof (1941) who also gives the period of 1.14 days and a photographic amplitude of 0.45m. Subsequently, the star appears in several catalogs and investigations, e.g. Petit (1960b) or Petersen & Andreasen (1987). Hacke & Richert (1990) re-observed WY CMa photographically and found that the resulting lightcurve does not agree with the classification as a Cepheid and assume that the object is rather a long–period CV. Thus, the object has been included in the CV catalogs by Ritter & Kolb (1998) and Downes et al. (2001).
Our spectrum shows the object to be an early F–type star, probably a giant. Best matches of the absorption lines have been achieved with a F2III template. The absence of any CV features in the spectrum make its designation as such untenable. Further photometry, especially with a high-precision detector, might reopen the possibility of it being indeed a Cepheid or allow its assignment to a different category of variable.
3.4 FQ Monocerotis
| Feb 06 | Apr 30 | Nov 13 | Nov 18 | |||||||||
|---|---|---|---|---|---|---|---|---|---|---|---|---|
| fwhm | -W | F | fwhm | -W | F | fwhm | -W | F | fwhm | -W | F | |
| H | 3.2(2) | 3.1(3) | 3.0(3) | 2.9(1) | 0.5(1) | 0.7(1) | 2.9(2) | 0.5(1) | 0.9(2) | |||
| H | 4.0(1) | 4.5(2) | 8.9(4) | 3.8(3) | 0.5(1) | 0.8(1) | 3.1(1) | 1.0(1) | 1.6(1) | |||
| H | 3.1(2) | 5.9(4) | 12.4(9) | 3.0(3) | 1.2(2) | 1.3(2) | 2.4(1) | 2.3(1) | 3.1(1) | 1.7(3) | 0.4(1) | 0.6(1) |
| H | 3.1(3) | 1.5(2) | 1.5(2) | 2.0(1) | 2.3(2) | 3.0(2) | 1.5(1) | 0.7(1) | 1.1(1) | |||
| H | 1.6(1) | 2.6(1) | 2.9(1) | 1.7(1) | 0.8(1) | 1.0(1) | ||||||
| H | 1.7(1) | 2.9(1) | 2.6(1) | |||||||||
FQ Mon has first been mentioned as a variable star by Hoffmeister (1936) who discovered an outburst in January 1929. No further analysis of the system had been done. In March 2004, about three weeks after our observation, FQ Mon went into superoutburst with mag, thus showing it to be a SU UMa system (Uemura, 2004). The final superhump period has been determined as 1.634 h (Masi, 2004).
Our spectrum (Fig.1) confirms the CV-nature of FQ Mon. Although noisy, it is dominated by the Balmer lines in emission. Also the Paschen series and He I are detected in emission. The spectrum resembles thus a typical dwarf nova spectrum in quiescence, although the inverse Balmer decrement (see Tab. 2) points to a higher temperature or density of the accretion disc.
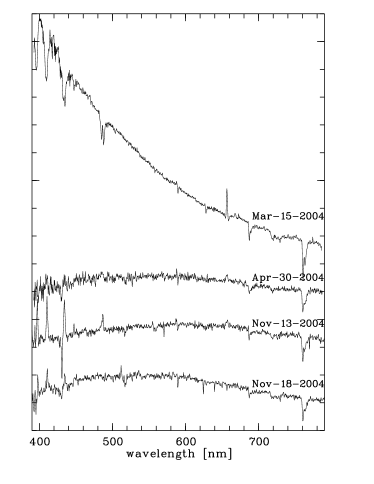
Follow–up observations have been done for this object on La Silla. The resulting four spectra are plotted in Fig. 5. The spectrum from March clearly confirms that FQ Mon was in outburst during this epoch. It is dominated by the very blue continuum and only faint emission peaks are present within absorption troughs. From the acquisition files we have estimated the brightness of FQ Mon by comparing it to the stars U0825–04435970, U0825–04433933, and U0825–04434176 from the USNO-A2.0 catalog. We find , , and for Mar 15, Apr 30, Nov 13, and Nov 18. We thus estimate the amplitude of the superoutburst to be of the order of 7 mag.
The spectra also show that FQ Mon is a highly variable object. Even the quiescence spectra are not alike but show variations of the continuum shape as well as of the strengths of the various emission lines (see Tab. 2). Note that there is a slightly brighter star very close to FQ Mon. We cannot completely rule out the possibility, that some contribution in the spectrum comes from this close companion and might produce an artificial variation. However, since the seeing always allowed us to separate the two stars and since we took special care to place the slit on FQ Mon itself, an additional contribution appears rather unlikely.
The emission lines are clearly resolved and yield projected rotational velocities of about 1500 km/s, thus indicating a high inclination system. Still, although broad, the lines show no double peak profile as should be expected for a high inclination dwarf nova. Furthermore, even in the spectrum with the strongest emission lines, H is rather weak, even weaker than in the spectrum taken during outburst, and the Balmer lines show a negative decrement. This is usually an indication for a magnetic system, so FQ Mon might thus belong to this category of CVs. Since the superoutburst clearly classifies it as a SU UMa system, the magnetic field can only be of mediocre strength. In this respect FQ Mon might be comparable to GZ Cnc, a dwarf nova at the lower edge of the period gap, which is supposed to be a magnetic system and also shows an inverse Balmer decrement, although less strong than is the case for FQ Mon (Tappert & Bianchini, 2003). Another similar system is VZ Pyx, also a SU UMa system which is at the same time a candidate intermediate polar. Again, a slightly inverse Balmer decrement is found in the spectrum (Remillard et al., 1994). Note that FQ Mon can be identified with the ROSAT source RXS J071641.6-065653, which could also indicate a magnetic nature.
3.5 FV Cancri
FV Cnc has been classified as a possible CV of U Gem subtype by Kazarovets et al. (1999) due to an intensity increase observed by Hipparcos. The object was known as member of the open cluster Praesepe on grounds of photometry and proper motion (Mermilliod et al. (1990); Jones & Stauffer (1991)). Mermilliod et al. also found that FV Cnc is a double–lined spectroscopic binary with an orbital period of 2.981781(7) days and a circular orbit. They present the velocity curves of both components and derive a mass ratio of 1.06.
Our spectrum shows the object to be a G-type star; best match of the absorption lines has been achieved with a G0-4 template. Due to the low resolution of our data, we cannot resolve the double–line character. The classification is confirmed by the published photometric colors. Mermilliod et al. measured (B-V) = 0.69 and (U-B) = 0.19, the colors of a G5V star, while (B-V) = 0.572 is given in the Tycho catalog, which thus favors a slightly earlier type.
The spectrum of FV Cnc is thus inconsistent with a CV designation, and shows it to be a close binary consisting of two early G-type stars. The brightness variation observed by HIPPARCOS remains to be explained. It could have its source in magnetic activity, or some external (third-body) cause.
3.6 V591 Centauri
The object has first been noted as a variable by Petit (1960a), who included it as a possible long period star in his catalog of U Gem like stars. However, in the supplements to this catalog (Petit, 1961), he marks the variability as irregular.
Our spectrum is rather noisy but resembles a normal G-type star spectrum. A best match is achieved for a G5-8V template. Hence, the variability is probably due to magnetic activity.
3.7 V888 Centauri
The nova V888 Cen was discovered by Liller on February 23, 1995 at a visual magnitude of 7.2 (Liller, 1995). Yan Tse et al. (2001) have analyzed the outburst spectra and the lightcurve. They found the nova to be very fast with = 5 days and to show strong oscillations in the transition region. The spectra were dominated by strong emission lines with P Cygni profiles yielding velocities of -1765 and -3010 km/s. The presence of Fe II emission lines puts the nova into the Fe II class of classical novae.
Our spectrum of V888 Cen taken nine years after outburst shows faint emission lines for H, H, H, as well as He II (469 nm) and the Bowen blend at 460 nm. The bluer Balmer lines are rather found in absorption. This indicates a hot, optically thick accretion disc, typical for novalikes. Since nine years is usually a sufficient time for a fast nova to cool down (Schmidtobreick et al., 2005), we thus conclude that the binary V888 Cen is a high accretion rate system.
4 Summary
We have discussed the spectroscopic classification for six candidate CVs. For two of them, LB 9963 and FQ Mon, the CV classification could be confirmed, while the spectra of the others match those of normal main sequence or evolved stars.
LB 9963 shows the typical emission lines embedded in absorption troughs, and is thus believed to be a high mass transfer system. Arguing against this interpretation is the lack of a blue continuum due to the disc. However, this might be affected by high interstellar extinction.
FQ Mon is strongly variable and has also been observed during outburst. However, the quiescence spectra show an inverse Balmer decrement, so we do not believe this system to be a normal dwarf nova but rather a magnetic system.
We also present the first spectrum of V888 Cen in quiescence. We find this old nova to be a high mass transfer system.
References
- Abrahamyan et al. (2003) Abrahamyan, G.V., Sinamyan, P.K., Gigoyan, K.S., 2003, Astrophysics, 46, 46
- Berger & Fringant (1980) Berger, J., Fringant, A.–M., 1980, A&AS, 39, 39
- Downes et al. (2001) Downes R.A., Webbink R.F., Shara M.M., Ritter H., Kolb U., Duerbeck H.W., 2001, PASP, 113, 764, living edition
- Drimmel et al. (2003) Drimmel R., Cabrera-Lavers A., López-Corredoira M., 2003, A&A, 409, 205
- Jones & Stauffer (1991) Jones, B.F., Stauffer, J.R., 1991, AJ, 102, 1080
- Hacke & Richert (1990) Hacke, G., Richert, M., 1990, Veröff. d. Sternw. Sonnneberg, 10, 336
- Hoffmeister (1936) Hoffmeister, C., 1936, Astron. Nach., 259, 37
- van Hoof (1941) van Hoof, A., 1941, Ciel et Terre, 57, 321
- Horne (1986) Horne, K. 1986, PASP, 98, 609
- Howarth (1983) Howarth, I.D., 1983, MNRAS, 203, 301
- Kazarovets et al. (1999) Kazarovets, A.V., Samus, N.N., Durlevich, O.V., Frolov, M.S., Antipin, S.V. Kireeva, N.N., Pastukhova, E.N., 1999, IBVS, 4659
- Kilkenny (1995) Kilkenny, D., 1995, MNRAS, 277, 920
- Liller (1995) Liller, W., 1995, IAU Circ., 6139
- Masi (2004) Masi, G., 2004, vsnet-superoutburst, 2297
- Mermilliod et al. (1990) Mermilliod, J.-C., Weis, E.W., Duquennoy, A., Mayor, M., 1990, A&A, 235, 114
- Munari & Zwitter (1997) Munari, U., Zwitter, T, 1997, A&A, 318, 269
- Petit (1960a) Petit, M., 1960a, AnAp, 23, 681
- Petit (1960b) Petit, M., 1960b, Journ. Obs., 43, 17
- Petit (1961) Petit, M., 1961, Journ. Obs., 44, 6
- Petersen & Andreasen (1987) Petersen, J.O., Andreasen, G.K., 1987, A&A, 176, 183
- Remillard et al. (1994) Remillard, R.A., Bradt, H.V., Brissenden, R.J.V., Buckley, D.A.H., Schwartz, D.A., Silber, A., Stroozas, B.A., Tuohy, I.R., 1994, A&A, 428, 785
- Ritter & Kolb (1998) Ritter, H., Kolb, U., 1998, A&AS, 129, 83
- Schlegel et al. (1998) Schlegel, D., Finkbeiner, D., Davis, M., 1998, ApJ, 500, 525
- Schmidtobreick et al. (2003) Schmidtobreick, L., Tappert, C., Bianchini, A., Mennickent, R.E., 2003, A&A, 410, 943
- Schmidtobreick et al. (2005) Schmidtobreick, L., Tappert, C., Bianchini, A., Mennickent, R.E., 2005, A&A, 432, 199
- Tappert & Bianchini (2003) Tappert, C., Bianchini, A., 2003, A&A, 401, 1101
- Uemura (2004) Uemura, M., 2004, VSNET Weekly Campaign Summary, 1435
- Warner (1995) Warner, B., 1995, Cataclysmic Variable Stars, Cambridge University Press
- Yan Tse et al. (2001) Yan Tse, J., Hearnshaw, J.B., Rosenzweig, P., Guzman, E., Escalona, O., Gilmore, A.C., Kilmartin, P.M., Watson, L.C., 2001, MNRAS, 324, 553