A sample of radio-loud AGN in the Sloan Digital Sky Survey
Abstract
A sample of 2712 radio–luminous galaxies is defined from the second data release of the Sloan Digital Sky Survey (SDSS) by cross–comparing the main spectroscopic galaxy sample with two radio surveys: the NRAO VLA Sky Survey (NVSS) and the Faint Images of the Radio Sky at Twenty centimetres (FIRST) survey. The comparison is carried out in a multi–stage process and makes optimal use of both radio surveys by exploiting the sensitivity of the NVSS to extended and multi–component radio sources in addition to the high angular resolution of the FIRST images. A radio source sample with 95% completeness and 98.9% reliability is achieved, far better than would be possible for this sample if only one of the surveys was used. The radio source sample is then divided into two classes: radio–loud AGN and galaxies in which the radio emission is dominated by star formation. The division is based on the location of a galaxy in the plane of 4000Å break strength versus radio luminosity per unit stellar mass and provides a sample of 2215 radio–loud AGN and 497 star forming galaxies brighter than 5 mJy at 1.4 GHz. A full catalogue of positions and radio properties is provided for these sources. The local radio luminosity function is then derived both for radio–loud AGN and for star-forming galaxies and is found to be in agreement with previous studies. By using the radio to far-IR correlation, the radio luminosity function of star forming galaxies is also compared to the luminosity function derived in the far–infrared. It is found to agree well at high luminosities but less so at lower luminosities, confirming that the linearity of the radio to far-IR correlation breaks down below about W Hz-1 at 1.4 GHz.
keywords:
galaxies: active — galaxies: evolution — galaxies: luminosity function — galaxies: starburst — radio continuum: galaxies — surveys1 Introduction
In recent years, new radio surveys such as the National Radio Astronomy Observatory (NRAO) Very Large Array (VLA) Sky Survey (NVSS; Condon et al. 1998) and the Faint Images of the Radio Sky at Twenty centimetres (FIRST) survey [Becker et al. 1995] have covered substantial fractions of the sky down to milli-Jansky flux densities, at vastly higher angular resolution than their predecessors. Such radio surveys are dramatically advancing our understanding of extragalactic radio sources, by permitting detailed statistical studies to be carried out. In order to reap the full benefit of these surveys, it is necessary to optically identify the radio sources, so as to obtain spectroscopic redshifts and determine the properties of their host galaxies. The availability of new large galaxy redshift surveys, especially the 2-degree Field Galaxy Redshift Survey (2dFGRS; Colless et al. 2001) and the Sloan Digital Sky Survey (SDSS; York et al. 2000; Stoughton et al. 2002), means that optical identifications and redshifts are available for large samples of nearby radio sources and allows comprehensive statistical analyses of their host galaxy properties to be carried out.
Automated cross–correlation of surveys across different wavelength regimes has a long history in astronomy. It is important that this process should maximize both the completeness and the reliability of the resulting sample, so considerable care needs to be taken in choosing the parameters that determine whether objects in different catalogues are indeed associated. In the case of optical identification of radio sources, the choice of radio survey is important. This is because many radio sources are extended, with sizes from a few arcsec up to tens of arcmins, and in high angular resolution surveys different components of the same source may be resolved into distinct sources. Surveys at lower angular resolution detect most sources as single components, and also have good sensitivity to extended radio structures, but the high surface density of possible optical counterparts (over 4000 per square degree at high Galactic latitudes in the Palomar Observatory Sky Survey) limits the reliability of the optical matching.
The first radio sky surveys were carried out at very low angular resolution and detected only the brightest radio sources. The resolution of these surveys was too low to allow identification of the host galaxies without detailed radio follow-up observations of the detected sources; this was time-consuming and meant that only small samples of galaxies could be studied (see discussion in McMahon et al. 2002). The NVSS was the first radio survey of sufficiently high angular resolution (45 arcsec) to permit automated cross–correlation with optical surveys. Machalski & Condon [Machalski & Condon 1999] cross–correlated the NVSS with the Las Campanas Redshift Survey (LCRS; Shectman et al. 1996), identifying 1157 radio–emitting galaxies. Machalski & Godlowski [Machalski & Godlowski 2000] used this sample to derive the local radio luminosity function. Using far–infrared data available for the LCRS they were also able to separate the luminosity function into a radio–loud active galactic nuclei (AGN) component, which dominates at high radio luminosities, and a lower-luminosity component due to star–forming galaxies that emit in the radio predominantly due to the synchrotron emission from supernova remnants. Similarly, Sadler et al. [Sadler et al. 2002] cross-correlated the NVSS with galaxies from the first data release of the 2dFGRS, defining a sample of 912 radio sources which form a basis for further detailed studies (e.g. Best 2004).
The 45 arcsec resolution of the NVSS has the advantage of being sufficiently large that % of radio sources are contained within a single NVSS component. With the exception of a few very large sources, the NVSS is also able to detect the entirety of the radio emission. However, the poor angular resolution of the NVSS leads to significant uncertainties in cross-identifying the radio sources with their optical host galaxies and there is a trade-off between the reliability of the matched sample and its completeness. Sadler et al. [Sadler et al. 2002] accepted radio sources within a matching radius of 10 arcseconds from an optical galaxy, leading to a catalogue that was % complete, but in which 5–10% of the matches are expected to be false identifications.
Samples with much higher reliability can be derived using the FIRST catalogue, due to its superior angular resolution ( arcsec). Ivezić et al. [Ivezić et al. 2002] cross–correlated the FIRST survey with the SDSS imaging sample. Under the assumption that all true identifications of point radio sources would have radio–optical positional offsets of less than 3 arcsec, they concluded that the optimal matching radius for cross–correlation was 1.5 arcsec, for which they derived a completeness for radio point sources of 85% and a contamination rate of only 3%.
However, at the high angular resolution of FIRST, new problems arise. FIRST is not sensitive to extended radio structures because of a lack of short antennae baselines, and resolves out the extended emission of radio sources. As a result, the total radio luminosity of sources that are larger than a few arcseconds will be systematically low (cf. Becker et al. 1995). In extreme cases, some larger radio sources are missed. These effects introduce systematic biases into the derived radio source sample. In addition, many extended radio sources are split into multiple components by FIRST. Matching routines therefore need to be developed to account for the possible multi-component nature of radio sources.
The first attempt to automate such a routine was by Magliocchetti et al. [Magliocchetti et al. 1998], who used a ‘collapsing algorithm’ to identify multi–component FIRST sources. They considered all pairs of sources with separations below 3 arcmins, and merged into a single combined source all pairs with separations below arcsec and flux densities within a factor of four of each other. This method is simple and works well for classical double–lobed radio sources, but accounts poorly for core–jet sources or sources with large asymmetries.
Ivezić et al. [Ivezić et al. 2002] improved on this by first cross-correlating all FIRST sources with the SDSS (thereby picking up all sources with a core component) and then adding candidate double–lobed radio sources to this sample. These were identified by comparing the mid-points of all FIRST pairs with separations below 90 arcsec with the galaxies in the optical catalogue, and accepting all matches with offsets below 3 arcsec. They estimated that such double sources contribute less than 10% of all radio sources.
McMahon et al. [McMahon et al. 2002] carried out a detailed study of the properties of multi–component FIRST sources by comparing isolated pairs of FIRST sources with optical Automated Plate Measuring Machine (APM) scans of the Palomar Observatory Sky Survey (POSS) plates. For core–jet type sources, where the optical counterpart is associated with one of the radio components, they found that the radio components usually have very different flux densities and that the component with the optical counterpart is usually brighter and is frequently unresolved in the radio. In contrast, if the optical counterpart is located between the two radio components, the two radio components usually have comparable flux densities and similar radio sizes (ie. both are consistent with being radio lobes, not one unresolved core and an extended radio lobe). In this case, the optically identified galaxy is typically located fairly close to the flux-weighted mean position of the two radio components. This information is extremely useful in the identification of multi–component FIRST sources.
Because the main spectroscopic galaxy sample of the SDSS has rather low median redshift (), the problems described above associated with identifying extended radio sources will be more severe. This paper thus presents a hybrid method, using information from both NVSS and FIRST in order to take advantage of the strong points of both surveys and avoid the systematic errors that arise in using only one of them. The layout of the paper is as follows. In Section 2, the salient points of the SDSS, NVSS and FIRST surveys are summarised. Section 3 then discusses the cross-matching of these surveys to identify the radio source sample. Section 4 describes how true radio-loud AGN are separated from sources where the radio emission is associated with star formation activity. The local radio luminosity functions of radio-loud AGN and star–forming galaxies are derived in Section 5, and the radio luminosity function of star–forming galaxies is compared to that derived at far-infrared wavelengths. Conclusions are drawn in Section 6. In an accompanying paper [Best et al. 2005] the host galaxies of the radio–loud AGN are investigated in detail. Throughout the paper, the values adopted for the cosmological parameters are , , and km s-1Mpc-1.
2 The radio and optical galaxy samples
2.1 The SDSS Spectroscopic Sample
The Sloan Digital Sky Survey (York et al. 2000; Stoughton et al. 2002, and references therein) is an optical imaging (u,g,r,i,z bands) and spectroscopic survey of about a quarter of the extragalactic sky, being carried out at the Apache Point Observatory. The spectroscopic sample considered in this paper is a sample of about 212,000 objects with magnitudes , spectroscopically confirmed to be galaxies, drawn from the ‘main galaxy catalogue’ of the second data release (DR2) of the SDSS. This sample of galaxies is described by Brinchmann et al. [Brinchmann et al. 2004a]. The galaxies have a median redshift of .
The SDSS spectra cover an observed wavelength range of 3800 to 9200Å, at an instrumental velocity resolution of about 65km s-1. The spectra are obtained through 3-arcsec diameter fibres, which corresponds to 5.7 kpc at a redshift of 0.1; at this redshift the spectra therefore represent a large proportion (up to 50%) of the total galaxy light, while for the very lowest redshift objects they are more dominated by the nuclear emission.
As described in Brinchmann et al. [Brinchmann et al. 2004a], a variety of physical parameters for these galaxies have been derived from the photometric and spectroscopic data, and catalogues of these parameters are publically available. These include total stellar masses, mass-to-light ratios, 4000Å break strengths, H absorption measurements and estimates of dust attenuation [Kauffmann et al. 2003a, Kauffmann et al. 2003b]; accurate emission line fluxes, after subtraction of the modelled stellar continuum to account for underlying stellar absorption features (Kauffmann et al. 2003c, Tremonti et al. in preparation); galaxy metallicities [Tremonti et al. 2004]; parameters measuring optical AGN activity, such as emission line ratios, and galaxy velocity dispersions (hence black hole mass estimates; Kauffmann et al. 2003c, Heckman et al. 2004). These parameters have been adopted for the analyses of this paper: the reader is referred to the papers referenced above for detailed information about the methods used to derive them.
It should be emphasised that the use of the SDSS main galaxy catalogue as the basis sample for this study means that objects classified as ‘quasars’ by the automated SDSS classification pipeline (Schlegel et al. in preparation) are excluded. These objects are excluded because of the influence of the direct non–stellar continuum light from the active nucleus. This affects the observed optical magnitudes, preventing clean magnitude–limited samples from being derived, and prohibits the host galaxy parameters discussed above from being accurately determined. The number of AGN excluded in this way is very small (% out to 111A search of the SDSS DR2 database reveals only 393 objects classified as ‘quasars’ in the redshift range , compared to 16661 objects classified as emission–line AGN by Kauffmann et al. [Kauffmann et al. 2003c].), since this exclusion only applies to the most luminous Type-I AGN: the SDSS pipeline classifies most low luminosity Type-I AGN as ‘galaxies’ rather than ‘quasars’, and so they are retained. Kauffmann et al. [Kauffmann et al. 2003c] estimate that 8% of AGN in the main galaxy sample have broad emission lines, and therefore are strictly Type-Is. They also demonstrate that for these low luminosity objects the non-stellar continuum light has a negligible effect on the physical parameters derived for the host galaxy.
2.2 The NVSS and FIRST Radio Surveys
The NVSS [Condon et al. 1998] and FIRST [Becker et al. 1995] surveys are two radio surveys that have been carried out in recent years using the VLA radio synthesis telescope at a frequency of 1.4 GHz. The NVSS was observed with the array in D-configuration (DnC configuration for the most southerly fields), which provides an angular resolution of 45 arcseconds. This survey covers the entirety of the sky north of declination, down to a limiting point source flux density of about 2.5 mJy. The FIRST observations were carried out in B-array configuration, which provides a much higher angular resolution of arcsec. This survey was designed to study the region of sky that will be observed by the SDSS, and therefore overlaps with this very closely. It reaches a limiting flux density of about 1 mJy for point sources.
3 Cross-matching of the SDSS spectroscopic sample using a combination of NVSS and FIRST
The FIRST and NVSS surveys are highly complementary for identifying radio sources associated with nearby galaxies; NVSS provides the sensitivity to large–scale radio structures required to detect all of the emission from extended radio sources, while FIRST provides the high angular resolution required to reliably identify the host galaxy. In order to identify radio sources associated with galaxies in the SDSS spectroscopic sample, a hybrid method using both radio surveys has been derived. A broad overview of the steps in this process is as follows:
1. SDSS galaxies lying outside the sky coverage of the FIRST survey were excluded. Galaxies close to very bright radio sources were also excluded, because the noise of the NVSS images is much greater in these regions. Finally, galaxies with redshifts below 0.01 were excluded, because at these low redshifts the galaxies are very extended and their optical positions are consequently uncertain.
2. The remaining sample was cross–correlated with the NVSS catalogue. A list of candidate galaxies that might be associated with multi-NVSS-component radio sources was derived.
3. These multi–NVSS–component candidates were investigated; by necessity, a small proportion of this analysis had to be done visually rather than through automated procedures. If a galaxy was confirmed to be associated with a multi–NVSS–component source, the integrated flux densities of the NVSS components were summed to provide the radio source flux density.
4. All galaxies matched with a single NVSS source were then cross–correlated with the FIRST catalogue. Note, however, that the presence of a FIRST counterpart was not required for a source to be accepted. If there was no FIRST counterpart, then the source was accepted or rejected solely upon its NVSS properties.
5. If a single FIRST counterpart was associated with the NVSS source, then the source was accepted or rejected on the basis of the properties of the FIRST counterpart. For accepted matches, however, the adopted radio flux density was taken from the NVSS data.
6. If multiple FIRST components were associated with the NVSS source, then the source was accepted if it satisfied criteria for a single-component source (with unrelated additional FIRST sources) or for a radio source with multiple FIRST components. Again, the NVSS catalogue was used to provide the most accurate measure of the radio flux density.
The exact criteria for accepting and rejecting matches in the procedures outlined above were tested and refined using Monte–Carlo simulations. Ten catalogues of random sky locations were constructed, over the same sky area as the SDSS survey. Each catalogue contained the same number as positions as the list of SDSS galaxies, and these random catalogues were taken through exactly the same steps of cross–comparison with the radio data as the SDSS galaxy catalogue. In the subsections that follow, the resulting optimal selection criteria are described, together with the completeness and reliability estimates provided by the Monte–Carlo simulations.
Note that the flux densities adopted for the NVSS sources are true integrated flux densities, rather than the peak flux densities quoted in the NVSS catalogues. The formulae for conversion of peak flux densities to integrated flux densities are provided by Condon et al. [Condon et al. 1998]. Only those radio sources with total flux densities (after summing NVSS components if necessary) above 5 mJy are retained. This flux density limit corresponds to approximately 10 times the noise level of the NVSS maps, and is adopted because: (i) at this significance level, all sources should be real and have well–determined positions; (ii) at this flux density limit, the sample is as sensitive to extended single–component NVSS sources (which will have a lower peak flux density) as it is to point sources, and the sensitivity to multi–component NVSS sources will not be significantly worse (for example, a 5 mJy source composed of two individual components of 2.5 mJy would be found). The 5 mJy limit corresponds to about W Hz-1 at redshift , which is approximately where the radio luminosity function switches from being dominated by star forming galaxies (low luminosities) to being dominated by AGN (high luminosities).

3.1 Identification of multi-component NVSS sources
In order to search for possible multi-component NVSS sources, a search was made for multiple sources within a radius of 3 arcmins from each optical galaxy. This distance was selected to be large enough that any genuine multi-component radio source should have at least two matches, but still much smaller than the typical separation of NVSS sources (8-10 arcmins).
Candidate NVSS doubles. For galaxies with two NVSS matches within 3 arcmins, the top panels of Fig 1 compare the offsets of the two NVSS matches from the optical position for SDSS galaxies (left) and for an equivalent number of random positions (right). There are a large number of SDSS galaxies for which the nearer NVSS component lies within 15 arcsec of the optical galaxy; these are predominantly galaxies containing a single–component NVSS source and the other NVSS source is physically unrelated. Such sources were classified as single–component matches (see below).
In addition to these, there is a clear excess of SDSS galaxies (compared to random) that have the two NVSS components each offset by 20-50 arcsec from the optical position. For these systems, the flux-weighted mean position of the two NVSS sources is often within 15 arcsec of the optical galaxy (indicated by the diamonds in the upper panel of Fig 1). Candidate NVSS doubles are therefore selected to be sources with both NVSS components closer than 90 arcsec, a flux-weighted mean position closer than 15 arcsec, and the nearer component offset by more than whichever is smaller out of 15 arcsec and the offset of the second source minus 20 arcsec. These selection criteria are indicated by the lines on Fig 1. The 90 arcsec limit is chosen since larger offsets are relatively unlikely and the contamination by random galaxies gets increasingly large beyond this. Even with this limit, there is still significant contamination, but the next step of comparison with FIRST helps to alleviate much of this.

All of these candidate doubles were cross-correlated with the FIRST catalogue. If these are true extended doubles then they may have a central FIRST component associated with a radio source core, and in addition they are likely to be missing flux in the FIRST data due to their extended nature; indeed they may well be undetected by FIRST. If they are not true doubles, but two individual NVSS sources, then it is likely that a single or double FIRST counterpart is present at each NVSS location, with little missing flux. The candidate doubles were thus classified into three categories:
(a) accepted doubles: sources were accepted as NVSS doubles if they either have a FIRST source within 3 arcsec of the optical position, or they satisfy the following three conditions (i) no detected FIRST component (ie. all of the flux is resolved out by FIRST); (ii) both NVSS components lie within 60 arcsec of the SDSS position (larger sources may have additional NVSS components outside of the 3 arcmin limit, and so need to be checked visually); and (iii) the angle NVSS1-SDSS-NVSS2 greater than 135 degrees (ie. consistent with a double radio source with a bend of degrees).
(b) rejected doubles: those sources with 3 or fewer FIRST components, all further than 15 arcsec from the optical galaxy, and with total flux greater than half of the sum of the two NVSS fluxes, were rejected.
(c) uncertain cases: any sources not satisfying either of the above conditions were classified as uncertain, and referred for visual analysis.
The lower two plots of Figure 1 show the results of this classification of candidate doubles for the SDSS sources and an equivalent number of random positions.
Candidate NVSS triples. Galaxies with 3 NVSS components within 3 arcmins could represent one of four possibilities: (i) a triple radio source associated with the galaxy; (ii) a double radio source associated with the galaxy, together with an unassociated NVSS source; (iii) a single radio source, with two unassociated sources (or an unassociated double source); (iv) 3 unassociated NVSS sources. It is the first two possibilities that are the concern for the multiple–source analysis.
Comparison between the SDSS galaxies and the random positions (Fig 2) suggests that a source should be classified as a potential triple if all three components are within 120 arcsec, and one of the following three conditions is also satisfied: (i) the flux weighted mean position of all three components is within 15 arcsec of the optical galaxy position; (ii) the flux weighted mean position of the two more distant components is within 15 arcsec of the optical galaxy position [this for the case where these are the two outer lobes of a radio source, and the nearest component is a feature in the jet of one of the sources]; (iii) the nearest component is within 15 arcsec of the optical galaxy, with the second and third components both within 90 arcsec and the angle NVSS2-NVSS1-NVSS3 greater than 135 degrees [this is the case where the nearest component corresponds to the core of the triple: the offset and angle classification requirements distinguish this from a single component source with two unassociated sources].
Galaxies which satisfied these constraints were investigated using FIRST to accept or reject obvious cases. Galaxies were accepted as triples if they possessed a FIRST source within 3 arcsec of the optical galaxy position. They were rejected if, as for the doubles, they had 3 or fewer FIRST components, all further than 15 arcsec from the optical galaxy, with total flux equal to at least half of the sum of the three NVSS fluxes. The remainder of the galaxies were referred to visual analysis. Figure 2 compares the results of this analysis for the SDSS galaxies and the random sample.
Galaxies that were neither classified as triples nor visually inspected were then investigated to see if they were associated with a double radio source. Each of the three NVSS pairs was checked using the double source analysis described above.
Candidates with 4 or more NVSS matches. Galaxies with 4 or more NVSS sources within 3 arcminutes of the galaxy are likely either to be the host galaxy of a multiple-component radio source, or to lie close to one. No such cases were accepted without visual analysis. Visual analysis was carried out on all galaxies with 5 or more NVSS matches, as well as on galaxies with 4 NVSS matches where either the mean position or the flux-weighted mean position of the 4 NVSS sources was within 30 arcsec of the optical galaxy. All other galaxies were not considered to be quadrupoles, but were examined for potential triples and doubles using the criteria described above.
Overall, as a result of the multiple source analysis, 60 SDSS galaxies were accepted as NVSS multiple-component sources, compared to only 0.3 multiple-component sources predicted from the Monte–Carlo simulations using random positions. This corresponds to less than 1% contamination. A further 277 sources (0.13% of the original sample) required visual analysis, of which 109 were ultimately accepted as genuine sources. This total of 169 accepted multi–NVSS–component sources corresponds to about 6% of the entire SDSS radio source sample.

3.2 Single-component NVSS matches
For all galaxies not classified as multiple NVSS sources, Figure 3 compares the distribution of offsets between SDSS galaxies and their nearest NVSS source with the result obtained for random positions. There is a clear excess of sources associated with SDSS galaxies at small radii. Because multiple sources have been removed and the analysis is restricted to brighter sources with well-defined positions, true sources with offsets larger than about 15 arcsec are not expected, but the excess is significant out to at least 100 arcsec. At these large radii the excess is not due to true associations, but rather is the result of the clustering of optical galaxies: on average there are more galaxies within arcsec of an optical galaxy than within the same distance of a random position, and hence there is an increased chance of finding an unassociated radio source. Note that in principle this effect could be accounted for by incorporating an appropriate correlation function into the positions of objects in the random catalogues; however, full knowledge of the environments of radio source hosts would be required to do this properly.
Integrating under the two curves of Figure 3 out to a separation of 15 arcsec gives 2973 matches for the SDSS galaxies and 311 random matches, so the NVSS data alone would suffer from % contamination if a 15 arcsec separation were adopted. This falls to % contamination at 10 arcsec, but at a cost of reducing the completeness by 10%. The completeness can be improved by including information from the FIRST data. All SDSS galaxies with a single-component NVSS match within 30 arcsec are thus cross-correlated with the FIRST catalogue to determine the number of FIRST components within the 30 arcsec radius.


3.2.1 Sources with no FIRST matches
These sources are either variable radio-loud AGN which have faded between the NVSS and FIRST observations or they are extended radio sources which are resolved out of the FIRST dataset. In either case they should be retained if they are associated with the optical galaxy. These NVSS sources are accepted as matches if they lie within 10 arcsec of the optical position. 134 sources are retained in this way (compared to 8.7 random); this corresponds to approximately 5% of the total radio source sample.
3.2.2 Sources with one FIRST match
For cases with one FIRST source within 30 arcsec, Figure 4 compares the distribution of separations of the FIRST source and the SDSS galaxy with the result obtained for the random catalogue. An excess of FIRST sources with respect to random is seen at all separations; at large separations this is the result of the clustering of optical galaxies, as discussed above. The excess becomes particularly pronounced at separations less than 10 arcsec, but at separations larger than arcsec the contamination of random sources is high. Within 3 arcsec separation, however, the fraction of false identifications is very low, %. This is lower than has been previously derived for simple SDSS–FIRST comparisons (e.g. Ivezić et al. 2002, who found a random contamination of about 9% at 3 arcsec radius). This is because the present analysis is limited to galaxies with NVSS counterparts brighter than 5 mJy.
Given the low contamination rate, all FIRST radio sources with offsets below 3 arcsec can clearly be accepted as matches. If all sources between 3 and 10 arcsec were dropped, however, then the completeness would suffer. Figure 5 compares the offset of the FIRST sources against their projected size along the offset direction, i.e. the product of the deconvolved major axis length and the cosine of the angle between the major axis and the offset vector. A significant fraction of the FIRST sources with offsets between 3 and 10 arcsec are found to be extended sources oriented close to the direction of the offset between the optical and radio position. Only a few of the random positions are associated with radio sources with these properties. The selection procedure was therefore refined to accept those FIRST sources which are either (i) within 3 arcsec, or (ii) offset less than 10 arcsec, oriented within 30 degrees of the offset vector, and offset by less than 75% of the projected major axis length of the source. These selection criteria are illustrated on Figure 5. The addition of the 3–10 arcsec offset sources significantly reduces the incompleteness of the sample for only a small decrease in the reliability.


3.2.3 Sources with two FIRST matches
For galaxies with two FIRST matches, if the closer of the two matches is within 3 arcsec then the source is accepted under the assumption that it is either a single component source with a nearby unassociated source, or the core of a core-jet source. There are 251 such SDSS galaxies (5.3 random). If neither FIRST source is within 3 arcsec, then it is possible that the two FIRST components are two lobes of the same extended radio source with no core. As discussed earlier, McMahon et al. [McMahon et al. 2002] found that in this case the two FIRST sources often have the following properties: (i) they have comparable flux densities; (ii) the flux-weighted mean position of the two sources is close to that of the optical galaxy; (iii) the sizes of the two sources are comparable (ie. both are lobes, not a core and a lobe). None of these conditions on their own is sufficient to classify the source as a double without including a lot of false detections, but the Monte–Carlo simulations show that the combination of the three can be quite powerful. Galaxies with two FIRST matches were accepted as double radio sources if the ratio of the radio source sizes, multiplied by the ratio of the radio source flux densities, multiplied by the offset in arcsec of the flux–weighted mean position, is less than 5. Figure 6 shows the result of this analysis: 116 double sources are selected among SDSS galaxies, but only 1.2 for random positions, implying that the reliability is about 99%.
It should be noted here that in cases where the galaxy is associated with a single FIRST component, and the other component (or components, for the cases with 3 or more matches discussed below) is genuinely unassociated, the NVSS flux will overestimate the radio luminosity due to the contaminating source. However, only in very rare cases (ie. a faint point source lying nearby a much brighter source) would such a correction be significant and these cases could not reliably be separated from core–jet type sources without visual analysis.
3.2.4 Sources with three FIRST matches
Galaxies for which there are three FIRST matches within 30 arcsec are accepted if any of the following three conditions are satisfied: (i) the nearest match is within 3 arcsec; (ii) any of the three pairs of sources satisfies the criteria to be accepted as a FIRST double source; (iii) the flux-weighted mean position of all three sources is within 3 arcsec of the optical galaxy position, with the angle subtended by the outer two sources relative to the middle one larger than 135 degrees (ie. the source looks like a straight(ish) triple source). Figure 7 shows the results of this selection.
3.2.5 Sources with four or more FIRST matches
Automated classification of more than three sources cannot be carried out in an efficient and reliable way. For galaxies with four or more matches, the nearest three matches are analysed using the criteria for three-source matches to test whether they may be classified as triples, doubles or singles. All galaxies not accepted in this way are sent for visual analysis (a total of 23 optical galaxies or % of the SDSS sample).
3.3 Repeated matches
The final list of matches was examined to ensure that two different SDSS galaxies were not associated with the same NVSS source. This occurred on 24 occasions and these cases were all examined visually. In two cases, two SDSS galaxies were associated with the same NVSS source and there was no FIRST counterpart. In a further 14 cases, two SDSS galaxies were associated with the same NVSS source which had a single FIRST counterpart which lay close enough to both galaxies. For these 16 objects, the nearer galaxy was accepted as the true match and the other galaxy was removed from the radio source catalogue. There were a further 8 cases where it was found that two galaxies matched the same NVSS source but had distinct FIRST counterparts. In other words, both galaxies were genuine radio sources, but at the lower resolution of NVSS they had been convolved together. In these cases the flux density of the NVSS source was divided between the two galaxies according to the ratio of their integrated FIRST flux densities. If the galaxies still remained above the 5 mJy flux density limit, they were retained in the radio source catalogue.
| Source type | SDSS gals | Random | |
|---|---|---|---|
| NVSS multiples | Accepted directly | 60 | 0.3 |
| NVSS multiples | Visual analysis | (277) | (92.1) |
| of which confirmed | 109 | ||
| NVSS singles | 0 FIRST matches | 134 | 8.7 |
| 1 FIRST match | 1805 | 12.3 | |
| 2 FIRST matches | 367 | 6.5 | |
| 3 FIRST matches | 163 | 1.4 | |
| 4+, confirmed | 57 | 0.9 | |
| 4+, visual analysis | (23) | (4.5) | |
| of which confirmed | 17 | ||
| Total | Confirmed | 2712 | 30.1 |
3.4 Completeness and Reliability of the matching procedure
The results of the cross-matching procedure are provided in Table 1. This table gives the number of SDSS galaxies accepted as radio sources compared to the number of cases accepted from the same number of random positions, for each different radio source type. It therefore provides a direct measure of the reliability of each of the criteria defined above. Overall, assuming visual analysis to be 100% reliable, only 30.1 false identifications are expected amongst the final sample of 2712 radio sources. This corresponds to an overall reliability of 98.9%. The most unreliable part of the sample selection is for NVSS sources without a FIRST counterpart. Of these, 6% will be false identifications. This is unavoidable. If sources with no FIRST counterpart are excluded, this reduces the completeness and strongly biases the derived radio source sample by removing 5% of the more extended sources.
The completeness of the sample is more difficult to estimate than the reliability, since the true number of matches expected is unknown. However, various estimates can be made. For galaxies with multiple NVSS components, a comparison of the number of candidate NVSS doubles in the SDSS and random samples with the numbers accepted suggests that the completeness is close to 90%. For the single NVSS component sources, Figure 3 shows that there were 2973 SDSS galaxies with an NVSS source within 15 arcsec, compared to only 311 random galaxies. Assuming that this excess is entirely due to genuine sources and that all true matches lie within 15 arcsec, 2662 genuine single–component NVSS sources are expected. Table 1 indicates that 2543 single component sources were actually found by the adopted selection procedures, of which about 30 will be false detections. An estimate of the completeness is then (2543–30) / 2662 94.4%. Note that this value is conservative because a fraction of the excess matches are likely to be associated with companion galaxies, and so 2662 is an overestimate of the true number of expected matches. Therefore, the overall completeness of the sample likely exceeds 95%.
The values quoted for completeness and reliability are for all types of radio source. There will be a small (but unavoidable) bias against extended sources: the completeness for the single–component FIRST sources approaches 100%, while that of multi–NVSS–component sources is around 90%. Note that completeness estimates from previous cross–correlations with the FIRST catalogue have not taken into account the sources missed because sources with radio–optical offsets greater than 3 arcsec are excluded (% of our final source catalogue) as are sources that are completely resolved out by FIRST (5%). These samples will also miss a fraction of the extended NVSS sources (6%) and the multi–component FIRST sources (6%). These omissions have a severe effect on the completeness of any radio sample derived for the SDSS spectroscopic sample using the FIRST survey alone. The radio luminosities of many sources would also be underestimated using FIRST alone: the distribution of FIRST to NVSS flux density ratios for the final sample of sources is plotted in Figure 8, and shows a long tail to low values. Note, however, that all of these effects are somewhat less important when dealing with the complete imaging catalogue of SDSS, for which the galaxies typically lie at higher redshifts.

3.5 The final radio source sample
Details of the final SDSS radio sample of 2712 sources are given in Table 2. This table provides the identification details of each source so that they can be matched against either the original spectra or against the catalogues of derived optical properties released by Brinchmann et al. [Brinchmann et al. 2004a]. Also provided are the RA and Dec of each source, the host galaxy redshift, the integrated NVSS flux density and, where there is a central FIRST counterpart, the integrated flux density, radio size and offset from the optical galaxy of the central FIRST component. Each radio source is also given a classification to identify its radio properties. Class 1 sources are single–component NVSS sources with a single FIRST counterpart. Class 2 sources have a single NVSS match which is resolved into multiple components by FIRST. Class 3 sources have a single–component NVSS source, but no FIRST counterpart. Class 4 sources have multiple NVSS components. The final column of the table classifies each radio source as a star–forming galaxy or a radio–loud AGN, according to the criteria described in Section 4.
| Plate | Julian | Fibre | RA | Dec | z | Radio | Offset | Radio | Source type | ||
| ID | Date | ID | (J2000) | 1.4 GHz | Class | 1.4 GHz | Size | ||||
| (deg) | (deg) | (Jy) | (Jy) | (arcsec) | (arcsec) | ||||||
| 266 | 51630 | 25 | 146.95610 | -0.3423 | 0.1347 | 0.0963 | 1 | 0.1010 | 1.26 | 4.64 | Radio-loud AGN |
| 266 | 51630 | 90 | 146.14360 | -0.7416 | 0.2039 | 0.0068 | 1 | 0.0025 | 0.46 | 5.88 | Radio-loud AGN |
| 266 | 51630 | 119 | 146.73711 | -0.2522 | 0.1305 | 0.0075 | 1 | 0.0043 | 0.51 | 2.39 | Radio-loud AGN |
| 266 | 51630 | 141 | 146.37379 | -0.3684 | 0.0529 | 0.0104 | 1 | 0.0010 | 2.02 | 0.27 | Star-forming |
| 266 | 51630 | 223 | 145.60120 | -0.0014 | 0.1459 | 0.0054 | 1 | 0.0049 | 0.44 | 0.00 | Star-forming |
| 266 | 51630 | 506 | 146.46300 | 0.6387 | 0.0303 | 0.0052 | 1 | 0.0028 | 2.10 | 6.24 | Star-forming |
| 266 | 51630 | 517 | 146.37360 | 0.2555 | 0.1292 | 0.0275 | 1 | 0.0269 | 0.33 | 1.77 | Radio-loud AGN |
| 266 | 51630 | 543 | 146.80679 | 0.6656 | 0.0201 | 0.0180 | 1 | 0.0131 | 0.78 | 10.89 | Radio-loud AGN |
| 266 | 51630 | 545 | 146.79910 | 0.7027 | 0.0305 | 0.0063 | 1 | 0.0045 | 2.73 | 13.71 | Star-forming |
| 266 | 51630 | 572 | 146.78149 | 0.7380 | 0.2618 | 0.0489 | 1 | 0.0094 | 0.77 | 5.71 | Radio-loud AGN |
| 266 | 51630 | 613 | 147.08051 | 0.7880 | 0.2111 | 0.0081 | 1 | 0.0078 | 0.68 | 0.00 | Radio-loud AGN |
| 267 | 51608 | 34 | 149.16991 | -0.0233 | 0.1392 | 0.1661 | 4 | 0.0022 | 0.27 | 4.37 | Radio-loud AGN |
| 267 | 51608 | 47 | 148.43250 | -1.0264 | 0.1103 | 0.0092 | 1 | 0.0111 | 0.06 | 1.45 | Star-forming |
| 267 | 51608 | 97 | 148.23770 | -0.7920 | 0.0898 | 0.0207 | 1 | 0.0169 | 0.43 | 2.69 | Radio-loud AGN |
| 267 | 51608 | 205 | 147.70860 | -0.8878 | 0.2715 | 0.0558 | 1 | 0.0151 | 0.67 | 6.88 | Radio-loud AGN |
| 267 | 51608 | 260 | 147.42830 | -0.8401 | 0.0809 | 0.1671 | 1 | 0.0115 | 0.40 | 0.00 | Radio-loud AGN |
| 267 | 51608 | 297 | 147.20770 | -1.1859 | 0.1282 | 0.0129 | 1 | 0.0124 | 0.07 | 1.26 | Radio-loud AGN |
| 267 | 51608 | 497 | 148.23340 | 0.3577 | 0.2550 | 0.0570 | 1 | 0.0208 | 2.26 | 8.44 | Radio-loud AGN |
| 267 | 51608 | 512 | 148.37680 | 0.4487 | 0.0797 | 0.0118 | 1 | 0.0128 | 0.22 | 2.99 | Radio-loud AGN |
| 268 | 51633 | 38 | 150.47060 | -0.1252 | 0.0329 | 0.0364 | 1 | 0.0260 | 0.45 | 3.68 | Radio-loud AGN |
| 268 | 51633 | 271 | 149.28870 | 0.0092 | 0.1255 | 0.0108 | 1 | 0.0049 | 0.69 | 4.57 | Radio-loud AGN |
| 268 | 51633 | 394 | 148.95151 | 0.5569 | 0.0800 | 0.0117 | 1 | 0.0085 | 0.05 | 1.37 | Radio-loud AGN |
| 268 | 51633 | 433 | 149.33859 | 0.7065 | 0.0874 | 0.0055 | 1 | 0.0038 | 1.39 | 2.58 | Star-forming |
| 268 | 51633 | 461 | 149.35471 | 0.7309 | 0.0869 | 0.0080 | 1 | 0.0066 | 1.24 | 5.78 | Star-forming |
| 268 | 51633 | 479 | 149.39481 | 0.2386 | 0.1602 | 0.0229 | 1 | 0.0092 | 0.64 | 2.67 | Radio-loud AGN |
| 268 | 51633 | 489 | 149.64740 | 0.7428 | 0.0648 | 0.0065 | 1 | 0.0064 | 0.28 | 2.27 | Star-forming |
| 269 | 51910 | 59 | 151.36320 | -0.8746 | 0.2057 | 0.0051 | 1 | 0.0010 | 0.60 | 0.00 | Radio-loud AGN |
| 269 | 51910 | 171 | 151.33971 | 0.0886 | 0.1793 | 0.0087 | 1 | 0.0080 | 0.38 | 0.00 | Radio-loud AGN |
| 269 | 51910 | 257 | 150.47040 | -0.8781 | 0.1364 | 0.1507 | 4 | — | — | — | Radio-loud AGN |
| 269 | 51910 | 289 | 149.91280 | -1.2480 | 0.1375 | 0.0114 | 1 | 0.0111 | 0.29 | 1.39 | Radio-loud AGN |
| … | … | … | … | … | … | … | … | … | … | … | … |
4 Definition of the radio-loud AGN sample
The sample of radio–emitting galaxies contains both radio–loud AGN and a population of star forming galaxies. The latter emit at radio wavelengths mostly as a result of the synchrotron emission of particles accelerated in supernova shocks, and their radio luminosity is therefore roughly correlated with their star formation rate: a 1.4 GHz radio luminosity of W Hz-1 corresponds to a star formation rate of order yr-1 (e.g. Condon 1992 and references therein; Carilli 2001). In order to investigate the host galaxies of these two populations, it is first necessary to separate the radio–loud AGN from the star–forming galaxies.
Star–forming galaxies and AGN are often separated using optical emission–line properties. Sadler et al. [Sadler et al. 2002] used a visual emission–line classification in their study of radio sources in the 2dFGRS: radio–emitting galaxies without detectable emission lines were classified as radio–loud AGN. Kauffmann et al. [Kauffmann et al. 2003c] used the location of a galaxy in the [OIII] 5007 / H versus [NII] 6583 / H emission line diagnostic diagram (Baldwin, Phillips & Terlevich 1981; hereafter BPT) to separate optical AGN from normal star forming galaxies. A key result of the Kauffmann et al. study was that a significant fraction of emission-line selected AGN also have associated star formation. This result means that optical line ratio diagnostics should not be used to identify radio–loud AGN, because star formation activity in galaxies with a radio–quiet active nucleus would give rise to radio emission (and hence a radio–loud classification). In addition, for galaxies which do contain a genuine radio–loud AGN, the radio luminosity associated with the active nucleus will be overestimated if there is a significant contribution of star formation to the radio emission.
Machalski & Condon [Machalski & Condon 1999] studied radio galaxies in the LCRS and used far–infrared to radio flux density ratios and far–infrared spectral indices to separate the radio–loud AGN and star forming populations. The far–infrared radio correlation for star–forming galaxies (e.g. Yun, Reddy & Condon 2001) could also be used to correct for the contribution of star formation to the radio luminosities of these systems. This is perhaps the ideal method, but unfortunately the Infrared Astronomical Satellite (IRAS) Faint Source Catalogue is not quite deep enough to allow this to be used for the SDSS galaxies in this paper222In fact, the IRAS Faint Source Catalogue is deep enough that the majority of star–forming galaxies with 1.4 GHz radio flux densities of 5 mJy are detected (and lie as expected on the far–infrared radio correlation), plus a few of the AGN, but the observations are not deep enough that all star forming galaxies are detected. The IRAS data cannot therefore be used as a discriminant between the two subclasses, nor to correct for any star formation contribution to the radio emission of the AGN.. A variety of alternative methods were therefore considered, and a procedure based on the location of a galaxy in the plane of versus was adopted. The ratio provides the radio luminosity per stellar mass of the galaxy and is a fairly accurate indicator of mean stellar age for ages below about a Gyr (at higher ages it is also sensitive to metallicity; cf. Kauffmann et al. 2003b). Thus, star forming galaxies would be expected to occupy a well–defined locus in this plane, while radio–loud AGN would be offset to higher radio luminosities. This is demonstrated in the first two panels of Figure 9.
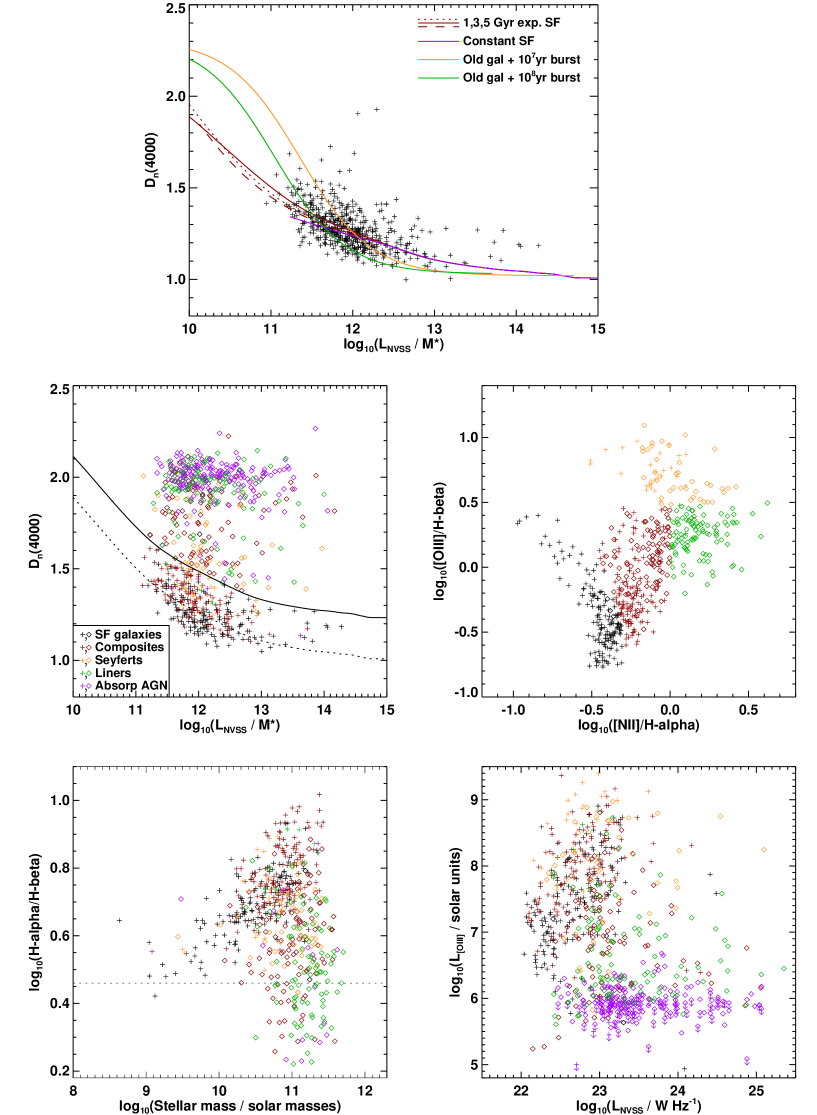
The top panel of Figure 9 shows versus for radio–emitting galaxies that are classified as star forming galaxies using the [OIII] 5007 / H versus [NII] 6583 / H emission line diagnostic diagram. The criteria of Kauffmann et al. [Kauffmann et al. 2003c] have been adopted and only galaxies with redshifts in the range have been plotted; the lowest redshifts are excluded because aperture corrections are substantial, whilst beyond the sensitivity to emission lines is low, hampering classification by emission–line diagnostics. Radio luminosities have been calculated from the fluxes assuming a radio spectral index of 0.7.
Overlaid on this are theoretical predictions, derived using the Bruzual & Charlot [Bruzual & Charlot 2003] stellar synthesis models, for the location of galaxies with different star formation histories. For these models, the radio luminosities have been calculated using the prescription of Hopkins et al. [Hopkins et al. 2001]: W Hz-1, where SFR is the average star formation rate in the past years. Three of the models are for galaxies with exponentially–decaying star formation rates, of characteristic timescales 1,3 and 5 Gyrs; the tracks indicate how these galaxies move across this plane as they age. A fourth model shows the track for a galaxy with a constant star formation rate. Two further models consider an old (10 Gyr) galaxy which has undergone a recent burst of star formation ( and years ago), as might be the case for a merger-triggered event. Here, the loci of the tracks show what happens if different fractions of the total galaxy mass are converted into stars in the burst. These theoretical tracks largely cover the location of the data points.
The middle left panel of Figure 9 shows the same plot, but now includes all radio–emitting galaxies in this redshift range. The different colours represent different galaxy classifications based upon their locations in the BPT diagram (black – star forming galaxy; red – composite systems with both star formation and an AGN; orange – Seyfert AGN; green – LINER AGN; purple – no emission lines). A significant number of the objects classified as AGN based on their emission–line ratios overlap the star–forming population in this plane. This is interpreted as meaning that these are radio–quiet AGN whose radio emission is due to star formation – the problem identified above. The dotted line on this plot shows the 3 Gyr exponential star formation model from the top panel. The solid line, 0.225 above this in , is the proposed division between radio-loud AGN (above the line, plotted as diamonds) and star–forming galaxies (below the line, plotted as crosses). This cut–off value was chosen to be most consistent with other methods that could have been adopted for AGN–starburst separation, as illustrated in the later panels. Using this cut-off, 2215 radio sources are classified as radio–loud AGN, and 497 as star–forming. Note that the plots only show the subset of these at redshifts with , to avoid overcrowding the plot and to allow a comparison with emission–line diagnostic methods; the higher redshift sources fill out more of the plane at larger values of , and confirm that the location of the proposed cut at those values is appropriate.
The middle right panel shows the BPT emission line diagnostic diagram. It can be seen that the AGN–starburst separation defined above (ie. diamonds versus crosses) also makes good sense in this plot: (i) the ‘composite’ galaxies that lie close to the star forming galaxy locus are largely classified as starbursts, whilst those nearer to the AGN locus are predominantly classified as radio–loud AGN; (ii) almost all of the LINERS are classified as radio–loud AGN; (iii) the Seyferts close to the LINER region are mostly classified as radio-loud, whilst those with lower [NII] 6583 / H ratios are a mixture of the two classes; (iv) the three star forming galaxies now classified as radio-loud AGN all lie near the boundary with composites.
The lower left panel shows the H / H line ratio as a function of galaxy stellar mass. The H / H line ratio is an approximate measure of dust–reddening; the dotted line shows the expected value for zero reddening. Star forming galaxies form a tight relation between these parameters, with more massive galaxies being more heavily reddened (cf. Figure 6 of Brinchmann et al. 2004b). Radio–loud AGN deviate from this locus, in the sense of having less reddening (due to less star formation and hence less dust) at a given stellar mass; this diagram indicates that the classification division adopted for versus works well.
The final panel shows the distribution of the galaxies in the versus plane. This relation was considered as a way to separate radio–loud AGN and star-forming galaxies; indeed, it can be seen that for the LINERS and the galaxies without emission lines the division agrees very well with that adopted. However, many of the Seyferts and composites lie on the relation defined by the star–forming galaxies in this plane, but are considerably offset from the star forming locus in all of the other plots. It is for this reason that the final classification was not based upon this relation.
These plots demonstrate the reliability of the AGN–starburst separation using the versus relation: through comparison of the locations of galaxies on different diagnostics, it is estimated that % of objects will have been misclassified. The versus relation was also used to estimate and to correct for the star formation contribution to the radio luminosity of galaxies classified as radio–loud AGN: for each of these galaxies the ‘star formation’ radio luminosity corresponding its 4000Å break strength, as estimated by the 3 Gyr exponential star formation track (the dotted line in the middle left panel), was subtracted to obtain a corrected AGN radio luminosity. In no case was this correction larger than 15%.

The radio–loud AGN in the sample exhibit a variety of optical properties; some are classified as optical AGN based upon their emission lines while others are optically inactive. Figure 10 shows the cumulative fractions of the different radio source types as a function of redshift. Out to redshifts , the relative numbers of radio–loud AGN with and without emission lines are roughly similar. At higher redshifts the proportion of emission-line AGN decreases rapidly; this is because emission lines such as [OIII] 5007 become increasing difficult to detect at higher redshift (only lines brighter than can be detected at ), both because of the increased distance and because the larger physical size of the spectroscopic fibres means that a larger fraction of starlight from the host galaxy is included. This makes it more difficult to pick out the weaker nuclear lines.
| All radio sources | Radio–loud AGN | Star forming galaxies | ||||
| N | N | N | ||||
| (W Hz-1) | (logMpc-3 | (logMpc-3 | (logMpc-3 | |||
| 21.60-21.90 | 10 | 10 | ||||
| 21.90-22.20 | 64 | 64 | ||||
| 22.20-22.50 | 105 | 15 | 90 | |||
| 22.50-22.80 | 132 | 43 | 89 | |||
| 22.80-23.10 | 195 | 115 | 80 | |||
| 23.10-23.40 | 219 | 157 | 62 | |||
| 23.40-23.70 | 335 | 291 | 44 | |||
| 23.70-24.00 | 459 | 448 | 11 | |||
| 24.00-24.30 | 389 | 389 | ||||
| 24.30-24.60 | 303 | 303 | ||||
| 24.60-24.90 | 184 | 181 | ||||
| 24.90-25.20 | 108 | 108 | ||||
| 25.20-25.50 | 35 | 35 | ||||
| 25.50-25.80 | 8 | 8 | ||||
| 25.80-26.10 | 2 | 2 | ||||
| 26.10-26.40 | 1 | 1 | ||||
5 The local radio luminosity function
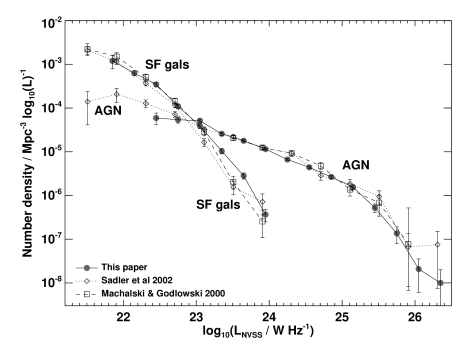
The local radio luminosity function was derived both for radio–loud AGN and radio–emitting star–forming galaxies out to redshift 0.3. These were calculated in the standard way using the method [Schmidt 1968, Condon 1989], where was calculated using the upper and lower redshift limits determined by the joint radio and optical selection criteria, namely a radio cut–off of 5 mJy and optical cut–offs of . An accurate calculation of the exact area of sky within the overlap region of the SDSS DR2 and the FIRST survey is not simple. The absolute normalisation of the derived radio luminosity function has thus been set by normalising the total radio luminosity function to match that derived for the 2dFGRS by Sadler et al. [Sadler et al. 2002] over the radio luminosity range to W Hz-1, where the errors on the two luminosity function determinations are both small. Note that no correction has been made for incompleteness or misidentification in the radio samples but, as discussed above, it is expected that this will be relatively small.
The radio luminosity functions are tabulated in Table 3. The uncertainties quoted on the luminosity function determination are the statistical Poissonian errors only; these have become so small for the SDSS sample at some luminosities that systematic errors are likely to dominate. One important source of systematic error will be cosmic variance. Another is the separation of AGN and star forming galaxies: for the highest luminosity bin of the star forming galaxies and the lowest luminosity bin of the AGN, this systematic error is likely to be comparable to or larger than the Poissonian uncertainties.
The radio luminosity functions are displayed in Figure 11, along with the results of Sadler et al. [Sadler et al. 2002] for the 2dFGRS and Machalski & Godlowski (2000) for the LCRS (both corrected to the cosmology adopted in this paper; note that these determinations are not corrected for incompleteness either). The luminosity function of radio–loud AGN generally agrees well with these previous analyses, although with notably smaller errors. The apparent small mismatches between the Sadler et al. results and those of this paper at and W Hz-1 are likely to be due to cosmic variance.
The luminosity function of star forming galaxies has similar shape to previous measurements, but with slightly higher space densities at high luminosities ( W Hz-1). There are three possible differences between the analyses which could account for this. First, the different optical magnitude limits of the different surveys may influence the population of radio star–forming galaxies studied. Second, the combined FIRST–NVSS radio–optical cross–correlation method adopted here will lead to a more complete sample, particularly for low-redshift star forming galaxies with extended radio emission. Third, the disparity might arise from the contrasting ways in which different analyses treat radio–quiet AGN with associated star formation activity, for which the radio emission is due to the star formation. The technique used in the current paper for separating the star forming and AGN populations would classify such objects as star forming galaxies, but in emission line ratio classifications (as used, for example, by Sadler et al.) they might be classified as AGN. This would lead to previous studies estimating a lower space density of star forming galaxies, particularly at the highest radio luminosities. Note that if star formation dominates the radio and far–infrared emission of these radio–quiet AGN, then these objects would be expected to lie on the far–infrared radio correlation for star forming galaxies, despite being classified (by emission line means) as AGN. In this respect it is interesting to consider Figure 10 of Sadler et al. which shows the far–infrared radio relation for the objects in their sample; many of the objects which lie on the far-infrared radio relation for star forming galaxies, but which have radio luminosities W Hz-1, are indeed classified as AGN. If just some of these objects are truly radio quiet AGN, with radio emission due to associated star formation activity, they could easily account for the small difference between the luminosity function determinations.
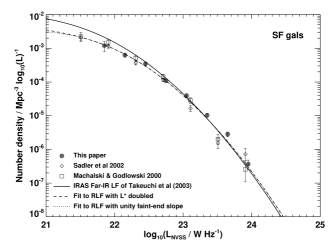
It is instructive to compare the radio luminosity function for star forming galaxies with that derived at far-infrared (FIR) wavelengths. Star–forming galaxies show a tight correlation between their radio and far–infrared luminosities, which Yun et al. [Yun et al. 2001] showed for the range of luminosities probed in the current study to be indistinguishable from a linear relation: . The local FIR luminosity function need only be adjusted by this factor to estimate the local radio luminosity function.
Takeuchi et al. [Takeuchi et al. 2003] derived the local FIR luminosity function using the IRAS Point Source Catalogue redshift survey (PSCz; Saunders et al. 2000). They fitted the data with an analytic function of the form suggested by Sandage et al. [Sandage et al. 1979], namely
with , Mpc-3, and a characteristic luminosity of (where is in units of 100 km s-1Mpc-1). Converting the characteristic luminosity by the factor given above, the equivalent local radio luminosity function is shown as the solid line in Figure 12. This provides a good match to the data at high radio luminosities, supporting the division adopted between AGN and star forming galaxies. The match is less than perfect at lower luminosities, however. The luminosity range covered by the radio observations is not sufficient constrain the parameters for a fit of the above form using the radio data, but the dotted and dashed lines show the effect of doubling the characteristic luminosity or setting the faint end slope to unity (with corresponding changes in ); these provide a much better fit to the data. However, these represent much larger changes than are allowed by the errors on the fitted FIR parameters or on the radio to FIR conversion.
The difference between the radio and FIR luminosity functions means that the observed radio to FIR correlation stops being a linear relation at low luminosities. This has been suggested before in terms of a steepening of the relation below (cf. Yun et al. 2001 and references therein) but questions have been raised as to whether the previous studies may be affected by selection biases in the samples under study. Here it is shown that the difference is also present in the luminosity functions. The difference occurs for the lowest luminosity sources, which are generally at the lowest redshifts and therefore may have larger angular sizes, in which case it may be caused by photometric errors due to aperture effects. This is unlikely to be the case, however. The NVSS is sensitive to emission on angular scales out to several arcmins, much larger than potential host galaxies. The IRAS photometry is susceptible to missing extended emission, but for PSCz galaxies this has been corrected for [Saunders et al. 2000], and in any case any missing IRAS flux would lower the far-IR to radio ratio, which is in the opposite sense to the observed differences. More likely is that there is a genuine effect at work: either the radio luminosity or the FIR luminosity is not directly proportional to the star formation. One way in which this might occur is if there is an additional low–level contribution to the FIR luminosity of galaxies, for example from dust heated by low mass stars, which is usually swamped by the FIR emission associated with star formation, but becomes significant at low star formation rates (cf. Devereux & Eales 1989 and references therein).
6 Conclusions
The main results of this paper are as follows:
-
•
A catalogue of 2712 radio sources has been derived by cross–correlating the SDSS spectroscopic sample with a combination of the NVSS and FIRST surveys.
-
•
The use of a hybrid NVSS–FIRST method to identify the radio sources has been highly successful, resulting in a sample with a reliability of 98.9% and a completeness which is estimated to be over 95%.
-
•
The radio sources have been sub–divided into 2215 radio–loud AGN and 497 star–forming galaxies, based upon their location in the plane of 4000Å break strength versus radio luminosity per unit stellar mass.
-
•
The local radio luminosity functions of radio–loud AGN and star forming galaxies have been derived separately. These are in excellent agreement with previous studies, but with smaller uncertainties.
-
•
The local radio luminosity function of star–forming galaxies has been compared to that derived in the far–infrared. Differences between the two confirm that the far–IR to radio correlation becomes non–linear at low luminosities.
The development of the hybrid NVSS–FIRST method for identification of radio sources represents a large step forward in the study of radio source host galaxies. One note of caution needs to be added: the parameters for acceptance or rejection of sources have been optimised for the SDSS spectroscopic sample, and if the comparison survey has a significantly different sky surface density of objects, the offset parameters for acceptance may need to be modified in order to retain optimal completeness and reliability. The general method, however, can (and where possible, should) be adopted unchanged in future studies.
The sample of radio sources produced will prove invaluable in the study of the host galaxies of radio–loud AGN, due to the large size of the sample and the wealth of information available on the host galaxies from the SDSS. Such analysis is the focus of the accompanying paper.
Acknowledgements
PNB would like to thank the Royal Society for generous financial support through its University Research Fellowship scheme. The authors thank Jarle Brinchmann, Stephane Charlot, Christy Tremonti and Simon White for making their catalogues available and for useful discussions. The research makes use of the SDSS Archive, funding for the creation and distribution of which was provided by the Alfred P. Sloan Foundation, the Participating Institutions, the National Aeronautics and Space Administration, the National Science Foundation, the U.S. Department of Energy, the Japanese Monbukagakusho, and the Max Planck Society. The research uses the NVSS and FIRST radio surveys, carried out using the National Radio Astronomy Observatory Very Large Array: NRAO is operated by Associated Universities Inc., under co-operative agreement with the National Science Foundation.
References
- [Baldwin et al. 1981] Baldwin J. A., Phillips M. M., Terlevich R., 1981, PASP, 93, 5
- [Becker et al. 1995] Becker R. H., White R. L., Helfand D. J., 1995, ApJ, 450, 559
- [Best 2004] Best P. N., 2004, MNRAS, 351, 70
- [Best et al. 2005] Best P. N., Kauffmann G., Heckman T. M., Brinchmann J., Charlot S., Ivezić Ž., White S. D. M., 2005, MNRAS, submitted
- [Brinchmann et al. 2004a] Brinchmann J., Charlot S., Heckman T., Kauffmann G., Tremonti C., White S. D. M., 2004a, astro-ph/0406220
- [Brinchmann et al. 2004b] Brinchmann J., Charlot S., White S. D. M., Tremonti C., Kauffmann G., Heckman T., Brinkmann J., 2004b, MNRAS, 351, 1151
- [Bruzual & Charlot 2003] Bruzual G., Charlot S., 2003, MNRAS, 344, 1000
- [Carilli 2001] Carilli C. L., 2001, in Tacconi L., Lutz D., eds, Starburst Galaxies: Near and Far. Springer-Verlag, p. 309
- [Colless et al. 2001] Colless M. M. et al. 2001, MNRAS, 328, 1039
- [Condon 1989] Condon J. J., 1989, ApJ, 338, 13
- [Condon 1992] Condon J. J., 1992, ARA&A, 30, 575
- [Condon et al. 1998] Condon J. J., Cotton W. D., Greisen E. W., Yin Q. F., Perley R. A., Taylor G. B., Broderick J. J., 1998, AJ, 115, 1693
- [Devereux & Eales 1989] Devereux N. A., Eales S. A., 1989, ApJ, 340, 708
- [Heckman et al. 2004] Heckman T. M., Kauffmann G., Brinchmann J., Charlot S., Tremonti C., White S. D., 2004, ApJ, 613, 109
- [Hopkins et al. 2001] Hopkins A. M., Connolly A. J., Haarsma D. B., Cram L. E., 2001, AJ, 122, 288
- [Ivezić et al. 2002] Ivezić Ž. et al. 2002, AJ, 124, 2364
- [Kauffmann et al. 2003a] Kauffmann G. et al. 2003a, MNRAS, 341, 33
- [Kauffmann et al. 2003b] Kauffmann G. et al. 2003b, MNRAS, 341, 54
- [Kauffmann et al. 2003c] Kauffmann G. et al. 2003c, MNRAS, 346, 1055
- [Machalski & Condon 1999] Machalski J., Condon J. J., 1999, ApJ Supp., 123, 41
- [Machalski & Godlowski 2000] Machalski J., Godlowski W., 2000, A&A, 360, 463
- [Magliocchetti et al. 1998] Magliocchetti M., Maddox S. J., Lahav O., Wall J. V., 1998, MNRAS, 300, 257
- [McMahon et al. 2002] McMahon R. G., White R. L., Helfand D. L., Becker R. H., 2002, ApJ Supp., 143, 1
- [Sadler et al. 2002] Sadler E. M. et al. 2002, MNRAS, 329, 227
- [Sandage et al. 1979] Sandage A., Tammann G. A., Yahil A., 1979, ApJ, 232, 352
- [Saunders et al. 2000] Saunders W., Sutherland W. J., Maddox S. J., Keeble O., Oliver S. J., Rowan-Robinson M., McMahon R. G., Efstathiou G. P., Tadros H., White S. D. M., Frenk C. S., Carramiñana A., Hawkins M. R. S., 2000, MNRAS, 317, 55
- [Schmidt 1968] Schmidt M., 1968, ApJ, 151, 393
- [Shectman et al. 1997] Shectman S. A., Landy S. D., Oemler A., Tucker D. L., Lin H., Kirshner R. P., Schechter P. L., 1997, ApJ, 470, 172
- [Stoughton et al. 2002] Stoughton C. et al. 2002, AJ, 123, 485
- [Takeuchi et al. 2003] Takeuchi T. T., Yoshikawa K., Ishii T. T., 2003, ApJ, 587, L89
- [Tremonti et al. 2004] Tremonti C. A., Heckman T. M., Kauffmann G., Brinchmann J., Charlot S., White S. D. M., Seibert M., Peng E. W., Schlegel D. J., Uomoto A., Fukugita M., Brinkmann J., 2004, ApJ, 613, 898
- [York et al. 2000] York D. G. et al. 2000, AJ, 120, 1579
- [Yun et al. 2001] Yun M. S., Reddy N. A., Condon J. J., 2001, ApJ, 554, 803