The host galaxies of radio–loud AGN: mass dependencies, gas cooling and AGN feedback
Abstract
The properties of the host galaxies of a well–defined sample of 2215 radio–loud AGN with redshifts , defined from the Sloan Digital Sky Survey (SDSS), are investigated. These are predominantly low radio luminosity sources, with 1.4 GHz luminosities in the range to W Hz-1. The fraction of galaxies that host radio–loud AGN with W Hz-1 is a strong function of stellar mass, rising from nearly zero below a stellar mass of to more than 30% at stellar masses of . In contrast to the integrated [OIII] luminosity density from emission line AGN, which is mainly produced by black holes with masses below , the integrated radio luminosity density comes from the most massive black holes in the Universe. The integral radio luminosity function is derived in six ranges of stellar and black hole mass. Its shape is very similar in all of these ranges and can be well fitted by a broken power-law. Its normalisation varies strongly with mass, as or ; this scaling only begins to break down when the predicted radio–loud fraction exceeds 20–30%. There is no correlation between radio and emission line luminosities for the radio-loud AGN in the sample and the probability that a galaxy of given mass is radio-loud is independent of whether it is optically classified as an AGN. The host galaxies of the radio–loud AGN have properties similar to those of ordinary galaxies of the same mass, with a tendency for radio–loud AGN to be found in larger galaxies and in richer environments. The host galaxies of radio–loud AGN with emission lines match those of their radio–quiet counterparts.
All of these findings support the conclusion that the optical AGN and low radio luminosity AGN phenomena are independent and are triggered by different physical mechanisms. Intriguingly, the dependence on black hole mass of the radio–loud AGN fraction mirrors that of the rate at which gas cools from the hot atmospheres of elliptical galaxies. It is speculated that gas cooling provides a natural explanation for the origin of the radio–loud AGN activity, and it is argued that AGN heating could plausibly balance the cooling of the gas over time.
keywords:
galaxies: active — galaxies: evolution — galaxies: stellar content — galaxies: luminosity function — galaxies: structure — radio continuum: galaxies1 Introduction
In recent years it has become apparent that active galactic nuclei (AGN) are not only interesting objects to study in their own right, but may also play an important role in the process of galaxy formation and evolution. One major development has been the detection of a central (generally dormant) massive black hole at the heart of essentially all nearby galaxies. Further, the mass of these black holes is tightly correlated with that of the stellar bulge component of their host galaxies, as estimated from the velocity dispersion [2000, 2000], the absolute magnitude of the bulge [1995, 1998] or using virial methods [2003]. This correlation indicates that the build-up of a galaxy and that of its central black hole are fundamentally linked. Theoretical interpretations of this favour models in which the host galaxy and its central black hole grow simultaneously up until the point when either all of the gas has been consumed (e.g. Archibald et al. 2002) or the central AGN has reached sufficient luminosity that its winds are able to drive the remaining gas out of the galaxy, thereby terminating both star formation and black hole growth [1998, 1999, 2003].
Highly luminous AGN were considerably more common in the early Universe than they are today; their co-moving space density has fallen by about a factor of 1000 since redshifts 2–3 (e.g. Hartwick & Schade 1990). Nevertheless, much can still be learned about AGN through studies of their host galaxies in the nearby Universe. In particular, the new large galaxy redshift surveys, especially the 2-degree Field Galaxy Redshift Survey (2dFGRS; Colless et al. 2001) and the Sloan Digital Sky Survey (SDSS; York et al. 2000; Stoughton et al. 2002) allow the definition of sufficiently large samples of nearby AGN to enable comprehensive statistical analyses of their host galaxy properties to be carried out.
Kauffmann et al. (2003a; hereafter K03) constructed a sample of 22,623 optically–selected narrow–line AGN from the first data release (DR1) of the SDSS main spectroscopic catalogue. They investigated in detail various properties of the host galaxies of these AGN, such as their stellar masses, sizes, surface mass densities, mean stellar ages, and past star formation histories (see Kauffmann et al. 2003b,c for a description of how these properties were derived). They found that optically–selected AGN reside almost exclusively in massive galaxies, with the fraction of AGN decreasing rapidly below a stellar mass of . The structural properties of the AGN, such as their sizes and stellar mass densities, were found to be statistically indistinguishable from those of normal early–type galaxies of the same mass. For low emission–line luminosity AGN, which are predominately Low–Ionisation Nuclear Emission–line Region (LINER) type galaxies, this was also true of their stellar populations. The higher emission line luminosity AGN (; these are predominantly Seyferts), however, were found to have lower 4000Å break strengths [hereafter ], implying on-going star formation, and to exhibit evidence of galaxy–wide bursts of star formation in the recent past. Indeed, these high emission line luminosity AGN occupy a region of the stellar mass () versus plane which is poorly populated by ordinary galaxies. K03 concluded that emission line AGN and starburst activity are tightly related phenomena (cf. Sanders et al. 1988). They argued that this may have a straightforward interpretation since powerful AGN require two key ingredients: a massive black hole and a supply of gas to fuel it. Massive black holes are only found in galaxies with massive bulges, and where there is an ample supply of gas it is not unreasonable to suppose that there will also be on-going star formation.
One issue that needs to be considered, however, is that in the K03 study the AGN were optically selected by their emission line properties, using the [OIII] 5007 / H versus [NII] 6583 / H emission line ratio diagnostic diagram [1981] to separate out the AGN from those galaxies where the emission lines are associated with star formation. As such, only galaxies in which all four of these emission lines are detected can be classified as AGN, meaning that the sample is naturally biased in favour of AGN with bright emission lines. Given the importance of understanding the physical nature of the AGN phenomenon, it is clearly necessary to test the robustness of the emission–line selection technique and determine whether emission–line selection influences conclusions about the nature of AGN host galaxies, the growth of black holes and their associated energetic output.
Radio–loud AGN are generally hosted by giant elliptical galaxies (e.g. Matthews, Morgan, & Schmidt 1964). The most powerful radio sources (the ‘classical doubles’, known as Fanaroff & Riley [1974] Class II sources, or FR IIs) usually have strong line emission, which is roughly proportional to their radio luminosity (e.g. Rawlings et al. 1989). However, it has long been known that a subset of FR IIs have only very weak or no emission lines [1979], as do most of the lower radio luminosity FR Is (‘edge–darkened’ radio sources, whose jets decelerate significantly and flare out in the inner kiloparsec probably due to entrainment of material). Sadler et al. [2002] defined a sample of radio–loud AGN within the 2dFGRS and found that of order half of them (the exact fraction depends upon the quality of the spectra) have absorption line spectra similar to those of inactive giant elliptical galaxies, and would be mostly missed by emission–line selection. There remains much debate as to whether weak–lined FR Is and the possibly related weak–emission lined FR IIs have a different accretion mechanism to their more powerful counterparts (see Cao & Rawlings 2004 and references therein). The interstellar medium of these galaxies is hot and diffuse, in contrast to the cold dense interstellar medium of the strong emission line AGN, which may imply a difference in the way in which the black hole is fueled and ionising radiation is produced.
Despite their low emission line luminosities, FR I radio sources can still provide a very important energetic output into their environment, through the expansion of their radio lobes. This process can lead to very efficient coupling of the jet kinetic energy output of the radio sources with the interstellar or intergalactic medium. This has been observed through the detection of buoyant gas bubbles (e.g. Böhringer et al. 1993) and energy–dispersing sound waves in clusters of galaxies [2003]. Fabian et al. argued that the heating effects of the weak shocks and sound waves associated with the radio source AGN activity may work to balance the effects of gas cooling within the central regions of clusters, and thus explain why signatures of cooler gas are not observed.
The important new insights into the nature of the emission–line AGN population provided by the superb statistics in the SDSS provide encouragement that similarly important insights will emerge from an analysis of the SDSS population of radio–loud AGN. The goal of the current paper is to investigate this, by studying the sample of 2215 radio–loud AGN that were defined in the accompanying paper (Best et al. 2005; hereafter Paper I). The radio–loud AGN host galaxies are compared with those of both optically selected AGN and inactive galaxies111In this paper, ‘inactive’ galaxies are taken to mean those with no observable AGN activity at optical or radio wavelengths; ‘optically inactive’ galaxies are those with no optical AGN activity, but which possibly do show radio emission., in order to investigate the nature of AGN in the nearby Universe, to cross–compare different AGN selection methods, and to investigate the origin of radio loudness.
The layout of the paper is as follows. In Section 2 a brief description is provided of the three surveys from which the radio–loud AGN is defined; the SDSS, the National Radio Astronomy Observatory (NRAO) Very Large Array (VLA) Sky Survey (NVSS; Condon et al. 1998) and the Faint Images of the Radio Sky at Twenty centimetres (FIRST) survey [1995]. The reader is referred to Paper I for a full description of the sample definition process. Section 3 then studies how the radio and optical AGN fractions depend upon the mass of the host galaxy. The inter–relation of radio and optical activity is investigated in Section 4. Section 5 discusses briefly how galaxy environments differ between radio–loud AGN with and without emission lines. Section 6 then compares the properties of the host galaxies of the radio–loud AGN with those of inactive galaxies. The results are discussed and conclusions drawn in Section 7; in particular, the mass dependence of the AGN activity is compared to the gas cooling rate and to the balance between cooling and AGN heating. Throughout the paper, the values adopted for the cosmological parameters are , , and km s-1Mpc-1.
2 The radio–loud AGN sample
The basis sample for this study is a sample of galaxies described by Brinchmann et al. [2004], which was drawn from the ‘main galaxy catalogue’ of the second data release (DR2) of the Sloan Digital Sky Survey (York et al. 2000; Stoughton et al. 2002, and references therein). This consists of about 212,000 galaxies with magnitudes , for which spectroscopic redshifts have been determined. As described by Brinchmann et al. [2004], many properties of these galaxies have been parameterised from the imaging and spectroscopic data, with catalogues of parameters available on the web (see http://www.mpa-garching.mpg.de/SDSS/). Measured parameters include: galaxy sizes, concentration indices, 4000Å break strengths, H absorption measurements [2003b, 2003c]; accurate emission line fluxes, after subtraction of the modelled stellar continuum (K03, Tremonti et al. in preparation); parameters measuring optical AGN activity, such as emission line ratios, and galaxy velocity dispersions (hence black hole mass estimates; K03, Heckman et al. 2004). Derived parameters include total stellar masses, stellar surface mass densities, mass-to-light ratios, dust attenuation measurements, star formation rates [2004], and gas–phase metallicities [2004]. These parameters have been adopted for the analyses of this paper: the reader is referred to the papers referenced above for detailed information about the methods used to derive them.
The NVSS [1998] and FIRST [1995] radio surveys have both been carried out in recent years using the VLA radio synthesis telescope at a frequency of 1.4 GHz, but at differing angular resolutions. The NVSS covers the entirety of the sky north of declination, at an angular resolution of 45 arcseconds, down to a limiting point source flux density of about 2.5 mJy. It is therefore sensitive to extended radio emission, but its angular resolution is a little poor for reliable cross–identification of the sources with their optical counterparts. The FIRST observations cover a sky area designed to largely overlap with that of the SDSS, down to a limiting flux density of about 1 mJy for point sources. These have a much higher angular resolution of arcsec, allowing reliable cross-comparison of point sources, but meaning that extended sources are often resolved into multiple components, and some (or even all) of the flux density may be resolved out.
The FIRST and NVSS radio surveys are highly complementary for identifying radio sources associated with nearby galaxies. In Paper I an algorithm was developed to identify radio sources within the SDSS spectroscopic sample using a hybrid method, which optimised the advantages of the two individual surveys whilst avoiding most of the completeness and reliability problems associated with the use of either survey individually. In this way it was possible to derive a sample of 2712 radio–loud galaxies to a 1.4 GHz flux density limit of 5 mJy, with the sample having a completeness of approximately 95% and a reliability of 98.9%. The location of these radio–loud galaxies in the plane of 4000Å break strength versus radio luminosity per unit stellar mass was then used to separate this sample into the radio–loud AGN (2215 galaxies) and the star–forming galaxies (497).
In the current paper, many analyses of host galaxy properties are restricted to the subset of 420 radio–loud AGN from that sample with redshifts . This is for two reasons. First, for the sample flux–density limit of 5 mJy, corresponds to a radio luminosity limit of about W Hz-1 which represents the majority of the radio–loud AGN population. Second, at higher redshifts the fraction of galaxies with detectable emission lines declines sharply, both because of the increased distance and because the 3-arcsec diameter fibre aperture includes a larger background of starlight from the host galaxy, so there is declining sensitivity to weak nuclear emission lines (only [OIII] luminosities brighter than can be detected at ). For analyses in which emission line measurements are not required and it is straightforward to account for the redshift dependence of the radio luminosity limit, the entire sample of radio–loud AGN is retained in order to provide improved statistics.
A final issue worth noting is that, as discussed in Paper 1 and by K03, the use of the SDSS main galaxy sample as the basis sample means that objects classified as ‘quasars’ by the automated SDSS classification pipeline (Schlegel et al. in preparation) are excluded, even if they lie in the redshift range under study. The exclusion of these objects is necessary since the presence of direct light from the active nucleus prohibits the host galaxy parameters discussed above from being accurately determined. In orientation–based unification schemes for AGN (e.g. Antonucci 1993 and references therein), however, such AGN (Type-I’s) are the same as the (Type-II) AGN under study, but simply viewed at a different angle to the line of sight. If such unification schemes are correct then the only effect of restricting study to Type-II objects is that all AGN fractions derived should be scaled upwards by a small factor. The size of this scale factor depends upon the relative numbers of AGN included and excluded from the analysis.
For the low–luminosity AGN under study here, Type-II AGN greatly outnumber Type-I AGN (although this changes at higher luminosities, suggesting a luminosity–dependent torus opening angle, e.g. Hao et al. 2005, Simpson 2005). Further, at these low luminosities many Type-I AGN are pipeline classified as ‘galaxies’ rather than ‘quasars’ anyway, since the host galaxy greatly outshines the weak AGN. These objects therefore remain included in our sample (cf. K03, who estimate that 8% of AGN in the main galaxy sample have broad emission lines, and therefore are strictly Type-Is); only those classified as quasars are excluded. In the redshift range , in which most of the analyses of this paper are carried out, a search of the SDSS DR2 database reveals only 393 objects classified as quasars. This compares to 16661 objects classified as emission–line AGN by K03 in the same redshift range. Even allowing for some Type-I AGN being excluded from spectroscopic study, e.g. because the nuclear emission brightens them out of the target magnitude range, only a few percent of all AGN are excluded by the removal of the ‘quasar’ objects. The correlations discovered in this paper are far too strong to be affected by any such changes, and therefore the exclusion of some Type-I AGN has no effect upon the results of this paper.
3 Mass dependence of AGN activity
The SDSS data allow estimates to be made of both the stellar mass and the black hole mass of the galaxies. The stellar mass is derived from the extinction–corrected optical luminosity by using a mass–to–light ratio that is estimated using the 4000Å break strength and the H absorption index (Kauffmann et al. 2003b). Black hole mass () is a more fundamental parameter for AGN since it probes the central engine directly. The black hole mass can be estimated using the velocity dispersion () of the galaxy and the relation between velocity dispersion and black hole mass given in Tremaine et al. [2002]: logkm s-1)222This relation is used for consistency with the emission–line AGN studies. Adoption of a different black hole mass versus velocity dispersion relation, such as that of Ferrarese & Ford [2004], simply requires a straightforward re-scaling of the black hole masses.. In general, however, black hole masses are more poorly determined than stellar masses. There are a number of reasons for this: (i) the velocity dispersion measurements have bigger errors than the magnitude measurements; (ii) for disk–dominated galaxies, the velocity dispersion measured within the fibre does not provide an accurate measure of black hole mass; (iii) perhaps most importantly, there is significant scatter in the black hole mass versus velocity dispersion relation. This means that for individual objects, the black hole mass estimate may be wrong by a factor of a few. In this paper, analyses are therefore carried out using either stellar mass or black hole mass or both, as is most appropriate for the property under study.
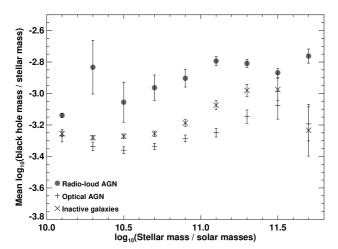

Before beginning the analysis, it is worth noting that at a fixed stellar mass, radio–loud AGN are biased towards larger bulges and larger black holes. This is demonstrated in Figure 1. The top panel shows the mean black hole to stellar mass ratio as a function of stellar mass for radio–loud AGN, emission-line selected AGN and inactive galaxies. The radio–loud AGN have larger mean black hole masses at a given stellar mass than inactive galaxies (while for emission–line selected AGN the opposite is true). The stellar surface mass density () of a galaxy can be used to as a guide to its morphology; as shown by Kauffmann et al. [2003b], the value kpc-2 marks the point where the galaxy population undergoes a transition from disk–dominated to bulge–dominated galaxies. The middle panel of Figure 1 shows that the difference between the mean black hole mass to stellar mass ratio of radio–loud AGN and that of inactive galaxies decreases for galaxies with higher mass surface densities. This indicates that radio–loud AGN have more massive black holes (at given stellar mass) because they are in galaxies with larger bulge–to–disk ratios. Indeed the bottom panel shows the black hole mass versus stellar mass distribution of the radio–loud AGN; the plotted line is the relation between bulge mass and black hole mass derived by Häring & Rix [2004]. Particularly at the higher masses, the radio–loud AGN are distributed around this relation, indicating that essentially all of their stellar mass is associated with a bulge.
3.1 Radio–loud AGN fractions
It has long been known that radio–loud AGN are preferentially hosted by massive elliptical galaxies. The SDSS data allow this mass dependence to be investigated in detail.

The top–left panel of Figure 2 shows the fraction of galaxies with redshifts that are classified as radio–loud AGN (with 1.4 GHz radio luminosity above W Hz-1), as a function of the stellar mass of the galaxy. The fraction rises from 0.01% of galaxies with stellar mass up to over 30% of galaxies more massive than , roughly along a relation . Also included on this plot are the radio–loud AGN fractions for radio luminosity cut–offs of and W Hz-1. It is notable that all have the same power–law dependence on stellar mass.
The top right panel of Figure 2 shows the radio–loud AGN fraction as a function of black hole mass. This plot is restricted to bulge–dominated galaxies with surface mass densities above kpc-2, in order to restrict the sample to galaxies for which the black hole mass can be reliably determined from the velocity dispersion (note that the results are not very much affected if this condition is removed). Once again, a strong trend with mass is seen, but the slope of the relation is shallower: . Some of this reduction in slope (and in particular the flattening at the highest black hole masses) may be due to the errors in the black hole mass estimates, spreading the sources along the x–axis. A more important effect is that a large fraction of lower mass galaxies () are disk dominated and so possess only small black holes. These galaxies host fewer radio–loud AGN and as a result will have a steeper dependence on stellar mass than on black hole mass.
It is important to consider whether the strong mass dependence in Figure 2 is simply the result of more massive galaxies having more powerful central engines which may naturally have more luminous radio emission. Figure 3 shows as a function of stellar mass, where is now defined to include galaxies brighter than a fixed limit in . For bulge–dominated galaxies, this is equivalent to defining a galaxy as radio–loud if it is radiating above some fixed fraction of the Eddington limit. The strong mass dependence remains. The same result is found if black hole mass rather than stellar mass is used.
In order to ensure that neither aperture nor luminosity selection effects are influencing the observed results, these studies (and those in later sections of the paper) have also been repeated using only those galaxies within fixed narrow ranges in redshift (e.g. ). The same results are obtained (albeit somewhat noisier), indicating that redshift effects are not a problem.

3.2 Optical AGN fractions
In Figure 1, the emission–line selected AGN have lower black hole masses on average than radio–loud AGN of the same stellar mass. This means that these AGN are not preferentially located in bulge–dominated galaxies. Indeed, their black hole masses even appear to be lower than those of inactive galaxies, suggesting that optical AGN are found preferentially in galaxies with substantial disk components.
The dependence of the emission–line selected AGN fraction upon mass is also strikingly different to that of the radio–loud AGN. The lower panels of Figure 2 show this for different cuts in (extinction–corrected) [OIII] 5007 line luminosity. As for the radio–loud AGN fractions, the analysis is limited to galaxies with redshifts for the two brighter luminosity cuts; for the faintest cut the upper redshift limit is reduced to 0.08 in order to retain completeness in the sample. Optical AGN are preferentially found in galaxies of high stellar mass, with the proportion of galaxies hosting AGN with increasing strongly up to stellar masses of and remaining roughly constant above this value (cf. K03). This variation can be largely explained by the fact that the fraction of disk-dominated galaxies (with only very low mass black holes) increases at low stellar masses: when plotted against black hole mass instead of stellar mass, the emission line AGN fraction shows much less variation.
At higher [OIII] luminosities (), the AGN fraction falls at the highest masses. These results have been discussed in detail in K03 and Heckman et al. [2004] and reflect the fact that both the presence of a black hole and sufficient gas content are necessary to achieve high emission line luminosities in optically–selected AGN. Although massive galaxies host the biggest black holes, they generally have old stellar populations and very little gas. As a result they do not usually host powerful emission–line AGN at the present day.
Radio selection of AGN picks out the most massive galaxies with the biggest black holes, and it is clear that this is a very different population of objects to that determined by emission–line selection. The relation between radio and optical activity is investigated in detail in Section 4.
3.3 The bivariate radio luminosity – mass function
 |
 |
 |
Determination of the bivariate radio–optical luminosity function was first carried out by Auriemma et al. [1977], and investigations using improved samples were carried out by Sadler et al. [1989] and by Ledlow & Owen [1996]. These authors were able to show that the probability of a galaxy being radio–loud is a strong function of its optical luminosity. The Sadler et al. and Ledlow & Owen studies also argued that the location of the break in the radio luminosity function scaled with optical luminosity. The uncertainties on these bivariate luminosity functions were large, owing to the small sizes of the samples available for study. These studies can now be improved using the much larger SDSS radio source sample; in addition, the SDSS data allow a comparison with stellar mass or black hole mass instead of optical luminosity.
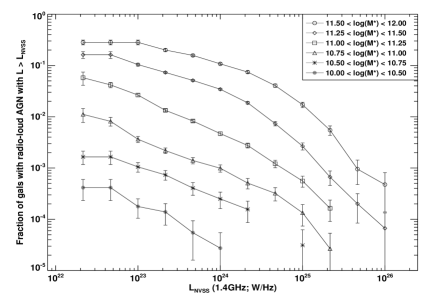
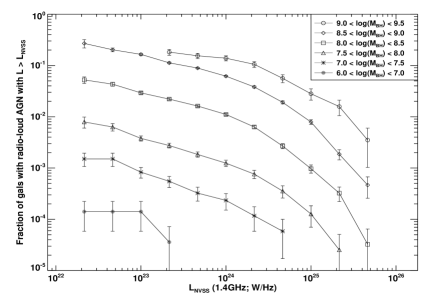
Figure 4 shows the integral bivariate radio luminosity versus mass functions derived for the SDSS sample. The top panel shows the fraction of galaxies which are radio–loud AGN brighter than a given radio luminosity, as a function of radio luminosity. Results have been plotted for six bins in stellar masses. The middle panel shows the equivalent relations for six bins in black hole mass. The most striking feature of these figures is the dramatic decrease in the fraction of radio–loud AGN with decreasing stellar or black hole mass, as discussed above. Another remarkable feature is that for both stellar and black hole mass the shape of the functions are very similar for all mass ranges (except for the highest mass bins, discussed below). This is illustrated in the bottom panel of Figure 4, where the integral bivariate radio luminosity functions for black hole mass have been scaled by to remove the mass dependence. The scaled data agree very well, and there is no evidence for any dependence of the break luminosity on black hole mass. These results indicate that the earlier suggestions of Sadler et al. [1989] and Ledlow & Owen [1996] of a dependence of the break radio luminosity on the optical luminosity of the host galaxy were either artefacts of the small sample sizes or differences resulting from the use of optical luminosity instead of black hole mass.
Ledlow & Owen found evidence for a flattening of the faint end slope of the radio luminosity function with increasing optical luminosity of the host galaxy. These results are not supported by the current data except at the highest stellar and black hole masses (, ) where there is evidence for shallower slopes. It is likely that the Ledlow & Owen result was entirely driven by these highest mass sources. The precise physical explanation of the flattening of the faint–end slope at the highest masses is not yet known, but what is clear is that a turn–over would have to occur at some mass, otherwise the radio–loud fraction would exceed 100%.
In summary, Figure 4 demonstrates that the probability of a galaxy becoming a radio source is a very strong function of its mass. Except at the very highest masses, however, the luminosity of the radio source that results is independent of mass. The bottom panel of Figure 4 shows that this luminosity dependence can be well fitted by a broken power law model such that overall the fraction of sources that are radio loud AGN brighter than some luminosity is given by:
for which the best–fit parameter values are as follows:
This equation holds well for all probabilities , but breaks down at higher values of , possibly reflecting a ceiling at the % level.
A similar relation can be derived as a function of stellar mass (in units of ), and provides best–fit values of , , , and W Hz-1.
4 Independence of radio and optical AGN activity
In Paper I it was shown that some radio–loud AGN are classified as optical AGN based upon their emission line properties, whilst others are optically inactive. It was also shown that out to redshifts the relative numbers of radio–loud AGN which are or are not classified as emission line AGN are roughly similar: of the 420 radio–loud AGN in the redshift range , 227 are classified as optical AGN based upon their emission lines and 193 classified as optically inactive333In fact, just over half of the ‘inactive’ galaxies do have marginal [OIII] 5007 detections, but are not classified as emission–line AGN because that classification requires all four emission lines in the emission line diagnostic diagram to be detected with S/N 3 (cf. K03; Paper I).. At higher redshifts the proportion of emission line AGN decreases rapidly, because weak nuclear emission lines become increasingly more difficult to detect. In this section, the relationship between the radio and emission line activity is investigated.
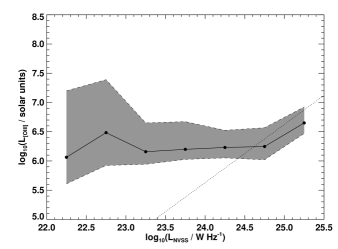
It is well-known that for very powerful radio sources, emission line and radio luminosity are well–correlated (e.g. Rawlings & Saunders 1991, McCarthy 1993). However, the SDSS radio sources are less powerful than these, and Zirbel & Baum [1995] have shown that emission line luminosity depends much less strongly upon radio luminosity at these lower radio luminosities. Figure 5 shows the median extinction–corrected [OIII] 5007 emission line luminosity as a function of radio luminosity (corrected for the contribution due to star formation, as described in Paper I) for the SDSS radio–loud AGN in the redshift range : no correlation at all is seen between the two quantities out to a 1.4 GHz radio luminosity of W Hz-1 (the highest luminosity available in this redshift range). This is consistent with the previous results, and indeed the turn–up in the last bin may be related to the onset of the correlation found at higher radio luminosities. It is interesting that the radio luminosity at which the transition in emission–line properties properties occurs is similar to that where the transition from low luminosity FR Is to the more powerful FR IIs takes place (cf. Baum et al. 1995, Zirbel & Baum 1995, Wills et al. 2004), and is also close to the break in the radio luminosity function.


Figure 6 investigates this result in more detail, comparing the distribution of [OIII] 5007 emission line luminosities for samples of radio–loud AGN in three different ranges of radio luminosity with a ‘control’ sample of galaxies that are not detected in the radio. The analysis is restricted to galaxies with stellar masses in the range ; a narrow mass range is adopted to avoid biases associated with the strong increase in the fraction of radio galaxies as a function of stellar mass. The samples are also restricted to early-type galaxies with surface mass densities above kpc-2 (this additional criterion does not remove any AGN and only excludes 1.5% of the galaxies in the control sample, so has negligible effect on the final result). A number of the galaxies only have upper limits to their [OIII] 5007 luminosities. These are accounted for by plotting two lines for each sample, representing the upper and lower bounds of the cumulative distribution (see figure caption for more details). It is apparent that there are no major differences between the samples of radio–loud AGN and the control sample. The ASURV survival analysis package [1992] was used to confirm this result. This calculates the probability that two samples are drawn from the same parent distribution according to 5 different survival analysis methods (which take proper account of the upper limits), each based around a generalised Wilcoxon test. For each of the three radio luminosity bins, the mean probability of drawing the radio–loud AGN sample out of the same parent population as the control sample of radio–quiet galaxies was greater than 25%. This proves that, at least for galaxies with these stellar masses, the emission line luminosity is independent of radio luminosity.
It is important to ascertain whether this result holds for all stellar masses and radio luminosities. The upper–left panel of Figure 7 shows the fraction of galaxies that are radio–loud AGN, as a function of stellar mass, for two different galaxy subsamples. The solid line shows for those galaxies classified as AGN by their emission–line properties. The dashed line shows the same thing for optically inactive galaxies. It is remarkable that not only do these relations show broadly the same mass dependence, but also the values of for the two subsamples agree almost perfectly at the highest masses. At stellar masses greater than , the probability that a galaxy is radio–loud is independent of whether it is classified as an emission–line AGN. This confirms that (low radio luminosity) radio and emission line AGN activity are two physically distinct and independent phenomena. At lower stellar masses the two lines appear to diverge, although a larger sample would be preferable to confirm that this result is statistically significant. If it is, it might indicate that at lower masses there is more overlap between the radio–loud and emission line AGN samples, possibly due to a population of radio–loud Seyferts galaxies where the production of jets and ionising radiation are linked (e.g. De Bruyn & Wilson 1978; Xu et al. 1999).
The independence of radio and optical activity for high mass galaxies still holds if the radio luminosity limit is raised to W Hz-1 (upper–right panel of Figure 7). Likewise the result remains unchanged if the comparison is restricted to optically powerful AGN, with emission line strengths above (lower–right panel of Figure 7). A small difference is seen if the radio luminosity limit is set as high as W Hz-1 (lower–left panel of Figure 7): the fraction of radio–loud AGN is then higher amongst optical AGN than amongst optically inactive galaxies. This is probably a consequence of the correlation between radio and emission line luminosities that sets in at high radio luminosities.

5 Radio and optical AGN activity as a function of environment
Best [2004] studied the environmental dependence of radio–loud AGN activity in the 2dFGRS. The fraction of radio–loud AGN was found to be largely independent of local galaxy density (as evaluated by the distance to the tenth nearest neighbour), although a dependence was found on the larger scale cluster / group / field environment. Further, when the 2dFGRS radio–loud AGN population was separated into subsets of emission–line AGN and optically inactive AGN, it was apparent that the two classes had different environmental dependences. In particular, the fraction of galaxies hosting radio–loud AGN with no emission lines increased towards richer environments.
The SDSS sample allows a detailed investigation of these results. Kauffmann et al. [2004] estimated the local environmental density of SDSS galaxies by deriving the number of galaxies () above a fixed absolute magnitude limit, within a 2 Mpc projected radius and a velocity of km s-1 of the galaxy under study. The top panel of Figure 8 shows the distribution of all galaxies, emission–line selected AGN, and radio–loud AGN brighter than W Hz-1, as a function of environmental parameter . To devire these distributions each galaxy has been weighted by the inverse of the volume in which it could have been detected (see K03 for a full discussion of how these were derived), and analysis has been restricted to only galaxies with stellar mass above , and redshift .

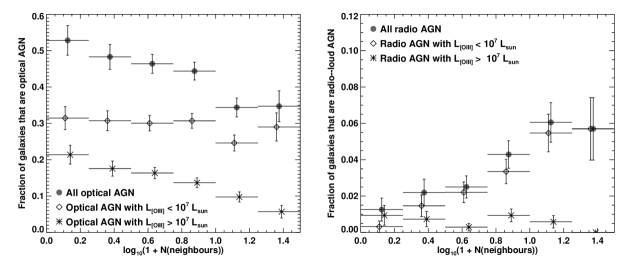
As found by Kauffmann et al. [2004] and also by Miller et al. [2003], the distribution of environments of the emission–line selected AGN is similar to that of normal galaxies. Kauffmann et al. showed that the fraction of low emission–line luminosity AGN (LINERS) is essentially independent of local galaxy density, but that for high emission–line luminosity AGN (mostly Seyferts), the AGN fraction is found to fall in regions of high galaxy density. These results are clearly demonstrated in the lower–left panel of Figure 8; this shows, for galaxies in the narrow range of stellar masses , the overall fraction of emission–line AGN as a function of environmental density, together with the split of this into high and low [OIII] 5007 emission line luminosity subsamples. There is only an environmental dependence for AGN with the highest emission line luminosities ().
The radio–loud AGN in the top panel of Figure 8 clearly favour denser environments than normal galaxies, with a much longer tail towards the richest environments. The lower–right panel of Figure 8 shows that the radio–loud AGN fraction increases significantly as a function of environment. Once again, large differences are seen if the sample is split by [OIII] emission line luminosity: those radio–loud AGN with the strongest emission lines (L[OIII]) preferentially avoid the densest regions.
This result indicates that environment, as well as black hole mass, may be an additional factor in determining whether a galaxy becomes a radio–loud AGN. A full investigation of environmental effects is beyond the scope of the current paper; a detailed study of these will be carried out in the third paper of this series (Kauffmann et al. 2005, in prep.)
6 Host galaxy properties of radio–loud AGN
In earlier sections of this paper it was shown that there is a strong dependence of the radio–loud AGN fraction on the stellar or black hole mass of the galaxy. In addition, at a given stellar mass, radio–loud AGN are biased towards galaxies with more massive bulges. In this Section, the host galaxies of radio–loud AGN are compared with those of emission–line selected AGN and inactive galaxies. The host galaxy properties that are considered are the 4000Å break strength , the concentration index , defined as where and are the radii containing 90% and 50% of the -band light of the galaxy, and the surface mass density . The 4000Å break strength provides a measure of the mean stellar age of the galaxy (cf. K03) and the and parameters allow investigation of its structure. Analysis is restricted to galaxies with , in order that the host galaxy parameters can be reliably determined.

Figure 9 compares the distribution of these parameters for all galaxies and for radio–loud AGN brighter than W Hz-1 at 1.4 GHz. Radio–loud AGN typically have large 4000Å break strengths, high concentration indices, and moderate–to–high stellar surface mass densities. None of these is particularly surprising since all of these parameters are tightly correlated with stellar mass (e.g. Kauffmann et al. 2003b). In order to remove this stellar mass dependence, Figure 10 shows the proportion of galaxies that are radio loud AGN as a function of both stellar and black hole mass, for three different bins of 4000Å break strength (top panels), concentration index (middle panels) and surface mass density (bottom panels).
At fixed stellar mass, is higher, at all stellar masses, for larger values of Dn(4000) and . This is another manifestation of the effect shown in Figure 1: at a given stellar mass, radio galaxies are preferentially located in galaxies with larger bulge-to-disk ratios, and these typically have older stellar populations and higher concentration indices. The dependence of on Dn(4000) and is much weaker at fixed black hole mass (i.e. fixed velocity dispersion ), which also supports this picture. Indeed, shows little dependence on either or in the upper two bins, and only differs for the (typically more disky) galaxies in the bins with and . This may be related to the secondary dependence of on environment discussed in the previous section: radio–loud AGN are preferentially located in rich environments and galaxies in high-density regions of the Universe tend to have older stellar populations and larger bulge-to-disk ratios.
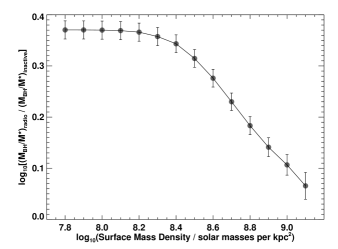
The lower–right panel of Figure 10 indicates that at fixed black hole mass, is higher for galaxies with lower stellar surface mass densities. Large sizes (low ), as well as extended envelopes (high ), appear to increase the probability of galaxies being radio–loud. Interestingly, these properties are typical of the central galaxies of groups and clusters, and it is well-known that the central galaxies of groups and clusters are frequently radio–loud AGN (e.g. Burns 1990). A higher radio–loud fraction for galaxies with this special location may therefore be an important factor in this result. However, given the relatively small number of such galaxies, it is not clear that this effect alone would be sufficient. An alternative possibility is that this is because if the radio lobes are confined by a dense medium then adiabatic expansion losses are reduced and consequently a radio source of given jet power is more radio luminous (cf. Barthel & Arnaud 1996, and references therein). For galaxies with lower and higher , the interstellar medium is spread over a larger physical radius (and may also be denser since, at least for spirals, galaxies with lower stellar surface mass densities are known to have have higher gas fractions; McGaugh & de Blok 1997). This means that an expanding radio source will be located in a denser environment for a longer period of time, which may boost the average radio luminosities (and possibly the lifetimes) of the sources located in these systems. In order to account for a factor 2–3 difference in radio–loud AGN fraction between galaxies with and , radio luminosities would need to be higher in the lower surface density galaxies by a factor of 3–4, or lifetimes longer by a factor 2–3. Detailed modelling is required to confirm whether such factors could be achieved.
Finally, it is interesting to note that in Section 4 it was demonstrated that radio and emission–line AGN activity are independent. It thus follows that radio–loud AGN with emission lines should be located in the same host galaxies as their radio–quiet counterparts. K03 found that emission–line AGN had similar structural parameters to inactive galaxies of the same stellar mass, but that the most optically luminous AGN had significantly lower 4000Å breaks. The dotted lines on Figure 9 show the contribution to the distribution of radio–loud AGN made by those that are also emission–line selected AGN. In both and these have very similar distributions to those of radio–loud AGN as a whole, but it is interesting to note that the long tail towards lower values of the distribution is almost entirely composed of these emission–line AGN. The fraction of galaxies that are emission–line radio–loud AGN thus exhibits little dependence on or , but an increase towards lower , exactly as found by K03 for radio–quiet objects.
7 Discussion and Conclusions
The main results of this paper are as follows:
-
•
The fraction of galaxies which host radio–loud AGN is a remarkably strong function of both stellar mass and black hole mass (as measured by the central stellar velocity dispersion). scales as and . This is in sharp contrast to the behaviour of the emission-line AGN fraction, which is largely independent of black hole mass.
-
•
The distribution of radio luminosities does not generally depend on black hole mass. The integral bivariate radio luminosity versus black hole mass function can be well approximated by a single function, with the fraction of galaxies which host radio–loud AGN brighter than luminosity scaling as with parameter values of , , , and W Hz-1. This function only breaks down when approaches 20–30%.
-
•
Within the range of radio luminosities studied in this paper, radio and emission-line AGN activity are independent of each other. At fixed high stellar masses, the probability that galaxy is a radio–loud AGN is not sensitive to whether it classified as an emission-line AGN.
-
•
At a fixed black hole mass, the host galaxies of radio–loud AGN are preferentially found in galaxies with higher concentration indices and lower surface mass densities, together with a possible weak trend to avoid the lowest 4000Å break strengths. Radio–loud AGN are also preferentially found within richer environments. It is possible that all of these results could be related to higher radio luminosities that result when the radio lobes are confined by denser gas.
A number of these results are broadly in line with what might have been expected, but others deserve some consideration.
7.1 Independence of radio and emission line AGN activity
The current study indicates that radio and emission line AGN activity are entirely independent at the radio luminosities studied; at higher radio luminosities it is well–known that radio and emission line luminosity are strongly correlated. It is probably a coincidence that the correlation begins exactly where the current data runs out of sources. However, it is interesting to note that at about this radio luminosity, W Hz-1, a fundamental transition occurs in the properties of radio sources. Above this radio luminosity most sources are FR II radio sources, whilst below that luminosity most are FR Is. This luminosity also corresponds roughly to the break () in the radio luminosity function.
The reason for the difference in radio properties between FR I and FR II sources is still a matter of much debate. One popular interpretation is that it may be due to qualitative differences in the properties of the central black hole, such as the accretion rate, accretion mode, or black–hole spin (e.g. Baum, Zirbel & O’Dea 1995). Alternatively, interactions with the host galaxy interstellar medium may be the dominant effect, such that for any given host galaxy only radio jets above a certain luminosity would be able to bore their way out through the interstellar medium without disruption (see Snellen & Best 2001 for a full discussion of the FR I–FR II dichotomy). Whatever the origin of this difference, the results of this paper suggest that for FR I type radio sources which dominate the SDSS radio source sample there is almost no correlation between radio and emission line luminosity. This indicates that there is a major difference in the way that these radio sources give rise to their line emission as compared to the more powerful FR IIs (see also Baum et al. 1995, Zirbel & Baum 1995).
It is unfortunate that the SDSS radio source sample does not contain many powerful FR II sources. FR II radio sources typically have luminous high ionisation emission line regions, and it would be very interesting to see whether their host galaxy properties are similar to those of other emission–line selected AGN. Indications from earlier studies indicate that they may be: Smith & Heckman [1989] showed that about 50% of nearby powerful FR II galaxies show morphological disturbances from pure elliptical profiles, indicative of galaxy interactions or mergers, and their optical colours are typically bluer suggesting recent star formation.
7.2 Mass dependence of radio and emission line AGN activity
Another interesting result of this paper is the fact that radio and optical AGN appear to trace very different populations of galaxies. Radio galaxies are preferentially located in the oldest, most massive galaxies, whereas emission line AGN are more spread out in mass.
Heckman et al. [2004] used the emission–line selected AGN to investigate the rate at which black holes are currently growing in galaxies of different masses. They determined how the (volume–weighted) integrated [OIII] 5007 line luminosity from all emission–line selected AGN is distributed across black hole mass, and compared this to how the total black hole mass is distributed. By taking the ratio of these two distributions, they showed that the average emission line luminosity output per unit black hole mass is highest at the lowest masses, and falls steeply towards high masses. The analysis of Heckman et al. [2004] is repeated in Figure 11, demonstrating essentially the same results (there is a global shift in the normalisation of the lower panel, compared to Heckman et al., because of the use of extinction–corrected [OIII] luminosities in this paper instead of the directly measured values used by Heckman et al.). Figure 11 also includes the equivalent plots for the distribution of integrated AGN radio luminosity across black hole mass (top panel), and the distribution of radio luminosity per unit black hole mass (lower panel). This clearly demonstrates that radio and emission–line luminosities are produced by black holes in very different mass ranges.

By converting emission line luminosities into approximate accretion rates (see their paper for details), Heckman et al. [2004] showed that at their current accretion rates, black holes of would grow to their current size in about a Hubble time, but the most massive black holes must have grown substantially faster in the past. If indeed the emission line luminosity is a good tracer of the accretion rate, then the low emission line luminosities of the radio–loud galaxies suggest that their black holes are currently in a very low accretion rate mode.
A few caveats should be mentioned, however. The observed emission line luminosity depends upon the ionising output of the AGN and upon the covering factor of the emission line clouds. Giant elliptical galaxies have a very low gas content, and so they may have lower emission line luminosities than would be expected for their level of ionising radiation. This can explain why the fraction of high luminosity emission–line AGN falls for the most massive galaxies. An additional factor is that radio sources may be accreting in a different mode to emission–line selected AGN (e.g. in advection dominated accretion flows rather than a standard thin disk). They may thus have larger accretion rates than optical AGN of the same emission–line luminosity.
It is unlikely, however, that most radio loud AGN are accreting at substantial rates, because this would imply an unacceptable level of black hole mass growth in massive galaxies at the present day. The global mass–doubling time for the black hole population at a given mass can be written as , where is the volume–averaged mass density in black holes, is the volume average radio luminosity density, and is an efficiency factor, given by , for the conversion of accreted mass energy to radio luminosity. The factor is thus the product of the efficiency of conversion of accretion mass energy into jet kinetic energy (), and the efficiency of conversion of this into radio luminosity (); Bicknell et al. [1995] estimate that for FR I radio sources, the total kinetic energy output of the radio jet is a factor of 100–1000 higher than the radio luminosity, and so –; this number is also confirmed by the observations of Bîrzan et al. [2004]. Taking to be at 1.4 GHz, Figure 11 implies that the mass–doubling time associated with the radio–loud AGN activity is years for black hole masses of , and even longer for smaller black holes. The black hole growth (and hence accretion rate) is only significant if the doubling time is shorter than the Hubble time, ie. if ; even given the result of Bicknell et al. this would still require an accretion efficiency . Note also that for a value of then the most powerful FR I sources, with W Hz-1 would have black hole growth rates of a few tens of solar masses per year (doubling times of a few years, corresponding roughly to Eddington limited accretion). This would require a substantial supply of gas and would be inconsistent with the hypothesis that the lack of observable emission lines was entirely due to the low gas content of the host galaxy.
The most likely interpretation is that these are giant elliptical galaxies with very massive black holes, which formed at early cosmic epoch and probably contributed to the peak in the quasar population at that time. Their current activity is associated with a very low accretion rate (albeit perhaps not as low as would be predicted by their emission line luminosities alone), which manifests itself in the form of low-power radio jets but rather little radiation at optical, ultraviolet and infrared wavelengths.
The proportion of massive galaxies that are found to be radio–loud AGN has important implications for the lifecycle of powerful radio sources. The ages of FR II sources can be estimated either by using synchrotron age–dating of the radio lobes (e.g. Liu, Pooley & Riley 1992) or directly measured hotspot advance speeds (e.g. Owsianik, Conway & Polatidis 1998), and these sources are believed to have lifetimes of typically a few years. At the radio luminosities of these sources, W Hz-1, the proportion of the highest stellar or black hole mass galaxies which are radio loud is only a few percent, meaning that each source would need to be re-triggered only once every one–to–few Gyrs. This is quite consistent with a relatively high accretion rate during the active period, which would account for the strong line emission of FR II sources. For the lower radio luminosity FR I sources, and even more so for sources where the entirety of the radio emission arises from the nucleus, the lifetimes of the radio sources are not known at all. The fact that % of the most massive galaxies are active, however, implies that however long these lifetimes are, the activity must be constantly re–triggered so that the galaxy spends over a quarter of its time in an active state.
In conclusion, emission–line selection of AGN largely picks out a population which traces the current growth of black holes. This is dominated by black holes of low and intermediate mass. Radio selection of AGN (at least at low radio luminosities) picks out the largely dormant population of the most massive black holes. These are two fundamentally different modes of black hole activity.
7.3 Origins of radio–loud AGN activity: gas cooling?
Burns [1990] showed that central massive galaxies in clusters or groups of galaxies with a cooling flow are much more likely to be radio–loud AGN than galaxies of similar mass not centred on a cooling flow, suggesting that concentrated cooling atmospheres can stimulate radio–loud AGN activity. Elliptical galaxies are surrounded by atmospheres of hot gas (see the review by Mathews & Brighenti 2003, and references therein) and it is intriguing that the rate at which gas cools out of these atmospheres has almost exactly the same dependence on black hole mass as has the radio–loud AGN fraction.
Consider a small region of gas, of proton density , volume and temperature . The mass cooling rate of this gas is proportional to the mass of the gas (, where is the proton mass), divided by the cooling time. The cooling time is given by the total energy of the gas () divided by the rate at which energy is radiated away; since much of the cooling occurs at X–ray wavelengths, the energy radiation rate is roughly proportional to the X–ray luminosity of that region (). Therefore, the mass cooling rate of gas within volume is given by:
Integrating over the entire envelope of the elliptical, if the atmosphere is isothermal then the total mass cooling rate is given by , where is the total X–ray luminosity of the elliptical. For an isothermal gas then , where is the velocity dispersion. Also, for luminous ellipticals (which represent those in which radio sources are found) the X–ray luminosity is observed to vary as the square of the optical luminosity, [2001, 2003]. The Faber–Jackson relation dictates that the optical luminosity goes as , and therefore . Note that Mahdavi & Geller [2001] have confirmed that elliptical galaxies do indeed show such a tight correlation between their X–ray luminosity and velocity dispersion (the exponent that they derive observationally from a 57–galaxy sample is ).
These relations, together with the black hole mass versus velocity dispersion relation, , give the following:
This is within the range of the exponent derived for the radio–loud AGN fraction dependence on black hole mass, and suggests that for these low power radio sources the fueling of the AGN activity may be related to the cooling for gas out of the hot atmospheres of the host galaxies. In terms of numbers, for a elliptical the actual cooling rate implied by the above calculation is of order a solar mass per year (although observations suggest that the actual cooling rates are lower; see Mathews & Brighenti 2003 and references therein). For the radiative accretion efficiency of , corresponding to the ratio between radio luminosity and total jet kinetic energy suggested by Bicknell et al. [1995], only yr-1 of gas is required to fuel the AGN, so cooling could easily provide enough gas.
7.4 The role of AGN feedback
There has been much interest recently in the question of whether the heating effect of AGN activity can balance the cooling of the gas, and thus whether AGN activity, particularly radio–loud AGN activity, can play an important feedback role. This has largely been motivated by the observed effects of radio–loud AGN on their environments at galaxy cluster scales (e.g. Fabian et al. 2003), but may be equally important in the haloes of individual galaxies (cf. Mathews & Brighenti 2003).
The rate at which energy is radiated from the hot atmosphere is proportional to the X–ray luminosity, which as shown above goes as . If feedback is to work then the time–averaged rate at which the AGN inputs energy back into its environment must balance that. This depends upon the fraction of time for which the AGN is active multiplied by the energy output of the AGN when it is active. If it is assumed that all galaxies of given black hole mass go through a radio-loud AGN phase, then the fraction of time for which an AGN is on is simply given by , which increases as . In this paper it has been shown that the radio luminosity of a radio–loud AGN is essentially independent of black hole mass. Thus, if radio luminosity were a direct measure of the energy output of an AGN, the time–averaged heating rate of AGN would go as .
In fact, radio luminosity is not a direct measure of the kinetic energy input into the radio jets, since numerous other environmental factors play a role. A robust calculation of the energy input rate of the AGN is not possible, due to a lack of knowledge of the lifetimes and radiative efficiencies of FR I type sources. However, using the FR II sources as a basis, the argument below demonstrates that the time–averaged heating may well go as a higher power of black hole mass, and thus that a balance between AGN heating and gas cooling in these radio–loud AGN is feasible.
For FR II radio sources, models of the growth of the radio sources (e.g. Kaiser et al. 1997a,b; Snellen et al. 2000) show that for a fixed jet kinetic energy input, once the source has expanded beyond the central core of the galaxy ( kpc; this happens on a timescale of years) then the radio luminosity falls as the source expands into a progressively lower density environment. For most reasonable assumptions, the radio luminosity is expected to fall roughly as the size of the source () to a power between and . For a radial density distribution of , Kaiser et al. [1997] show that the size of the source grows with time as , and argue that has a value of a little below 2. Therefore, the radio luminosity of FR II sources falls off with age roughly as , so for a given radio source the observed radio luminosity needs to be multiplied up by a factor of age0.4 in order to derive the intrinsic jet power, and hence the energy output of the AGN. The fraction of radio–loud AGN is higher in galaxies with more massive central black holes, and (again assuming that all galaxies of given black hole mass go through a radio–loud AGN phase) this could either be because the AGN in these galaxies are re-triggered more often, or because when they are triggered they live longer; the current data cannot distinguish between these two possibilities. If this is entirely due to longer lifetimes, then the average age of the radio sources observed will be proportional to their lifetime, which in turn will be proportional to the fraction of time that a black hole of that mass is active, ie age . Therefore, for sources of a given radio luminosity, the energy output of the AGN will scale as age. Multiplying this by the fraction of time for which the AGN is active, the energy output scales as . This is comparable to (or greater than) that required to counterbalance the gas cooling.
Many aspects of this calculation are uncertain; in particular, if the higher fraction of radio–loud AGN in more massive galaxies is due to more frequent re-triggering rather than longer lifetimes then the extra factor is lost. Also, it is not known whether the luminosity evolution of FR I sources with time follows that of the FR IIs, although for the extended sources a similar principal of decreasing luminosity as the source expands into lower densities is expected to apply. However this calculation does demonstrate that a balance between AGN heating and gas cooling in these radio–loud AGN is certainly possible.
A final intriguing observation is that if the radio–loud AGN fraction versus stellar mass and black hole mass relations are extrapolated upwards (noting that the flattening off at high masses in the latter relation is likely to be due to errors in the black hole mass estimates), then at a stellar mass of or a black hole mass of essentially 100% of galaxies would be radio loud. This means that any galaxy of such a mass must be radio–emitting at all times. Is it a co-incidence that these masses correspond roughly to the most massive galaxy and the most massive black hole that exist in the nearby Universe? Could the very presence of this continual radio source activity be the reason why galaxies do not grow any larger?
Acknowledgements
PNB would like to thank the Royal Society for generous financial support through its University Research Fellowship scheme. JB acknowledges receipt of an ESA post-doctoral fellowship. The research makes use of the SDSS Archive, funding for the creation and distribution of which was provided by the Alfred P. Sloan Foundation, the Participating Institutions, the National Aeronautics and Space Administration, the National Science Foundation, the U.S. Department of Energy, the Japanese Monbukagakusho, and the Max Planck Society. The research uses the NVSS and FIRST radio surveys, carried out using the National Radio Astronomy Observatory Very Large Array: NRAO is operated by Associated Universities Inc., under co-operative agreement with the National Science Foundation. The authors thank the referee, Chris Simpson, for a number of helpful suggestions.
References
- [1993] Antonucci R., 1993, ARA&A, 31, 473
- [2002] Archibald E. N., Dunlop J. S., Jimenez R., Fraica A. C. S., McLure R. J., Hughes D., 2002, MNRAS, 336, 353
- [1977] Auriemma C. G., Perola G., Ekers R., Fanti R., Lari C., Jaffe W., Ulrich M., 1977, A&A, 57, 41
- [2004] Bîrzan L., Rafferty D. A., McNamara B. R., Wise M. W., Nulsen P. E. J., 2004, ApJ, 607, 800
- [1981] Baldwin J. A., Phillips M. M., Terlevich R., 1981, PASP, 93, 5
- [1996] Barthel P. D., Arnaud K. A., 1996, MNRAS, 283, L45
- [1995] Baum S. A., Zirbel E. L., O’Dea C. P., 1995, ApJ, 451, 88
- [1995] Becker R. H., White R. L., Helfand D. J., 1995, ApJ, 450, 559
- [2004] Best P. N., 2004, MNRAS, 351, 70
- [2005] Best P. N., Kauffmann G., Heckman T. M., Ivezić Ž. 2005, MNRAS, submitted
- [1995] Bicknell G. V., 1995, ApJ Supp., 101, 29
- [1993] Böhringer H., Voges W., Fabian A. C., Edge A. C., Neumann D. M., 1993, MNRAS, 264, L25
- [2004] Brinchmann J., Charlot S., Heckman T., Kauffmann G., Tremonti C., White S. D. M., 2004, astro-ph/0406220
- [1990] Burns J. O., 1990, AJ, 99, 14
- [2004] Cao X., Rawlings S., 2004, MNRAS, 349, 1419
- [2001] Colless M. M. et al. 2001, MNRAS, 328, 1039
- [1998] Condon J. J., Cotton W. D., Greisen E. W., Yin Q. F., Perley R. A., Taylor G. B., Broderick J. J., 1998, AJ, 115, 1693
- [1978] De Bruyn A. G., Wilson A. S., 1978, A&A, 64, 433
- [1999] Fabian A. C., 1999, MNRAS, 308, L39
- [2003] Fabian A. C., Sanders J. S., Allen S. W., Crawford C. S., Iwasawa K., Johnstone R. M., Schmidt R. W., Taylor G. B., 2003, MNRAS, 344, L43
- [1974] Fanaroff B. L., Riley J. M., 1974, MNRAS, 167, 31P
- [2004] Ferrarese L., Ford H., 2004, astro-ph/0411247
- [2000] Ferrarese L., Merritt D., 2000, ApJ, 539, L9
- [2000] Gebhardt K. et al. 2000, ApJ, 539, L13
- [2004] Häring N., Rix H.-W., 2004, ApJ, 604, L89
- [2005] Hao L. et al. 2005, AJ, in press; astro-ph/0501059
- [1990] Hartwick F. D. A., Schade D., 1990, ARA&A, 28, 437
- [2004] Heckman T. M., Kauffmann G., Brinchmann J., Charlot S., Tremonti C., White S. D., 2004, ApJ, 613, 109
- [1979] Hine R. G., Longair M. S., 1979, MNRAS, 188, 111
- [1997] Kaiser C. R., Alexander P., 1997, MNRAS, 286, 215
- [1997] Kaiser C. R., Dennett-Thorpe J., Alexander P., 1997, MNRAS, 292, 723
- [2004] Kauffmann G., White S. D. M., Heckman T. M., Ménard B., Brinchmann J., Charlot S., Tremonti C., Brinkmann J., 2004, MNRAS, 353, 713
- [2003a] Kauffmann G. et al. 2003a, MNRAS, 346, 1055
- [2003b] Kauffmann G. et al. 2003b, MNRAS, 341, 33
- [2003c] Kauffmann G. et al. 2003c, MNRAS, 341, 54
- [2003] King A., 2003, ApJ, 596, L27
- [1995] Kormendy J., Richstone D., 1995, ARA&A, 33, 581
- [1992] LaValley M., Isobe T., Feigelson E., 1992, BAAS, 24, 839
- [1996] Ledlow M. J., Owen F. N., 1996, AJ, 112, 9
- [1992] Liu R., Pooley G., Riley J. M., 1992, MNRAS, 257, 545
- [1998] Magorrian J., Tremaine S., Richstone D., Bender R., Bower G., Dressler A., Faber S., Gebhardt K., Green R., Grillmair C., Kormendy J., Lauer T., 1998, AJ, 115, 2285
- [2001] Mahdavi A., Geller M. J., 2001, ApJ, 554, L129
- [2003] Marconi A., Hunt L. K., 2003, ApJ, 589, L21
- [2003] Mathews W. G., Brighenti F., 2003, ARA&A, 41, 191
- [1964] Matthews T. A., Morgan W. W., Schmidt M., 1964, ApJ, 140, 35
- [1993] McCarthy P. J., 1993, ARA&A, 31, 639
- [1997] McGaugh S. S., de Blok W. J. C., 1997, ApJ, 481, 689
- [2003] Miller C. J., Nichol R. C., Goméz P. L., Hopkins A. M., Bernardi M., 2003, ApJ, 597, 142
- [2001] O’Sullivan E., Forbes D. A., Ponman T. J., 2001, MNRAS, 328, 461
- [1998] Owsianik I., Conway J. E., Polatidis A. G., 1998, A&A, 336, L370
- [1991] Rawlings S., Saunders R., 1991, Nat, 349, 138
- [1989] Rawlings S., Saunders R., Eales S. A., Mackay C. D., 1989, MNRAS, 240, 701
- [1989] Sadler E. M., Jenkins C. R., Kotanyi C. G., 1989, MNRAS, 240, 591
- [2002] Sadler E. M. et al. 2002, MNRAS, 329, 227
- [1988] Sanders D. B., Soifer B. T., Elias J. H., Neugebauer G., Matthews K., 1988, ApJ, 328, L35
- [1998] Silk J., Rees M. J., 1998, A&A, 331, L1
- [2005] Simpson C., 2005, MNRAS, in press; astro-ph/0503500
- [1989] Smith E. P., Heckman T. M., 1989, ApJ, 341, 658
- [2000] Snellen I. A. G., Schilizzi R. T., Miley G. K., de Bruyn A. G., Bremer M. N., Röttgering H. J. A., 2000, MNRAS, 319, 445
- [2002] Stoughton C. et al. 2002, AJ, 123, 485
- [2002] Tremaine S. et al. 2002, ApJ, 574, 740
- [2004] Tremonti C. A., Heckman T. M., Kauffmann G., Brinchmann J., Charlot S., White S. D. M., Seibert M., Peng E. W., Schlegel D. J., Uomoto A., Fukugita M., Brinkmann J., 2004, ApJ, 613, 898
- [2004] Wills K. A., Morganti R., Tadhunter C. N., Robinson T. G., Villar-Martín M., 2004, MNRAS, 347, 771
- [1999] Xu C., Livio M., Baum S., 1999, AJ, 118, 1169
- [2000] York D. G. et al. 2000, AJ, 120, 1579
- [1995] Zirbel E. L., Baum S. A., 1995, ApJ, 448, 521