Chandra Study of X-Ray Point Sources in the Early-Type Galaxy NGC 4552 (M89)
Abstract
We present a Chandra ACIS study of the early-type galaxy NGC 4552. We detect 47 X-ray point sources, most of which are likely low mass X-ray binaries (LMXBs), within 4 effective radii (). The brightest X-ray source coincides with the optical, UV and radio center of the galaxy, and shows variability on hr timescales, indicating the possible existence of a low-luminosity AGN. The 46 off-center sources and the unresolved point sources contribute about 29% and 20% to the total luminosity of the galaxy, respectively. We find that, after correcting for the incompleteness at the low luminosity end, the observed cumulative X-ray luminosity function (XLF) of the off-center sources is best fit by a broken power-law model with a break at ergs s-1. We identified 210 globular clusters (GCs) candidates in a HST WFPC2 optical image of the galaxy’s central region. Of the 25 off-center LMXBs that fall within the WFPC2 field of view, 10 sources are coincident with a GC. Thus the fraction of the GCs hosting bright LMXBs and the fraction of the LMXBs associated with GCs are 4.8% and 40%, respectively. In the and bands, the GCs hosting bright LMXBs are typically 1–2 magnitudes brighter than the GCs with no detected LMXBs. There are about times as many LMXBs in the red, metal-rich GCs as there are in the blue, metal-poor ones. We find no obvious difference between the luminosity distributions of LMXBs in GCs and in field, but the cumulative spectrum of the LMXBs in GCs tends to be softer than that of the LMXBs in field. We detected three X-ray sources that have isotropic luminosities larger than erg s-1. The one located in the joint Chandra-HST field is found to be associated with a GC. By studying the ACIS spectra we infer that the this may be a candidate black hole system with a mass of 15–135 . One of the other sources with a luminosity brighter than erg s-1 reveals temporal variations in brightness on timescales greater than an hour.
1 INTRODUCTION
Elliptical and S0 galaxies are luminous sources in the X-ray sky (e.g., Forman et al. 1985). In terms of their X-ray-to-optical luminosity ratios, these early-type galaxies can generally be divided into two categories: X-ray bright galaxies and X-ray faint galaxies. Both X-ray faint and X-ray bright galaxies reveal a hard X-ray component whose intensity is roughly proportional to the optical luminosity of the galaxy. In X-ray bright early-type galaxies, the hard spectral component is often overwhelmed by the emission of the hot diffuse gas. However the hard X-ray component appears to be significant in X-ray faint galaxies and, in some cases, dominates the X-ray spectrum. Trinchieri and Fabbiano (1985) and other later studies of the non-thermal emission ascribed it to the contribution of a large number of low mass X-ray binaries (LMXBs), such as observed in the bulges of M31 and our Galaxy (e.g., White et al. 1995). With the advent of the high spatial resolution observations of the Chandra X-ray observatory, hundreds of point sources have been resolved in a number of nearby elliptical and S0 galaxies and the LMXB-origin has been confirmed (e.g., Sarazin et al. 2000).
Most of the resolved X-ray point sources in early-type galaxies are likely LMXBs and they may be useful in deciphering the evolutionary history of their host galaxies and stars therein, and constraining our understanding of the physics of compact stars. In the past few years Chandra observations have revealed that the X-ray luminosities of the resolved point sources in early type galaxies span a wide range from the typical observational limit of a few erg s-1 to over erg s-1 (e.g., Sarazin et al. 2000; Angelini et al. 2001; Kundu et al. 2002). The observed XLFs show quite similar, but not exactly the same profiles among galaxies. For example, in NGC 4697, Sarazin et al. (2000) reported that there is a knee on the XLF at around the Eddington luminosity of normal accreting neutron stars with a mass ( ergs s-1), and thus suggested that the break might be an universal feature that can be used as a distance indicator. The existence of a similar break was confirmed by Kundu et al. (2002) in NGC 4472 and by Blanton et al. (2001) in NGC 1553. However, by analyzing a sample of 14 E/S0 galaxies, Kim and Fabbiano (2004) argued that the position of the break is significantly higher than of normal neutron stars. In NGC 720, Jeltema et al. (2003) showed an even higher break at ergs s-1 (although this is based on a distance derived from an adopted of 50 km s-1 Mpc-1). Similar breaks or upper cutoffs at substantially high luminosities have been found by Sivakoff et al. (2003) in NGC 4365 and NGC 4382, and by Jordn et al. (2004) in M87, M49 and NGC 4697. Moreover, in NGC 1600 Sivakoff et al. (2004) found that the break is not needed to fit the observed XLF. The obvious disagreements between these works cast doubts on the feasibility of using as a reliable standard candle for distance determinations.
On the other hand, it has been revealed that in early-type galaxies about 4% of the GCs host bright LMXBs, and about 18–70% of the resolved LMXBs are found to be associated with GCs with a preference on the optically brighter and redder ones (e.g., Kundu et al. 2002; Sarazin et al. 2000, 2001, 2003). In most cases, such a correlation with color is attributed to metallicity (Kundu et al. 2003). These results imply that GCs are an efficient breeding ground for LMXBs, as it is true in our own Galaxy (Katz 1975; Clark 1975). The origin of the LMXBs that are not associated with GCs (field LMXBs) is still unclear. It has been speculated in many published papers (e.g., Kundu et al. 2002, Maccarone et al 2003) that the majority of them may be an ejected GC population, or have been left in the field after GC disaggregation. Still, the possibility that they are a true field population and were actually formed in situ cannot be ruled out at present (Maccarone et al. 2003). The comparisons between the X-ray properties of the GC LMXBs and field LMXBs should help answer the question. As of today, it appears that in some cases the difference between the spectra of GC LMXBs and field LMXBs is almost undistinguishable in the X-ray band, strongly supporting a similar origin. The only exception may be NGC 4472, for which Maccarone et al. (2003) showed that the GC LMXBs tend to be slightly harder.
In this paper, we present a Chandra study of the X-ray point source population in the X-ray bright galaxy NGC 4552 (M89). NGC 4552 is located at (Smith et al. 2000) in the Virgo cluster. It is usually classified as an elliptical galaxy, although in some cases (e.g., Ferrari et al. 1999) it is considered a S0. It is also a bright radio source, with a strong compact core and a relatively flat spectrum (Filho et al. 2000; Wrobel & Heeschen 1984). HST observations show that from 1991 to 1996 the intensity of the central, unresolved source of this galaxy changed by a factor of several in the near UV band, along with the appearance of some UV/optical emission lines (Renzini et al. 1995; Cappellari et al. 1999). This indicates that NGC 4552 harbors a mini-AGN at the center, as has been inferred in the X-ray band by Colbert and Mushotzky (1999) who studied the nuclear source with ROSAT and ASCA. Throughout this paper, by assuming the Hubble constant to be = 70 km s-1 Mpc-1 (O’Sullivan et al. 2001 and references therein) we adopt a distance to NGC 4552 of 17.1 Mpc, which is slightly larger than that derived by infrared surface brightness fluctuation analysis ( Mpc; Tonry et al. 2001). We quote errors at the 90% confidence level unless mentioned otherwise.
2 OBSERVATION AND DATA REDUCTION
NGC 4552 was observed on April 22–23, 2001 with the CCD 2, 3, 6, 7 and 8 of the Chandra Advanced CCD Imaging Spectrometer (ACIS) for a total exposure of 56.8 ks. The center of the galaxy was positioned on the ACIS S3 chip (CCD 7) with an offset of from the nominal pointing for the S3 chip, so the entire galaxy was covered by the S3 chip. The CCD temperature was C. The events were telemetried in the Very Faint mode, and the data were collected with frame times of 3.1 s. In the analysis that follows, we used the CIAO 2.3 software to process the data acquired from the S3 chip only. In order to use the latest calibration, we started with the Level-1 data. We only kept events with ASCA grades 0, 2, 3, 4, and 6, and removed bad pixels, bad columns, and columns adjacent to bad columns and node boundaries. In order to identify occasional intervals of high background (“background flares”), whose effects are particularly significant on the backside-illuminated S1 and S3 chips, we extracted and examined lightcurves of the background regions on the S3 chip in 2.5–7 keV where the background flares are expected to be most visible. We found that the detected intervals contaminated by the particle events that raise the count rate to over 20% more than its mean value is less than 9% of the total exposure. We have excluded these intervals and used a net exposure time of 52.2 ks in our analysis. Also we corrected the aspect offset of the observation (R.A. = and Dec. = ).
We limited the spectral analysis to the keV energy band in order to avoid the effects of calibration uncertainties at lower energies and instrumental background at higher energies. We extracted all of the spectra in the pulse height-invariant (PI) channels, and performed model fittings with XSPEC v11.2.0. Because there has been a continuous degradation in the ACIS quantum efficiency (QE) since launch, we applied ACISABS to correct the created ARF files before using them to fit the spectra.
3 X-RAY IMAGE
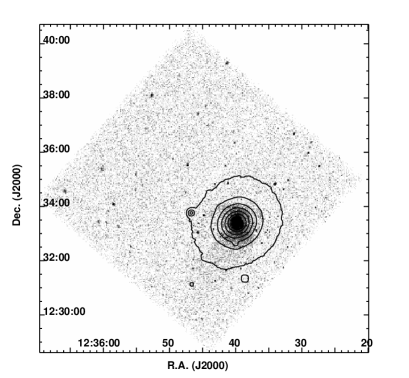
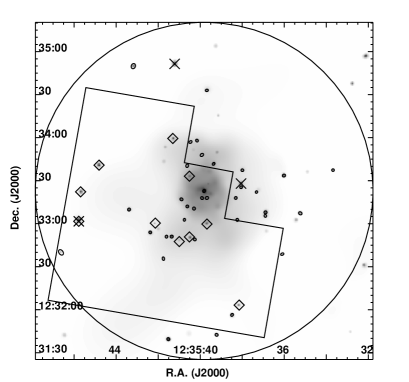
In Figure 1, we show the raw Chandra image of NGC 4552 in 0.3–10 keV, which has not been corrected for either exposure or background. For a comparison, we overlap the DSS optical intensity contours on the X-ray image. It can be clearly seen that the spatial distribution of the X-ray emissions is nearly symmetric within about 9′′ (0.7 kpc). Outside the nuclear region the distribution of the X-rays is elongated roughly in the north-south direction out to about 50′′ (4.1 kpc), where it does not follow the profile of the optical light. In the region about east of the center there is a lack of diffuse X-ray emission. In Figure 2, we show the smoothed X-ray image with a minimum significance of 3 and a maximum significance of 5. In the figure we use a large circle to indicate the region within the 4 effective radii (4 ), where 1 or 2.4 kpc (de Vaucouleurs et al. 1992). The locations of the detected X-ray point sources are also marked, which show a clear tendency to concentrate toward the center. The details of the detection and analysis of these point sources are presented in §4. There is a lack of diffuse X-rays in the region about east of the center, while the region about south-west of the center lacks bright X-ray point sources.
We find that the Chandra X-ray position of the central point source (Src 1; see §4.6), the brightest one in the field as well as the peak of the diffuse X-ray emission, coincides with the optical/IR center of the galaxy (Monet et al. 1998; Cutri et al. 2003) within . This is the X-ray counterpart of the mini-AGN identified through its UV/optical activity (Cappellari et al. 1999). We do notice that by using the ROSAT HRI data Colbert and Mushotzky (1999) reported an offset of between the position of the compact X-ray source in the nuclear region and the position of the optical photometric center of the galaxy. But since this offset is much smaller than the uncertainty of the ROSAT HRI positioning, which is typically , our results are not in conflict. Moreover, the Chandra X-ray position of the central source is also in good agreement with the position of the central radio source (Nagar et al. 2002) to within about .
4 X-RAY POINT SOURCES
4.1 Detections
We detected X-ray point sources on the ACIS S3 image using the CIAO tool celldetect. The default signal-to-noise threshold for source detection was set to be 3, and the energy range used for detection was restricted to 0.3–10 keV for better statistics. We have cross-checked the results both by using the CIAO tool wavdetect and by eye in either the 0.3–10 keV or 0.7–7 keV images. We detected a total of 79 sources that exceeded the detection threshold. Of these, 47 lie within the 4 region. We estimate that the minimum detection for a point source is approximately counts s-1 (16 counts for 52.2 ks) at . Notice that this value is higher than that in Sivakoff et al. (2003) and Sarazin et al. (2001) by about 45% and 33%, respectively. By reducing the signal-to-noise threshold down to 2.7, 5 more sources can be detected within the 4 region. Based on visual inspection two of them are clearly fake because the photon distribution within the detection cell does not follow that of a point source. Considering the large uncertainties due to the sample incompleteness for very faint sources, in this paper we conservatively adopt a signal-to-noise threshold of 3 and focus our study on the 47 sources within the 4 region. We list the properties of all 47 sources in Table 1, where we sort them in the order of increasing projected distance d from the center of the galaxy. We arrange the columns as follows: (1) source number; (2)-(3): right ascension and declination (J2000); (4) projected distance d from the center of the galaxy; (5) count rate and its error; (6) significance of the detection; (7) intrinsic X-ray luminosity , assuming the source is located at the distance of NGC 4552 and only subjected to the Galactic absorption ( cm-2; Dickey & Lockman, 1990; see §4.5); (8)-(9): hardness ratios (see §4.3); and (10) notes.
4.2 Variability of Sources
We extracted the lightcurves for each of the 47 point sources over the duration of the Chandra observation, excluding the intervals of strong background flares. The extractions were made in 0.3–10 keV for better statistics, since we found that after correcting for the background the results obtained in this energy band are consistent with those obtained in 0.7–7 keV. We calculated the Kolmogoroff-Smirov (KS) statistic for each of the lightcurves against the null hypothesis that the count rate of the source plus the background is uniform over the effective exposure time. If the count rate is temporally invariant, the cumulative fraction of the count is expected to be a diagonal from 0 to 1. We find that two sources, Src 15 (174 counts) and Src 28 (107 counts), have a less than 5% probability of being invariable. In order to examine if these results are caused by local background fluctuations, we also applied the KS test to the lightcurves extracted from the background regions adjacent to the two sources. In neither case can we find any significant temporal variability in the background. Therefore, we conclude that both sources are intrinsically variable. Assuming that they are at the distance of NGC 4552 and using the best-fit absorbed power-law spectral model for all the resolved sources (§4.4), we estimate that Src 15 and Src 28 have luminosities of ergs s-1 and ergs s-1, respectively. In Figure 3, we present their background-corrected lightcurves that show clear variations on hr timescales, together with the lightcurve of the central source (Src 1), which is the brightest one in the field. In terms of the KS test, the temporal variability of Src 1 is less significant than Src 15 and Src 28. This is likely because K-S tests are most sensitive around the median value of the independent variable. However, a visual examination of the lightcurve suggests that it is variable on timescales of about 1 hr or more, with flux variations of about . We attempted Fourier analysis techniques to detect any potential periods on minute-hour timescales for Src 1, 15 and 28. No statistically meaningful periodicity is found in any of the sources.
4.3 X-Ray Hardness Ratios
As the count rates of the resolved point sources are typically quite low directly analyzing the spectrum of the sources by fitting models is not practical. Instead we study the hardness ratios. Following Sarazin et al. (2000) and other authors, we measured the background-subtracted counts for each of the 47 resolved sources in three energy bands: soft (S), 0.3–1.0 keV; medium (M), 1.0–2.0 keV; and hard (H), 2.0–10.0 keV and calculated the hardness ratios R21 and R31 using the definitions R21 = (M S)/(M + S) and R31 = (H S)/(H + S), respectively. We list the calculated hardness ratios and their 1 errors, which are very large in general, in columns 8 and 9 of Table 1, and plot R31 versus R21 for all the sources in Figure 4. Only the typical 1 error bars are illustrated in order not to complicate the figure. In the same figure, we also show the predicted hardness ratios for an absorbed power-law model with different column densities and photon indices . It can be seen in that most of the sources are located in a diagonal band from (, ) to (+0.757, +0.837). We note that these colors are similar to those found in the X-ray bright elliptical galaxy NGC 720 (Jeltema et al. 2003) and NGC 4649 (Randall et al. Irwin 2004). Three sources, i.e., Src 17 (+0.678, +0.372), Src 31 (+0.757, +0.837), and Src 45 (+0.702, +0.436), appear to have been absorbed by a column density larger than the Galactic value. Since they are all located far away from the center of the galaxy (), they are probably unrelated background AGNs. However, we find that the hardness ratios of Src 17 and Src 45 cannot be reproduced by using a simple absorbed power-law spectral model, which is not in agreement with the spectrum of the hard X-ray cosmic background (Mushotzky et al. 2000). The brightest source in the field (Src 1) is located at the nucleus of the galaxy and has the X-ray color (R21, R31) = (, ). Unlike in NGC 720 (Jeltema et al. 2003) and NGC 4649 (Randall et al. 2004), we found no supersoft sources (SSSs) in NGC 4552. Within the 4 region the total X-ray emission (diffuse emission plus all the resolved point sources) of the galaxy has a hardness ratio of (R21, R31) = (, ), as compared to the (R21, R31) = (, ) hardness ratio for the resolved sources and (R21, R31) = (, ) for the unresolved diffuse emission from the gas plus unresolved point sources (see also §4.4).
4.4 Spectral Properties
Within the 4 region, there are 12 X-ray point sources (Src 1, 2, 6, 8, 11, 15, 24, 28, 37, 41, 43 and 46) each having more than 100 counts. We have extracted and studied the individual spectra of these bright sources. Among them, Src 1 is the brightest and coincides with the mini-AGN identified in the UV/optical bands (Cappellari et al. 1999). We will present detailed analysis of its spectrum separately in §4.6. We divide the rest of sources with less than 100 counts into four groups (Table 2). Sources in group A are the hardest ones that appeared at the top of Figure 4. Sources in group B are those for which the Galactic column density is required when an absorbed power-law model is applied to describe their hardness ratios, while for sources in group C a larger column density is needed. The rest of the sources are in group D. We have extracted and studied the cumulative spectra of each of the four groups, as well as that of all the resolved sources (excluding Src 1). In the model fittings, the background spectra were extracted from the local background fields adjacent to the regions where the source spectra were extracted. The fitting results are summarized in Table 2. As can be seen, excluding the central source, the cumulative spectrum of all resolved sources within the 4 region can be fitted best by an absorbed power-law model with a photon index of when the column density is fixed to the Galactic value. The deduced intrinsic luminosity of all the resolved sources in 0.3–10 keV is ergs s-1, assuming that the sources are all at the distance of NGC 4552.
We also attempted to separate the emission of the unresolved point sources from the hot diffuse gas. In order to do this we extracted the spectrum of the total diffuse emission by excluding all resolved point sources. The background for this spectrum was extracted on the S3 chip as far away as possible from the galaxy. To fit the spectrum, we used a thermal component (apec model) to represent the contribution of the hot plasma, and a non-thermal component (power-law model) to represent the emission from the unresolved point sources, under the assumption that the hard spectral component seen in the diffuse emission is mainly due to the LMXBs. Both spectral components are subjected to a common absorption . Because we find that when is free the obtained value is only slightly lower than, but still consistent with the Galactic value, we simply fix to the Galactic value. We fixed the power-law photon index of the hard component to the value of 1.56 measured for the cumulative spectrum of all resolved sources; allowing the photon index to vary did not improve the fit. The best-fit gas temperature is found at keV, and the calculated luminosity of the total diffuse emission in 0.3–10 keV is ergs s-1, of which about 31%, or ergs s-1, can be ascribed to the unresolved point sources. If calculated in count flux, the contribution of the unresolved sources is about 20%. Thus, by adding the emissions of both resolved and unresolved point sources together, we estimate that in 0.3–10 keV the LMXBs contribute about 48% of the galaxy’s total luminosity, or about of the total count flux.
Next we fit the cumulative spectra of the four groups of resolved point sources with an absorbed power-law model and list the results in Table 2. We find that for group A the obtained photon index is if the column density is fixed to the Galactic value. The goodness of fit is marginally acceptable at . When we allow the column density to vary, the fit can be improved significantly () in terms of the F-test which yields a best-fit photon index of , and a large absorption of cm-2. The spectra of group B and C can be well fit by the absorbed power-law model with and , respectively, when is fixed to the Galactic value for group B and allowed to vary for group C. The spectrum of group D appears to be complicated and cannot be easily explained by using an one-component spectral model.
4.5 X-Ray Luminosity Function
Based on the best-fit power-law model for the cumulative spectrum of all resolved sources within the 4 region (excluding the central source; ), we convert the observed count rates of the 46 off-center sources into unabsorbed 0.3–10 keV luminosities, assuming that the sources are all at the distance of NGC 4552. The conversion factor is ergs cts-1, and the resulting luminosities range from to ergs s-1. With these results we construct the XLF, in which the central source is not included.
First, we fit the observed cumulative XLF that is not corrected for the effect of incompleteness at the faint end of the luminosity function. We use the maximum-likelihood method and determine the 90% confidence errors by performing Monte-Carlo simulations. Based on deep Chandra observations of blank fields (Mushotzky et al. 2000), we estimate that within the 4 region of NGC 4552, of the 47 detected point sources are expected to be unrelated background/foreground X-ray sources. In the fittings, we perform Monte-Carlo simulations to simulate the contribution of these background/foreground sources accordingly. We adopt either a single or a broken power-law model to fit the XLF. The single power-law profile is expressed as
| (1) |
where is the 0.3–10 keV luminosity in units of ergs s-1. The broken power-law profile can be expressed in the form of Eq.(1) at the high and low luminosities with different slopes and , respectively. In the single power-law fitting, we obtain a slope . However, the fit is poor with a probability of that the data and model are drawn from the same distribution. It overestimates the data at high luminosities and underestimates it at low luminosities. On the other hand, the broken power-law model can significantly improve the fit (). The obtained break luminosity is at ergs s-1, and the two slopes are and , respectively.
Next we examine the effect of incompleteness at the faint end of the observed XLF by adopting a method similar to that outlined in Kim and Fabbiano (2004). With the use of the MARX package (Wise et al. 2003) we run a series of Monte-Carlo simulations to create fake X-ray point sources in NGC 4552 with given luminosities that cover the observed XLF’s range, and then determine how many of them can be detected with the same technique described in §4.1. We assume that the radial distribution of the fake sources at a given luminosity follows the standard r1/4 law (de Vaucouleurs, 1948). With the obtained pick-out ratios at each given luminosity, we are able to correct both the observed XLF and the background. The results of the fittings for the corrected XLF are shown in Figure 5. The single power-law model obviously gives a better fit to the corrected XLF than to the uncorrected one with a steeper slope and a probability of 48% that the data and model are drawn from the same distribution. The broken power-law model gives the best fit (), with ergs s-1, , and . We notice that at the 90% confidence level these best-fit parameters agree with those for the uncorrected XLF. For both the corrected and uncorrected XLFs, and are relatively poorly determined due to the small number statistics.
We also have attempted to fit the corrected XLF with a cutoff power-law model. Whether or not the incompleteness correction is made, we find that the model gives poor fit to the data and actually can be rejected at the 90% confidence level. These results agree with those in Kim and Fabbiano (2004), where NGC 4552 is not included in the sample.
4.6 Central Source
Src 1 is the brightest X-ray source in the field. It has been speculated that it might be a mini-AGN based on observations in the optical/UV bands (Renzini et al. 1995; Cappellari et al. 1999). As previously noted in §3 and §4.2, our studies reveal that it is variable on the 1 hr and larger timescales, and its X-ray position agrees very well with the IR, optical, UV and radio centers of the galaxy. We have extracted the Chandra ACIS spectrum of this source and applied an absorbed power-law model to it. We find that the fit (Table 2) is acceptable with a best-fit photon index . This confirms the result of Colbert and Mushotzky (1999), who obtained with ASCA data. Using the best-fit parameters, we estimate that in 0.3–10 keV the central source has an unabsorbed luminosity of ergs s-1. Based on these multi-band parameters we conclude that the central source is most likely a low-luminosity AGN rather than a clump of LMXBs.
4.7 Off-Center Sources with erg s-1
We detected three off-center X-ray sources (Src 15, 41 and 43) that have luminosities larger than erg s-1. One of them (Src 15) is located at about from the center of the galaxy, and has temporal variability on hr timescales. The other two are at about from the center with no evidence for variability during the observation. Src 41 is located in the joint Chandra-HST field and is found to be associated with a GC (§4.8).
We extracted the ACIS spectrum for each of the three sources and fitted them with both an absorbed power-law model (PL) and an absorbed multicolor disk blackbody model (DBB). For Src 41, when the absorption is fixed to the Galactic value, the DBB model gives an acceptable fit () with a disk surface temperature at the inner radius of keV. The PL model gives a worse fit with a somewhat steep slope of . If the absorption is left free, the goodness of the PL fit can be significantly increased, but the resulting absorption column density is about one order of magnitude larger than the Galactic value. For Src 15, both the PL model and DBB model give an acceptable fit. The best-fit power-law photon index and inner disk surface temperature are . and keV, respectively, when the Galactic absorption value is used. For Src 43, when the absorption is fixed to the Galactic value, the DBB model gives a relatively poor fit () with an inner disk surface temperature of keV, while the PL model gives a slightly better fit () with a photon index of . As both models have residuals at about 1 keV we allowed the absorption to be a free parameter and also introduced an additional soft spectral component in the fits. However, neither approach improved the fits.
4.8 ASSOCIATION WITH GLOBULAR CLUSTERS
Kundu and Whitmore (2001) studied the globular cluster system of NGC 4552 in their analysis of 28 elliptical galaxies using the high spatial resolution images of the Wide Field Planetary Camera 2 (WFPC2) on board the HST. For NGC 4552 the field of view of the selected HST pointing lies entirely in the 4 region and covers an area of approximately 5 arcmin2 (42% of the 4 region), which includes the nucleus and the inner parts of the galaxy as well as a region out to about southeast to the center (Fig.2). Twenty five of the off-center X-ray sources and 210 GC candidates with colors between are detected in this field jointly covered by Chandra and HST. Hereafter, we restrict our analysis and discussions to these 25 X-ray sources and 210 GCs unless mentioned otherwise.
There was a systematic offset of about between the HST and Chandra positions. After correcting this offset by using the method outlined in Maccarone et al. (2003), we find that 10 X-ray sources match GCs within . Two other X-ray sources are within and of the nearest GCs, respectively, but they are not listed in the LMXB-GC matches in this work. Based on the spatial distributions of the X-ray sources and GCs, we estimate that fake LMXB-GC matches should occur at random in the selected Chandra-HST field. Thus, we consider all of the 10 LMXB-GC matches to be real. The 10 LMXBs in GCs have count rates ranging from to cts s-1. They show no particular pattern of concentration in spatial distribution (Fig. 2). The one located nearest to the center of the galaxy is at a distance of . One of them (Src 41) is brighter than erg s-1 (§4.7).
4.8.1 GCs Hosting Bright LMXBs and Non-LMXB GCs
In Figure 6a and b, we compare the cumulative optical luminosity distributions of GCs that host bright LMXBs (LMXB GCs) and those that do not (non-LMXB GCs) as a function of their -band and -band magnitudes (Kundu & Whitmore 2001), respectively. As can clearly be seen, the detected X-ray sources tend to be associated preferentially with the optically bright GCs. In the band, the median value of the LMXB GC distribution is 22.0 mag, while the corresponding value of the non-LMXB GCs is 23.1 mag. Quite similar to this, in the band the two median values are 20.9 and 22.0 for LMXB GCs and non-LMXB GCs, respectively. Using the Mann-Whitney rank-sum tests (Mann & Whitney 1947), we calculate that the probability of the fraction distributions of LMXB GCs and non-LMXB GCs following the same distribution are only and in the and bands, respectively.
Figure 6c shows the histogram of the color distribution of all 210 GCs. The distribution is broad with a strong peak at , and is more extended to the redder side. There is a rather weak structure at , but the evidence for a bimodal distribution is not statistically significant (Kundu & Whitmore 2001). Such a distribution pattern implies the existence of a population of bluer, metal-poor GCs and a more dispersive population of redder, metal-rich GCs. This is consistent with the results found by other studies such as Neilsen and Tsvetanov (1999). We find that the color distribution of LMXB GCs tends to have two corresponding concentrations. The number of LMXB GCs in the red population is times as many LMXB GCs as in the blue population. To crosscheck this we plot the cumulative fraction distributions of LMXB GCs and non-LMXB GCs as a function of the color (Fig. 6d). We see that the two distributions are different. The median colors of the LMXB GCs and non-LMXB GCs are 1.12 and 1.02, respectively. Using the Mann-Whitney rank-sum test, we find that the probability of the two distributions being the same is not significant (0.33).
4.8.2 GC-Associated LMXBs and Field LMXBs
In Figure 7a we show both the cumulative number fraction of X-ray sources associated with GCs and that of the field sources located in the joint Chandra-HST field as a function of the intrinsic X-ray luminosity. We find that the median luminosity of the distribution is erg s-1 for the GC-associated X-ray sources, and erg s-1 for the field sources. The probability that the two distributions are the same is 0.50 with the Mann-Whitney rank-sum tests, which means that there is no significant difference between them. Thus X-ray sources in GCs and those not in GCs may have nearly the same mean X-ray luminosities.
We study the X-ray spectral properties of GC-associated and field LMXBs, first by comparing their X-ray hardness ratios as has been defined in §4.3 and plotted in Figure 4, where the GC-associated sources are marked with open diamonds. However, it is hard to find any obvious difference in the distribution pattern directly on the X-ray color-color diagram. So we present the distributions of the source number as a function of the R21 and R31 colors for the GC-associated and field LMXBs, respectively (Fig. 7b and c). We find that the median values of the GC-associated sources are R21= and R31, which are slightly smaller than those of the field sources (R21= and R31=). We thus speculated that the GC-associated LMXBs may be slightly softer than their counterparts in the field.
In order to validate our speculation in a quantitative way, we fit the cumulative spectra of the GC-associated and field LMXBs by using an absorbed power-law model. The absorption column density is fixed to the Galactic value, because it cannot be well constrained if it is left free. When the 68% errors are quoted, the obtained photon indices are = for the GC-associated sources and = for the field sources, which supports that the GC-associated X-ray sources are softer. At the 90% confidence level, the model gives = and = , which overlap only marginally.
None of the GC-associated sources show significant temporal variability in X-rays.
5 DISCUSSION
5.1 The Break on the XLF
The break on the XLF of point sources in early-type galaxies has been detected at ergs s-1 in NGC 4697 (Sarazin et al. 2000), NGC 4472 (Kundu et al. 2002), NGC 1553 (Blanton et al. 2001), and a sample of 14 E/S0 galaxies (including NGC 4697; Kim and Fabbiano 2004). However, in NGC 720 (Jeltema et al. 2003) it is found at a much higher luminosity of ergs s-1 for = 70 km s-1 Mpc-1. Recent analyses of NGC 4365, NGC 4382 (Sivakoff et al. 2003), M49, M87, and NGC 4697 (Jordn et al. 2004) suggest an upper cutoff at ergs s-1, rather than a break. In NGC 1600, Sivakoff et al. (2004) showed that a single power-law profile is sufficient to describe the observed XLF. In NGC 4552, we argue that a break at about ergs s-1 is necessary to fit the XLF corrected for the sample incompleteness of faint sources (§4.5). For luminosities below erg s-1, the profile of the observed XLF is consistent with that expected for ultracompact binaries (Bildsten & Deloye 2004).
Why are the conclusions on the XLF profile so dispersed from case to case? Is there an intrinsic universal break luminosity? Since the typical number of the detected X-ray sources is only 50-150 per galaxy we speculate that even if there is an universal break, the small number statistics will preclude us from measuring it. To investigate this possibility, we carry out direct Monte-Carlo simulations to create a series of fake XLFs whose profiles are intrinsically determined by a broken power-law profile with the typical parameters , and ergs s-1. For each simulated XLF, we consider 100 sources. By fitting the resulting XLFs with the broken power-law model, we find that at the 90% confidence level the obtained ranges from ergs s-1 to ergs s-1. Here the lower limit of agrees well with the break luminosity found in galaxies such as NGC 4697, and the upper limit is consistent with the positions of the cutoffs found in NGC 720, NGC 4365, NGC 4382 and others. Such a large dispersion makes determination of the universal break, if any, observationally impossible.
On the theoretical aspect, an universal break on the XLF is not necessary to signify the transition from neutron stars to black holes. The ultra compact binaries with He or C/O donors should have doubled Eddington luminosity comparing to their counterparts with H donors, and such systems are expected to exist in the dense GC environment in early-type galaxies (Bildsten & Deloye 2004). Also, LMXBs may emit above the Eddington limit if the emission is not isotropic.
5.2 Low Mass X-ray Binaries and Their Associations with Globular Clusters
By analyzing the Chandra and HST data, we find that the fraction of the GCs hosting bright LMXBs in NGC 4552 (4.8%) is similar to those found in NGC 1399 (3.8%; Angelini et al. 2001), NGC 4472 (4%; Kundu et al. 2002), NGC 1553 (2.9%), NGC 4365 (5.5%), NGC 4649 (4.9%) and NGC 4697 (2.7%; Sarazin et al. 2003). Moreover, the fraction of LMXBs associated with GCs is 40% in NGC 4552, which is similar to those of the X-ray bright ellipticals NGC 4472 (40%; Kundu et al. 2002) and NGC 4649 (47%), and the X-ray faint ellipticals NGC 4365 (49%) and NGC 4697 (44%; Sarazin et al. 2003), which is consistent with the argument of White et al. (2002) that at present GCs are the dominant sites for LMXB formation in early-type galaxies. The fraction of GC-associated LMXBs in NGC 4552 is higher than those of the S0 galaxies NGC 1553 (18%; Sarazin et al. 2003) and NGC 1332 (30%; Humphrey et al. 2004), but smaller than that of the cD galaxy NGC 1399 (70%; Angelini et al. 2001). Considering that in typical spiral galaxies such as our Galaxy and M31 (e.g., Supper et al. 1997) the fraction is only about 10%, these observations are generally in agreement with previous suggestions (e.g. Sarazin et al. 2003) that the fraction of X-ray sources residing in GCs may increase along the Hubble sequence from spiral bulges to S0, E, and then cD galaxies. However, it is important to note that the LMXB-GC connection has only been studied in small central regions observed by the HST in each of the early type galaxies mentioned here. This apparent variation with Hubble type may be amplified by any spatial variation in the rate of GC-LMXB associations. We note that considering only the LMXBs in the inner few kpc of the Milky Way to the comparable HST based analyses of the more distant early type galaxies would suggest similar GC-LMXB association rates in early and late type galaxies.
We calculate that in NGC 4552 the probability of having bright X-ray sources in GCs is LMXB per , which agrees very well with the values obtained by Kundu et al. (2003) and Sarazin et al. (2003). Bildsten & Deloye (2004) argue that this can be explained with ultracompact binaries that have a birthrate of one new mass transferring binary every yr per of GCs. We find that GCs hosting bright LMXBs are typically 1–2 magnitudes brighter than those with no detected LMXBs in the and bands. In fact at the level of significance of we reject the hypothesis that the luminosities of LMXB GCs and non-LMXB GCs are drawn from the same distribution. We also find that in the red, metal-rich GCs there are about times as many LMXBs as there are in the blue, metal-poor ones. These results are consistent with, or quite similar to those found in NGC 4472 (Kundu et al. 2002), M87 (Jordn et al. 2004) and other S0/E galaxies (Sarazin et al. 2003), indicating that the high GC formation efficiency is largely attributed to the metallicity, rather than the age of the old stellar systems (Kundu et al. 2003). In NGC 4472 and M87, the number of redder GCs that host a LMXB is about 3 times more than their bluer counterparts. The relatively lower overabundance of LMXB () in redder GCs in NGC 4552 may be partly due to the fact that the redder GC population is less prominent in this galaxy (Kundu & Whitmore 2001).
A comparison of the X-ray properties of the GC LMXBs and field populations of LMXBs may also help us understand the origin of the field LMXBs. In NGC 4552, we find no obvious difference between the luminosity distributions of GC and field LMXBs. By examining both the hardness ratios and the cumulative X-ray spectra of the GC and field sources, we find that the LMXBs in GCs are softer than the field LMXBs at the 68% confidence level. Neither the GC LMXB sample nor field LMXBs has particularly bright soft or hard sources that may dominate the counts in the combined spectrum, which can bias the analysis significantly. Thus, the spectral difference appears to be physically real. This may imply that in NGC 4552 the mean metallicity of the GC-associated LMXBs is higher than that of the field LMXBs (Maccarone et al. 2004), as opposed to NGC 4472, where the LMXBs in GCs tend to be slightly harder (Maccarone et al. 2003).
5.3 Brightest Off-Center X-Ray Sources
Typically, 1–4 X-ray sources that have a 0.3–10 keV luminosity larger than erg s-1 are detected in each early-type galaxy studied to date (e.g., Sarazin et al. 2001; Blanton et al. 2001; Angelini et al. 2001; Kim & Fabbiano 2003; Humphrey & Buote 2004). In a few cases, such as NGC 720 (Jeltema et al. 2003) and NGC 1600 (Sivakoff et al. 2004), an even larger number has been reported. The nature of these very bright sources is not clear. Some of these studies suggest that they are ultra-luminous X-ray sources (ULXs) that host an intermediate mass black hole (IMBH). However, in a recent study of nearby galaxies Irwin et al. (2004) showed that in early type galaxies the sources brighter than erg s-1 are most probably unassociated with the galaxy, while the sources with luminosities of erg s-1 can be explained by accretion onto 10-20 stellar mass black holes (SMBHs). Also in NGC 720, when a more conservative distance to the galaxy is adopted the number of the very bright sources associated with the galaxy is not statistically significant.
The three brightest off-center X-ray sources detected within the 4 region of NGC 4552 have isotropic 0.3–10 keV luminosities of ergs s-1 (Src 15), ergs s-1 (Src 41) and ergs s-1 (Src 43), respectively. One of them, Src 41, is in the joint Chandra-HST field and is found to be associated with a globular cluster. Similar very bright X-ray source-GC matches also have been seen in other early-type galaxies by Angelini et al. (2001; NGC 1399) and Jeltema et al. (2003; NGC 720). We speculate that these very bright GC-associated sources may be powered by the accretion onto a black hole that is at the center of the host GC. Actually the X-ray spectrum of Src 41 in NGC 4552 can be better fitted with a single multiple blackbody disk model than a power-law model (assuming Galactic absorption). The best-fit inner disk temperature ( keV) is higher than that of NGC X-1 ( keV; Colbert & Mushotzky 1999), M81 X-9 ( keV; Miller et al. 2004) and others, inferring that the accreting source in Src 41 should have a relatively low mass, which is estimated to be about 23 for a Schwarzschild black hole, or 15–135 for a Kerr black hole, depending on the black hole spin and the sense of the disk rotation. This ambiguous result makes it difficult to distinguish between the IMBH and SMBH natures for Src 41. Although it is also possible that Src 41 is a background AGN, the probability for such an AGN-GC match is very low.
For Src 43, when the absorption is fixed to the Galactic value, the multiple blackbody disk model gives an unacceptable fit to its X-ray spectrum. A better and marginally acceptable fit can be obtained with the power-law model with a photon index of . So this source is likely to be a neutron star binary system with beamed emissions or a SMBH binary system. For Src 15, both the power-law model and multiple blackbody model give acceptable fits. The best-fit inner disk surface temperature ( keV) is consistent with that of a neutron star or a SMBH system. Still, we cannot exclude the possibility that these two source are background AGNs.
6 SUMMARY
By analyzing Chandra ACIS data we have detected 47 X-ray point sources within the inner 4 region of the early-type galaxy NGC 4552. Most of the sources are inferred to be LMXBs. The position of the brightest point source is consistent with that of the IR, optical, UV and radio centers of the galaxy. In the X-ray band, the central source shows a relatively steep power-law spectrum and temporal variability on 1 hr timescales. These results confirm the early speculation that a low-luminosity AGN resides in the center of this galaxy (Renzini et al. 1995; Cappellari et al. 1999). The derived 0.3–10 keV luminosities of the 46 off-center sources range from to erg s-1. Three sources have isotropic 0.3–10 keV luminosities larger than erg s-1. One of them (Src 41) is in the joint Chandra-HST field and is associated with a globular cluster, and another (Src 15) shows temporal variations on hr timescales. By studying their ACIS spectra we find that Src 41 may be a black hole system with a mass of 15–135 , while the other two sources should have lower masses if they are associated with the galaxy and not background AGN.
We find that after correcting for the incompleteness at the low luminosity end the observed cumulative XLF can be best fit by a broken power-law model with a break at ergs s-1, while the single power-law model and the cutoff power-law model give worse, and unacceptable, fits. The position of the break is consistent with that found by Kim and Fabbiano (2004) in a sample of 14 E/S0 galaxies. By performing Monte-Carlo simulations we argue that even if there is an universal break, it is not a reliable distance indicator due to small number statistics.
In an area jointly covered by both the Chandra ACIS and HST WFPC2, we detected 25 off-center X-ray point sources and 210 GCs, including 10 LMXB-GC matches. We find that the fraction of the GCs hosting bright LMXBs (4.8%) and the fraction of LMXBs associated with GCs (40%) are both in good agreement with those in other early-type galaxies (e.g., Kundu et al. 2002; Sarazin et al. 2003). As in NGC 4472 (Kundu et al. 2002) and M87 (Jordn et al. 2004) and other early type galaxies, in NGC 4552 the GCs hosting bright LMXBs are typically 1–2 magnitudes brighter than the GCs with no detected LMXBs in the and bands. Moreover, there are about times as many LMXBs in the red, metal-rich GCs as there are in the blue, metal-poor ones. This supports the idea that the high GC formation efficiency is largely attributed to the metallicity in old stellar systems (Kundu et al. 2003). We find no obvious difference between the X-ray luminosity distributions of GC LMXBs and field LMXBs. The cumulative spectrum of the LMXBs in GCs tend to be softer than that of the field LMXBs, which differs from result of Maccarone et al. (2003) who showed that in NGC 4472 the LMXBs in GCs tend to be slightly harder. This may indicate that in this galaxy the mean metallicity of the GC-associated LMXBs is higher than that of the field LMXBs (Maccarone et al. 2004).
References
- (1) Angelini, L., Loewenstein, M., & Mushotzky, R. F. 2001, ApJ, 557, L35
- (2) Bildsten, L., & Deloye, C. J. 2004, ApJ, 607, L119
- (3) Blanton, E. L., Sarazin, C. L., & Irwin, J. A. 2001, ApJ, 552, 106
- (4) Cappellari, M., Renzini, A., Greggio, L., di Serego Alighieri, S., Buson, L. M., Burstein, D., & Bertola, F. 1999, ApJ, 519, 117
- (5) Clark, G. W. 1975, ApJ, 199, L143
- (6) Colbert, E. J. M., & Mushotzky, R. F. 1999, ApJ, 519, 89
- (7) Cutri, R. M., et al. 2003, 2MASS All-Sky Catalog of Point Sources (The Two Micron All Sky Survey (2MASS), http://www.ipac.caltech.edu/2mass/)
- (8) Dickey, J. M., & Lockman, F. J. 1990, ARA&A, 28, 215
- (9) de Vaucouleurs, G., de Vaucouleurs, A., Corwin, H. G., Buta, R. J., Paturel, G., Fouque, P. 1992, Third Reference Catalog of Bright Galaxies (RC3), Computer-Readable Version
- (10) de Vaucouleurs, G. 1948, Ann. d’Astrophys., 11, 247
- (11) Ferrari, F., Pastoriza, M. G., Macchetto, F., & Caon., N. 1999, A&AS, 136, 269
- (12) Filho, M. E., Barthel, P. D., & Ho, L. C. 2000, ApJS, 129, 93
- (13) Forman, W., Jones, C., & Tucker, W. 1985, ApJ, 293, 102
- (14) Humphrey, P. J. & Buote, D. A. 2004, ApJ, 612, 848
- (15) Irwin, J. A., Bregman, J. N., & Athey, A. E. 2004, ApJ, 601, L143
- (16) Jeltema, T. E., Canizares, C. R., Buote, D. A., & Garmire, G. P. 2003, ApJ, 585, 756
- (17) Jordn, A., Ct, P., Ferrarese, L., Blakeslee, J. P., Mei, S., Merritt, D., Milosavljevic, M., Peng, E. W., Tonry, J. L., & West, M. J. 2004, ApJ, 613, 279
- (18) Katz, J. I. 1975, Nature, 253, 698
- (19) Kim, D.-W., & Fabbiano, G. 2004, 611, 846
- (20) Kundu, A., Maccarone, T. J., Zepf, S. E., & Puzia, T. H. 2003, 589, L81
- (21) Kundu, A., Maccarone, T. J., & Zepf, S. E. 2002, ApJ, 574, L5
- (22) Kundu, A., & Whitmore, B. C. 2001, AJ, 121, 2950
- (23) Maccarone, T. J., Kundu, A., & Zepf, S. E. 2004, ApJ, 606, 430
- (24) Maccarone, T. J., Kundu, A., & Zepf, S. E. 2003, ApJ, 586, 814
- (25) Mann, H. B., & Whitney, D. R. 1947, Ann. Math. Stat., 18, 50
- (26) Miller, J. M., Fabian, A. C., & Miller, M. C. 2004, ApJ, 614, L117
- (27) Monet, D. B. A., et al. 1998, USNO-A2.0 (Flagstaff Station: U.S. Naval Observatory)
- (28) Mushotzky, R. F., Cowie, L. L., Barger, A. J., & Arnaud, K. A. 2000, Nature, 404, 459
- (29) Nagar, N. M., Falcke, H., Wilson, A. S. & Ulvestad, J. S. 2002, A&A, 392, 53N
- (30) Neilsen, E. H. Jr., & Tsvetanov, Z. I. 1999, ApJ, 515, L13
- (31) O’Sullivan, E., Forbes, D. A., & Ponman, T. J. 2001, MNRAS, 328, 461
- (32) Randall, S. W., Sarazin, C. L., & Irwin, J. A. 2004, ApJ, 600, 729
- (33) Renzini, A., Greggio, L., di Serego Alighieri, S., Cappellari, M., Burstein, D., & Bertola, F. 1995, Nature, 378, 39
- (34) Sarazin, C. L., Kundu, A., Irwin, J. A., Sivakoff, G. R., Blanton, E. L., & Randall, S. W., 2003, ApJ, 595, 743
- (35) Sarazin, C. L., Irwin, J. A., & Bregman, J. N. 2001, ApJ, 556, 533
- (36) Sarazin, C. L., Irwin, J. A., & Bregman, J. N. 2000, ApJ, 544, L101
- (37) Sivakoff, G. R., Sarazin, C. L., & Carlin, J. L. 2004, ApJ, 617, 262
- (38) Sivakoff, G. R., Sarazin, C. L., & Irwin, J. A. 2003, ApJ, 599, 218
- (39) Smith, R. J., Lucey, J. R., Hudson, M. J., Schlegel, D. J., & Davies, R. L. 2000, MNRAS, 313, 469
- (40) Supper, R., Hasinger, G., Pietsch, W., Truemper, J., Jain, A., Magnier, E. A., Lewin, W. H. G., & van Paradijs, J. 1997, A&A, 317, 328
- (41) Tonry, J. L., Dressler, A., Blakeslee, J. P., Ajhar, E. A., Fletcher, A. B., Luppino, G. A., Metzger, M. R., & Moore, C. B. 2001, ApJ, 546, 681
- (42) Trinchieri, G., & Fabbiano, G. 1985, ApJ, 296, 447
- (43) White, R. E. III, Sarazin, C. L., & Kulkarni, S. R. 2002, ApJ, 571, L23
- (44) White, N. E., Nagase, F., & Parmar, A. N. 1995, in X-ray Binaries, ed. W. Lewin, J. van Paradijs, & E. van den Heuvel (Cambridge: Cambridge Univ. Press), 1
- (45) Wise, M. W., Davis, J. E., Huenemoerder, D. P., Houck, J. C., & Dewey, D. 2003, MARX 4.0 Technical Manual, http://space.mit.edu/CXC/MARX
- (46) Wrobel, J. M., & Heeschen, D. S. 1984, ApJ, 287, 41
| Src | R.A. | Dec. | daaProjected distances measured from the center of the galaxy. | Count RatebbBackground-subtracted count rates extracted in 0.3–10 keV and their 1 errors. | S/N | LuminosityccUnabsorbed 0.3–10 keV luminosities calculated by using the best-fit spectral model, assuming that the sources are located at the distance of NGC 4552. | R21ddGas temperatures of the APEC model. | R31eeMetal abundances of the APEC model in the solar unit. | NotesffAGN – Active galactic nuclei; A, B, C, and D – Sources in groups A, B, C, and D, respectively; GC – Sources associated with globular clusters; V – Sources showing significant temporal variability. |
|---|---|---|---|---|---|---|---|---|---|
| No. | (J2000) | (J2000) | (′′) | (10-4 s-1) | () | (1037 ergs s-1) | |||
| 1 | 12:35:39.82 | +12:33:23.0 | 0.0 | 180.96.6 | 19.6 | 338.5 | AGN, V | ||
| 2 | 12:35:39.92 | +12:33:18.0 | 5.2 | 16.42.4 | 6.2 | 36.2 | |||
| 3 | 12:35:39.69 | +12:33:18.1 | 5.2 | 9.22.1 | 3.5 | 28.0 | B | ||
| 4 | 12:35:40.30 | +12:33:10.7 | 14.1 | 9.21.7 | 4.6 | 27.4 | B | ||
| 5 | 12:35:40.53 | +12:33:33.3 | 14.6 | 7.51.7 | 4.3 | 21.9 | B, GC | ||
| 6 | 12:35:40.62 | +12:33:12.2 | 15.9 | 19.02.0 | 8.1 | 56.6 | |||
| 7 | 12:35:40.90 | +12:33:17.1 | 16.8 | 15.61.8 | 6.8 | 34.5 | C | ||
| 8 | 12:35:39.37 | +12:33:41.9 | 20.0 | 24.22.3 | 9.0 | 58.7 | |||
| 9 | 12:35:40.63 | +12:33:40.5 | 21.2 | 4.51.0 | 3.9 | 13.3 | B | ||
| 10 | 12:35:38.32 | +12:33:18.1 | 22.6 | 7.21.3 | 4.9 | 14.4 | D | ||
| 11 | 12:35:39.69 | +12:33:00.4 | 22.6 | 19.62.0 | 7.9 | 61.6 | GC | ||
| 12 | 12:35:40.76 | +12:33:02.8 | 24.4 | 5.51.1 | 4.1 | 16.1 | B | ||
| 13 | 12:35:39.93 | +12:33:48.1 | 25.2 | 4.41.2 | 3.2 | 8.3 | D | ||
| 14 | 12:35:38.06 | +12:33:25.6 | 25.9 | 12.41.6 | 6.2 | 24.6 | D | ||
| 15 | 12:35:38.07 | +12:33:28.3 | 26.2 | 31.72.5 | 10.2 | 117.7 | V | ||
| 16 | 12:35:38.00 | +12:33:37.4 | 30.3 | 5.01.0 | 3.7 | 15.0 | B | ||
| 17 | 12:35:38.24 | +12:33:02.8 | 30.7 | 6.41.2 | 4.4 | 26.4 | A | ||
| 18 | 12:35:40.50 | +12:32:50.5 | 33.9 | 13.81.7 | 6.6 | 31.3 | C, GC | ||
| 19 | 12:35:40.27 | +12:32:49.1 | 34.4 | 5.21.1 | 4.0 | 10.3 | D | ||
| 20 | 12:35:40.47 | +12:33:57.1 | 35.4 | 3.40.9 | 3.0 | 7.6 | C | ||
| 21 | 12:35:40.16 | +12:33:58.1 | 35.5 | 11.91.5 | 6.3 | 34.9 | B | ||
| 22 | 12:35:37.33 | +12:33:22.2 | 36.5 | 4.20.9 | 3.5 | 12.0 | B | ||
| 23 | 12:35:40.99 | +12:32:48.4 | 38.6 | 3.40.9 | 3.0 | 10.3 | B, GC | ||
| 24 | 12:35:41.37 | +12:32:51.1 | 39.0 | 19.42.0 | 8.0 | 73.2 | |||
| 25 | 12:35:42.17 | +12:33:00.5 | 41.0 | 3.70.9 | 3.2 | 10.8 | B, GC | ||
| 26 | 12:35:41.61 | +12:32:51.1 | 41.2 | 5.41.0 | 3.8 | 12.0 | C | ||
| 27 | 12:35:41.30 | +12:33:59.6 | 42.5 | 10.01.4 | 5.6 | 29.4 | B, GC | ||
| 28 | 12:35:36.90 | +12:33:08.0 | 45.3 | 19.42.0 | 7.5 | 52.6 | V | ||
| 29 | 12:35:36.91 | +12:33:05.6 | 46.0 | 4.10.9 | 3.3 | 7.6 | D | ||
| 30 | 12:35:42.39 | +12:32:54.1 | 47.3 | 11.51.5 | 5.9 | 25.5 | C | ||
| 31 | 12:35:43.40 | +12:33:10.0 | 53.9 | 11.21.5 | 5.4 | 47.8 | A | ||
| 32 | 12:35:41.76 | +12:32:35.7 | 55.1 | 4.71.0 | 3.4 | 9.1 | D | ||
| 33 | 12:35:36.03 | +12:33:33.7 | 56.6 | 13.01.6 | 6.4 | 37.4 | B | ||
| 34 | 12:35:35.25 | +12:33:07.4 | 68.8 | 6.11.1 | 4.1 | 13.3 | C | ||
| 35 | 12:35:36.11 | +12:32:38.9 | 70.0 | 3.70.9 | 3.0 | 10.7 | B | ||
| 36 | 12:35:39.69 | +12:34:33.1 | 70.2 | 6.01.1 | 4.3 | 11.3 | D | ||
| 37 | 12:35:44.83 | +12:33:41.0 | 75.6 | 24.22.2 | 8.7 | 71.9 | GC | ||
| 38 | 12:35:38.18 | +12:32:03.3 | 83.2 | 5.21.0 | 4.1 | 15.1 | B, GC | ||
| 39 | 12:35:45.69 | +12:33:22.4 | 85.9 | 16.21.8 | 7.9 | 47.1 | B, GC | ||
| 40 | 12:35:38.49 | +12:31:56.5 | 88.6 | 9.91.4 | 6.0 | 18.2 | D | ||
| 41 | 12:35:45.79 | +12:33:02.9 | 89.7 | 57.43.4 | 15.8 | 114.7 | GC | ||
| 42 | 12:35:33.69 | +12:33:37.5 | 91.0 | 3.60.9 | 3.2 | 10.5 | B | ||
| 43 | 12:35:41.23 | +12:34:51.7 | 91.1 | 58.63.4 | 15.8 | 154.0 | |||
| 44 | 12:35:43.19 | +12:34:50.0 | 100.1 | 8.71.3 | 5.2 | 20.6 | C | ||
| 45 | 12:35:39.23 | +12:31:42.6 | 100.7 | 6.51.1 | 3.8 | 27.1 | A | ||
| 46 | 12:35:41.53 | +12:31:39.6 | 106.3 | 27.52.4 | 8.8 | 63.7 | |||
| 47 | 12:35:46.63 | +12:32:40.1 | 108.5 | 3.10.8 | 3.2 | 7.0 | C |
| Non-thermal Component | Thermal Component | ||||||||
|---|---|---|---|---|---|---|---|---|---|
| Source | ModelaaModels used in the spectral fittings: PL = the power-law model; APEC = the thermal plasma model; and DBB = the multiple color disk model. | or bbPhoton indices of the power-law model, or surface temperatures at the inner radius of the accretion disk (in keV) of the DBB model. | ccUnabsorbed 0.3–10 keV fluxes in ergs cm-2 s-1. | ddGas temperatures of the APEC model. | eeMetal abundances of the APEC model in the solar unit. | ccUnabsorbed 0.3–10 keV fluxes in ergs cm-2 s-1. | |||
| ( cm-2) | (keV) | (keV) | (solar) | /d.o.f | |||||
| (1) Resolved and Unresolved Emissions | |||||||||
| Resolved SourcesffAll the resolved point sources excluding the central one. | PL | 2.56/fixed | 5.26 | 106.1/97 | |||||
| DiffuseggDiffuse emission excluding all the resolved point sources. | PL+APEC | 2.56/fixed | 1.56/fixed | 3.85 | 0.51 | 8.55 | 106.4/65 | ||
| PL+APEC | 1.56/fixed | 3.82 | 0.52 | 7.95 | 100.1/64 | ||||
| Total | PL+APEC | 2.56/fixed | 1.56/fixed | 10.76 | 0.82/fixed | 8.70 | 160.3/136 | ||
| PL+APEC | 1.56/fixed | 10.85 | 0.82/fixed | 7.84 | 150.4/135 | ||||
| (2) Resolved Point Sources in 4 Groups | |||||||||
| Group A | PL | 0.26 | 7.2/12 | ||||||
| Group B | PL | 2.56/fixed | 1.06 | 25.1/22 | |||||
| Group C | PL | 0.44 | 13.5/12 | ||||||
| Group D | PL | 0.35 | 41.7/21 | ||||||
| PL+APEC | 0.41 | 0.82/fixed | 0.05 | 27.6/19 | |||||
| (3) Individual SourceshhSources each having more than 100 counts. | |||||||||
| (3.1) Central Source | |||||||||
| Src 1 | PL | 2.56/fixed | 1.15 | 35.2/47 | |||||
| (3.2) Sources Showing Significant Temporal Variabilities and/or Brighter than erg s-1iiVariable sources are marked with a V. | |||||||||
| Src 15 (V) | PL | 2.56/fixed | 0.34 | 14.5/22 | |||||
| DBB | 2.56/fixed | 0.26 | 15.3/22 | ||||||
| Src 28 (V) | PL | 2.56/fixed | 0.15 | 10.4/18 | |||||
| Src 41 | PL | 2.56/fixed | 0.43 | 18.4/10 | |||||
| PL | 0.29 | 9.3/9 | |||||||
| DBB | 2.56/fixed | 0.29 | 11.5/10 | ||||||
| Src 43 | PL | 2.56/fixed | 0.52 | 27.1/22 | |||||
| DBB | 2.56/fixed | 0.36 | 31.8/22 | ||||||
| (3.3) Other Bright Sources | |||||||||
| Src 2 | PL | 2.56/fixed | 0.15 | 3.0/8 | |||||
| Src 6 | PL | 2.56/fixed | 0.16 | 10.9/13 | |||||
| Src 8 | PL | 2.56/fixed | 0.20 | 6.76/10 | |||||
| Src 11 | PL | 2.56/fixed | 0.19 | 6.5/12 | |||||
| Src 24 | PL | 2.56/fixed | 0.21 | 9.6/13 | |||||
| Src 37 | PL | 2.56/fixed | 0.22 | 11.5/19 | |||||
| Src 46 | PL | 2.56/fixed | 0.18 | 13.3/18 | |||||