Spectroscopic classification of red high proper motion objects in the Southern Sky ††thanks: Based on observations collected with the VLT/FORS1 and ISAAC, the ESO 3.6-m/EFOSC2 and the NTT/SOFI at the European Southern Observatory, Paranal and La Silla, Chile (ESO programmes 63.L-0634, 65.L-0689, 68.C-0664, and 70.C-0568).
We present the results of spectroscopic follow-up observations for a sample of 71 red objects with high proper motions in the range 0.08–1.14 arcsec/yr as detected using APM and SSS measurements of multi-epoch photographic Schmidt plates. Red objects were selected by combining the photographic magnitudes with 2MASS near-infrared magnitudes. Some 50 of the 71 spectroscopically classified objects turn out to be late-type (M6) dwarfs and in more detail, the sample includes 35 ultracool dwarfs with spectral types between M8 and L2, some previously reported, as well as five M-type subdwarfs, including a cool esdM6 object, SSSPM J05005406. Distance estimates based on the spectral types and 2MASS magnitudes place almost all of the late-type (M6) dwarfs within 50 pc, with 25 objects located inside the 25 pc limit of the catalogue of nearby stars. Most of the early-type M dwarfs are located at larger distances of 100–200 pc, suggesting halo kinematics for some of them. All objects with H equivalent widths larger than 10 Å have relatively small tangential velocities ( 50 km/s). Finally, some late-type but blue objects are candidate binaries.
Key Words.:
surveys – stars: kinematics – stars: late-type – stars: low-mass, brown dwarfs – techniques: photometric — techniques: spectroscopic1 Introduction
Although red dwarf stars of spectral type ‘M’ account for more than 70% of the stellar number density in the Solar neighbourhood and are estimated to contribute nearly half of the total stellar mass in the Galaxy (Henry et al. henry97 (1997)), they are not easily detectable in magnitude-limited sky surveys. Indeed, not a single known M dwarf, including the nearest star, Proxima Centauri (M5, d = 1.3 pc, = 11.1 mag), or the nearest M0 dwarf, AX Microscopium (d = 3.9 pc, = 6.7 mag), is visible to the naked eye. Wide-field, deep images taken with Schmidt telescopes preferentially reveal distant main sequence stars of earlier spectral types and more distant giants, but relatively few M dwarfs per field. One way of identifying these nearby, cool, very low luminosity dwarf stars and their substellar counterparts is to compare multi-wavelength sky survey data and select on their characteristic colours. The drawback, however, is the presence of Galactic halo and compact extragalactic sources with similar colours.
Proper motion surveys are an effective way to discriminate between distant giants and nearby dwarfs with similar colours. In general, large proper motions, e.g. 0.18 arcsec/yr, the lower limit in the New Luyten Two Tenths (NLTT) catalogue of 60,000 stars (Luyten 1979– (80)), indicate either small distances (d 50 pc for members of the Galactic disk population with typical tangential velocities of about 40 km/s) and/or intrinsic high velocities (d 180 pc for Galactic halo members with typical 150 km/s) (Scholz et al. scholz00 (2000)). As a consequence, proper motion samples are highly biased towards halo members: according to Digby et al. (digby03 (2003)), the ratio of disk to halo stars can be as low as 4:1 for a proper motion-limited sample, compared to 400:1 for a true Solar neighbourhood volume-limited sample. On the other hand, it is easier to rule out distant (halo) red giants in a sample of faint (e.g. 13), red objects with proper motions exceeding the NLTT limit, since the proper motion would imply tangential velocities larger than 10000 km/s at distances of 12 kpc, a factor of 20 larger than the Galactic escape speed (cf. Leonard & Tremaine leonard90 (1990); Meillon et al. meillon97 (1997)).
Despite the advantages of the high proper motion approach, the 3-D picture of the Solar neighbourhood is remarkably incomplete for low luminosity dwarfs due to the limiting magnitude and incompleteness of existing high proper motion catalogues, particularly in the southern sky and in the Galactic plane region. Within the 25 pc horizon of the catalogue of nearby stars (Gliese & Jahreiß gliese91 (1991)), possibly as many as 63% of stellar systems remain undiscovered (Henry et al. henry02 (2002)), while the number of missing systems within 10 pc is likely to be more than 30% according to Henry et al. (henry97 (1997)). Their prediction for the 10 pc sample of 130 missing systems compared to the 229 known ones is based on the assumptions (1) that the density of stellar systems within 5 pc (0.084 systems pc-3) extends to 25 pc and (2) that the distribution of systems is isotropic. By comparing their 8 pc sample to the 10 pc sample, Reid et al. (reid03 (2003)) estimated an incompleteness in the latter of about 25%, with most of the missing stars are expected among the late-type M dwarfs. Even the 5 pc sample cannot yet be considered complete with respect to these ultracool M dwarfs, as was recently demonstrated by the discovery of an M9 dwarf at about 4 pc (Delfosse et al. delfosse01 (2001)) and an M6.5 dwarf at about 3 pc (Teegarden et al. teegarden03 (2003)).
Several groups have contributed to the completion of the nearby sample in recent years. Since the identification of the twentieth nearest star, GJ 1061 (Henry et al. henry97 (1997)), about 20 new M dwarfs have been discovered within 10 pc. These include mid-M (M3.5 to M6.5) dwarfs (Scholz, Meusinger & Jahreiß scholz01 (2001); Reid & Cruz reid02a (2002); Reid, Kilkenny, & Cruz reid02b (2002); Reylé et al. reyle02 (2002); Henry et al. henry02 (2002); Phan-Bao et al. phanbao03 (2003); Teegarden et al. teegarden03 (2003)) and late-type (M7 to M9.5) dwarfs (Gizis et al. gizis00 (2000); Delfosse et al. delfosse01 (2001); McCaughrean, Scholz, & Lodieu mjm02 (2002); Reid et al. reid03 (2003); Lépine, Rich, & Shara 2003c ). Many of the mid-M dwarfs and some of the late-M dwarfs had already been catalogued as proper motion stars by Luyten (the Luyten Half Second [LHS] catalogue for stars with proper motions exceeding 0.5 arcsec/yr; Luyten luyten79 (1979)), but their distances had not been established. Initial distance estimates are generally arrived at via spectroscopic or photometric measurements, although these can be misleading if the sources are multiples. Ultimately, confirmation via trigonometric parallax measurements is required.
Thanks to new near-infrared sky surveys, including the Two-Micron All Sky Survey (2MASS; Skrutskie et al. skrutskie97 (1997)) and the DEep Near-Infrared Survey (DENIS; Epchtein et al. epchtein97 (1997)), and deep optical CCD surveys, including the Sloan Digital Sky Survey (SDSS; York et al. york00 (2000)), large numbers of objects even cooler than the latest-type M dwarfs have been recently discovered. These have led to the definition of two new spectral types, L and T, with accurate optical and near-infrared classification schemes (Kirkpatrick et al. kirkpatrick99 (1999); Martín et al. martin99 (1999); Burgasser et al. burgasser02 (2002); Geballe et al. geballe02 (2002)). Many of these sources are also nearby with high proper motions including, for example, the T dwarf binary Indi Ba,Bb at 3.6 pc, which has a proper motion of 4.8 arcsec/yr (Scholz et al. scholz03 (2003); McCaughrean et al. mjm04 (2004)).
In this paper, we present the results of various photometric and spectroscopic follow-up observations of very red, high proper motion stars in the southern sky, selected as ultracool dwarf candidates during different stages of our ongoing high proper motion survey. The paper is organised as follows: §2 describes the various sample selection methods applied to reveal low-mass neighbours to the Sun. §3 outlines the optical and near-infrared photometry and spectroscopy observations made with several ESO telescopes, including the Very Large Telescope (VLT), New Technology Telescope (NTT), and 3.6-m. §4 explains the procedures employed in classifying our targets based on their optical and near-infrared properties. A subsample of low-metallicity subdwarfs found in the course of the proper motion survey is presented in §5. We discuss distance estimates in §6, as well as the kinematics and measures of activity in §7, for all objects detected in our search. Individual objects with specific properties are discussed in more detail in §8, including L dwarfs previously published by Lodieu, Scholz, & McCaughrean (lodieu02 (2002)) and Scholz & Meusinger (scholz02b (2002)), and M dwarfs reported by McCaughrean, Scholz, & Lodieu (mjm02 (2002)).
2 Selection of red proper motion stars
Detecting proper motion stars requires observational data spanning an appropriately long period and the original Palomar Sky Survey (POSS-1) led to the discovery of many proper motion sources when it was compared with newer plate material. However, the relatively poor sensitivity of the POSS-1 plates meant that they were unable to pick up the very red and relatively faint L and T dwarfs: to date, none of the NLTT stars has been found to be an L dwarf or later. However, the more modern POSS-2, UK Schmidt, and ESO Schmidt surveys provided substantial improvements in sensitivity at the red end over several epochs, making it possible to discover nearby, high proper motion L and T dwarfs via photographic material alone. This was successfully demonstrated by the discovery of the first field L dwarf, Kelu 1 (Ruiz et al. ruiz97 (1997)), other bright L dwarfs including SSSPM J0829-1309 (Scholz & Meusinger scholz02b (2002)) and LSR 0602+3910 (Salim et al. salim03 (2003)), and the very nearby T dwarfs Indi Ba,Bb (Scholz et al. scholz03 (2003)). Finally, comparison of data from digital optical and infrared sky surveys such as SDSS, 2MASS, and DENIS, with earlier plate material and/or second epoch digital data has also led to the discovery of large numbers of L and T dwarfs (Kirkpatrick et al. kirkpatrick99 (1999, 2000); Reid et al. reid00 (2000); Scholz & Meusinger scholz02b (2002); Tinney et al. tinney03 (2003); Burgasser et al. 2003b ; 2003c ; burgasser04a (2004)). All the nearest late-L and T dwarfs have also been confirmed as large proper motion objects (Dahn et al. dahn02 (2002); Vrba et al. vrba04 (2004)).
For the present work, we chose to use archival multi-epoch optical photographic plate material to search for new high proper motion sources, in common with some other groups. Several searches have been made in the poorly investigated southern sky (e.g., Wroblewski & Torres wroblewski94 (1994); Wroblewski & Costa wroblewski99 (1999); Scholz et al. scholz00 (2000); Ruiz et al. ruiz01 (2001); Reylé et al. reyle02 (2002); Pokorny et al. pokorny03 (2003); Hambly et al. hambly04 (2004)), while new, thorough surveys have also been made in the northern sky (Lépine et al. lepine02 (2002)) and in the Galactic plane (Lépine et al. 2003d ).
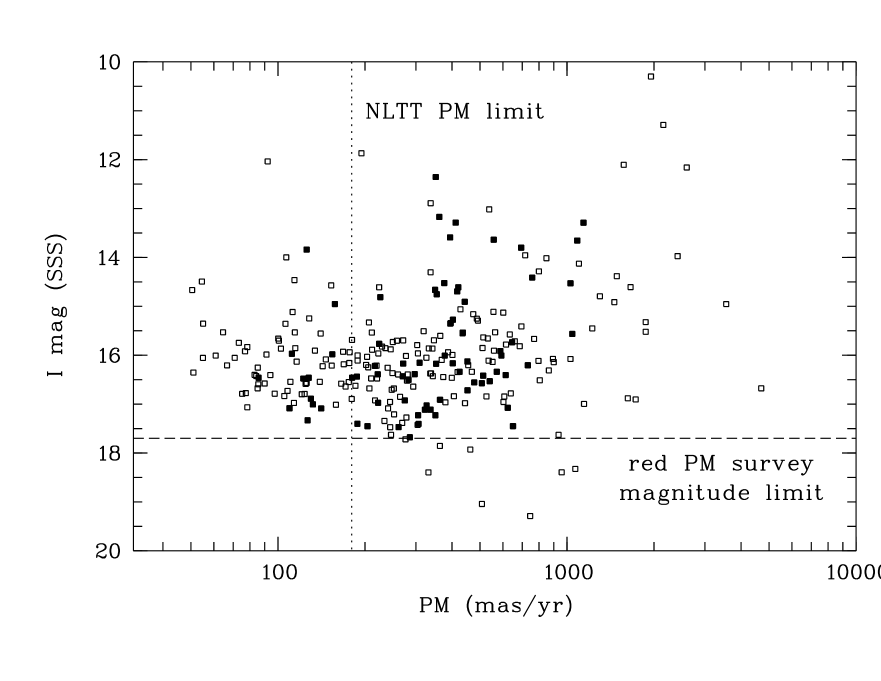
Here, we started by selecting red candidates from the high proper motion survey initiated by Scholz et al. (scholz00 (2000)) to uncover missing nearby low-mass stars and brown dwarfs. This survey was originally based on APM (Automatic Plate Measuring) machine scans of UKST plates in two passbands ( and ) covering a few thousand square degrees (see, e.g., Reylé et al. reyle02 (2002)): high proper motion sources discovered in this work are given the prefix APMPM. More recently, the survey was extended to use the multi-epoch astrometry and multi-colour (, , ) photographic photometry data in the first release of the SuperCOSMOS Sky Surveys (SSS; Hambly et al. 2001a ; 2001b ; 2001c ): sources found this way are prefixed SSSPM and the present sample derived from our recently completed southern sky SSS survey is shown in Fig. 1. It should be noted in passing that the same SSS data are being used completely independently for the same purpose by other groups (Pokorny et al. pokorny03 (2003); Hambly et al. hambly04 (2004)).
Our strategies for selecting nearby, ultracool dwarfs from the photographic plate catalogues are constantly evolving and being refined, employing different combinations of proper motions, colours, magnitudes, and so on, as new photometric data become available and as our experience with spectroscopically confirmed sources is folded back into the procedure. The main search strategies employed to date can be summarised as follows (in chronological order):
-
1.
APM data were available for only one pair of plates ( and ) per field, with a typical epoch difference between 5 and 15 years. We selected objects shifted by more than 5 arcsec (corresponding to a lower proper motion limit of 0.33 arcsec/yr; for more details see Scholz et al. scholz00 (2000)) and with . Since the photographic colour is only weakly correlated with spectral type (see Fig. 2, cf. Fig. 3 in Kirkpatrick, Henry & Irwin kirkpatrick97 (1997)), it was hard to predict the optical and near-infrared fluxes for each source and thus we obtained optical (, ) and near-infrared (, , ) photometry from VLT pre-imaging in order to ensure accurate exposure times for the subsequent spectroscopy (see §3.1).
-
2.
The initial 1999 release of SSS data included about 5000 square degrees at the South Galactic Cap () with and photometry from the UKST plates as well as additional epoch measurements from UKST and ESO Schmidt plates. The proper motions given in the SSS catalogue were obtained from UKST and plates only, for all objects matched between the two passbands within a search radius of 3 arcsec. In order to find sources with larger proper motions, we selected unmatched objects which were picked up along a straight line on at least three plates with consecutive epochs (for more details see Lodieu et al. lodieu02 (2002)). The proper motions were then refined by including all available positional information. Ultracool dwarf candidates were identified from these confirmed high proper motion objects by looking for the largest and indices.
-
3.
The SSS UKST and all-southern-sky surveys were completed in 2001, with additional UKST survey and ESO survey data added subsequently. The catalogue photometric zero points were re-derived, resulting in significant changes in the and colours. Our revised search strategy then concentrated on the and plates alone, neglecting the blue plates which are much less sensitive to extremely red objects.
-
4.
As an alternative strategy, we also looked for very red candidates among objects originally matched in all three passbands within a search radius of 6 arcsec and having a proper motion of 100 mas/yr in the SSS database (for more details see Scholz & Meusinger scholz02b (2002)). We subsequently reduced this limit to 50 mas/yr when the SSS proper motion determinations incorporated all plate measurements in all passbands, i.e., they were no longer based on the UKST and scans alone.
-
5.
The SSS band survey was completed at the end of 2002. As there is an overlap of 0.5 degrees on each side of an UKST plate with its neighbours, roughly one third of the southern sky SSS band measurements had at least two different epochs. The epoch difference is non-uniform and generally only a few years, but nevertheless, these overlapping areas can be used to search for very high proper motion nearby brown dwarfs which may not show up on the and plates due to their extremely red colours. This new search method led to the discovery of nearest known brown dwarf, Indi B (Scholz et al. scholz03 (2003)), subsequently resolved into a binary with spectral types T1 and T6 (McCaughrean et al. mjm04 (2004)).
For each of the five search strategies outlined above, we applied a magnitude limit at the faint end that ensured a sample of no more than a few thousand candidates. Source-by-source visual inspection then reduced the final sample to a few hundred objects for follow-up spectroscopic observations. Fig. 1 shows the versus proper motion distribution for our current full sample of about 270 red proper motion objects, where filled symbols represent the objects described in the present paper. The effective faint magnitude limit of the combined sample of red proper motion objects is mag. Sources in Fig. 1 below this limit are ultracool L and T dwarfs culled from the literature which we subsequently found to be present in the SSS data but which were not picked up by our search strategies, mainly because they were below our applied magnitude limits.
Fig. 1 also illustrates that our search strategy is sensitive to sources faint enough to be low-mass dwarfs even down to a lower proper motion limit of 50 mas/yr: candidates with proper motions this small were selected only if they also exhibited extremely red colours typical of late-M and early-L dwarfs in order to exclude more distant higher-mass sources. Our selected proper motion sample is also generally less complete at the lowest proper motions (300 mas/yr) due to the constraints set in the first search strategy. The sub-sample described in the present paper has a lower limit of about 80 mas/yr. At the other extreme, objects with proper motions larger than 1 arcsec/yr were included as interesting candidates even if they had only moderately red colours, as these may be nearby mid-M dwarfs. The objects with the largest proper motions in Fig. 1, above the 1.14 arcsec/yr upper limit in the present paper, were all newly discovered or recovered within the framework of our high proper motion survey. Some of these have already been published separately (Scholz et al. scholz00 (2000, 2002, 2003); 2004b ; 2004c ), whereas others are targets for upcoming spectroscopic follow-up. Five were previously discovered and classified by other surveys (Goldman et al. goldman99 (1999); Martín et al. martin99 (1999); Delfosse et al. delfosse01 (2001); Lépine et al. 2003b ; Hambly et al. hambly04 (2004)).
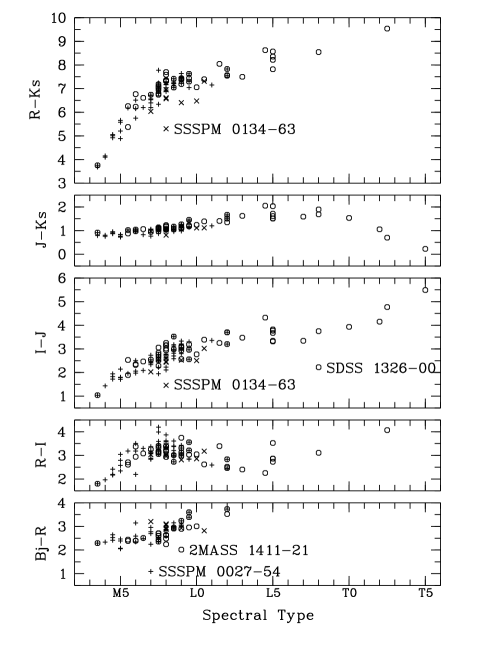
Fig. 2 shows photographic optical and 2MASS near-infrared colours as a function of spectral type for all objects spectroscopically classified in the present study, together with all M, L, and T dwarfs from the literature which could be identified in the SSS data. These detections of previously known objects include three further T dwarfs, SDSS 042304 (T0; Geballe et al. geballe02 (2002)), SDSS 125401 (T2; Leggett et al. leggett00 (2000)), and 2MASS 055914 (T5; Burgasser et al. burgasser00 (2000)), in addition to Indi B and ten L dwarfs already described by Scholz & Meusinger (scholz02b (2002)).
The optical–infrared colour indices of the M, L, and T dwarfs measured by the SSS (Fig. 2) increase monotonically with spectral types. Pure optical and infrared colours saturate at about M8 and L5, respectively, but then turn bluer with later spectral type: the colour then starts becoming redder again at about L5. The smallest colour changes appear in , where a high photometric accuracy yields a small dispersion. Conversely, the largest effect is seen in , although its use as a selector would lead to the exclusion of some L and T dwarfs not visible shortward of the band. Finally, there are some clear outliers in the optical and optical–infrared colours labelled by name in Fig. 2: these objects will be discussed in §8.4.
The sample described in this paper contains a subset of 79 red high proper motion objects selected from our full candidate list (Table 1). As described in the following sections, we have obtained spectra with the VLT, NTT, and ESO 3.6-m at optical wavelengths for 58 of them and in the near-infrared for 27, the latter including 19 objects already observed in the optical. VLT optical and near-infrared photometry was obtained for a subsample of objects as catalogued here, in addition to the , , and photographic plate measurements. Some comparison stars with known spectral types were also observed with identical setups: LHS 517 (M3.5), 2MASSW J095219 (M7.0), LP647-13 (M7.5), BRI B00210214 (M9.5), LP944-20 (M9.5), and Kelu 1 (L2.0). In addition, some red NLTT stars lacking spectral types were also observed. Finally, some of the objects in the sample were subsequently identified with previously known proper motion sources, including ESO 207-61, LHS 2555a, CE 303, LP 859-1, CE 352, [HB88] M18, and [HB88] M12.
3 Observations and data reduction
3.1 VLT service mode observations
An initial subsample of very red proper motion objects were observed photometrically and spectroscopically on the ESO VLT UT1 in service mode in 1999 (P63.L-0634) and in 2000 (P65.L-0689) in the optical with the Focal Reducer/Low Dispersion Spectrograph FORS1 and in the near-infrared with the Infrared Spectrometer And Array Camera (ISAAC). The observations were conducted in dark and grey time in the optical and near-infrared, respectively, and under good seeing conditions ( arcsec) as requested.
3.1.1 VLT/FORS1 imaging
FORS1 employs a 20482048 pixel thinned TK CCD detector: the image scale of 0.20 arcsec yields a field-of-view of 6.86.8 arcmin. A series of three dithered positions was exposed for 10 and 5 seconds each in each of the Bessell and filters, respectively, in order to derive more accurate magnitudes and colours than were available from the plate material. Standard stars were observed each night in order to calibrate the photometry. Data reduction was standard, with each frame bias-subtracted and flat-fielded prior to aperture photometry. Table 2 lists the mean magnitude calculated from three independent measurements, the exposure times, and the specific observing dates for 32 sources in the initial subsample.
| RN | Name | Coordinates (J2000) | Epoch | Proper Motions | Optical and Infrared Magnitudes | |||||||||
|---|---|---|---|---|---|---|---|---|---|---|---|---|---|---|
| R.A. | Declination | x | y | |||||||||||
| 01 | SSSPM J00062157 a,b | 00548.46 | 215719.7 | 1999.60 | 721 | 128 | 7 | 2 | 22.56 | 19.41 | 16.21 | 13.27 | 12.62 | 12.20 |
| 02 | BRI B00210214 b | 02424.61 | 015819.5 | 2001.64 | 93 | 127 | 3 | 6 | 21.76 | 18.17 | 14.95 | 11.99 | 11.08 | 10.54 |
| 03 | SSSPM J00275402 b | 02723.43 | 540146.1 | 1999.80 | 415 | 41 | 18 | 4 | 19.15 | 18.06 | 14.70 | 12.36 | 11.72 | 11.34 |
| 04 | SSSPM J00303427 a | 03010.23 | 342655.5 | 2000.72 | 102 | 279 | 7 | 2 | 22.12 | 19.20 | 16.39 | 13.86 | 13.19 | 12.79 |
| 05 | LP 645-52 b | 03541.68 | 032130.8 | 1998.71 | 428 | 84 | 3 | 1 | 20.26 | 17.88 | 15.54 | 13.75 | 13.28 | 12.99 |
| 06 | APMPM J00577604 b | 05653.38 | 760343.3 | 1998.60 | 160 | 389 | 4 | 13 | 19.88 | 16.91 | 14.61 | 12.57 | 11.99 | 11.62 |
| 07 | SSSPM J01095101 b | 10901.50 | 510049.4 | 1999.81 | 209 | 86 | 2 | 7 | 21.19 | 18.21 | 14.81 | 12.23 | 11.54 | 11.09 |
| 08 | SSSPM J01094955 b | 10909.18 | 495453.2 | 1999.81 | 86 | 128 | 9 | 8 | 22.32 | 19.40 | 15.98 | 13.55 | 12.88 | 12.45 |
| 09 | LP 647-13 b | 10951.17 | 034326.4 | 1998.71 | 354 | 13 | 4 | 5 | 21.10 | 17.87 | 14.75 | 11.69 | 10.93 | 10.43 |
| 10 | SSSPM J01244240 a,b | 12359.05 | 424007.3 | 2000.63 | 145 | 229 | 4 | 7 | 22.16 | 19.35 | 16.17 | 13.15 | 12.47 | 12.04 |
| 11 | SSSPM J01256546 | 12449.63 | 654633.6 | 1999.90 | 98 | 82 | 7 | 8 | 22.70 | 19.49 | 16.46 | 14.43 | 13.81 | 13.46 |
| 12 | SSSPM J01346315 | 13332.44 | 631441.8 | 1999.90 | 77 | 81 | 8 | 9 | 22.11 | 19.01 | 15.97 | 14.51 | 14.02 | 13.70 |
| 13 | LP 769-14 a,b | 15917.41 | 173008.7 | 2000.81 | 119 | 145 | 3 | 6 | 21.15 | 18.63 | 16.44 | 14.61 | 13.96 | 13.70 |
| 14 | SSSPM J02043633 a,b | 20422.13 | 363230.8 | 2000.72 | 216 | 59 | 9 | 26 | 19.96 | 15.77 | 13.27 | 12.60 | 12.19 | |
| 15 | APMPM J02077214 b | 20705.28 | 721406.9 | 1999.86 | 282 | 120 | 6 | 5 | 21.07 | 18.59 | 17.40 | 16.50 | 15.93 | 15.82 |
| 16 | APMPM J02073722 a,b | 20714.08 | 372150.2 | 2000.72 | 422 | 134 | 2 | 6 | 20.79 | 18.10 | 14.91 | 12.44 | 11.83 | 11.38 |
| 17 | SSSPM J02154804 a,b | 21448.14 | 480425.3 | 2000.01 | 118 | 332 | 9 | 5 | 22.20 | 19.14 | 16.17 | 13.56 | 12.96 | 12.52 |
| 18 | SSSPM J02191939 | 21928.07 | 193841.6 | 2000.89 | 195 | 174 | 4 | 5 | 20.06 | 17.47 | 14.11 | 13.34 | 12.91 | |
| 19 | SSSPM J02225412 | 22154.94 | 541205.4 | 1999.82 | 107 | 14 | 7 | 8 | 20.30 | 17.08 | 13.90 | 13.22 | 12.66 | |
| 20 | SSSPM J02314122 | 23122.25 | 412150.7 | 1999.66 | 301 | 127 | 4 | 28 | 20.10 | 17.03 | 13.85 | 13.27 | 12.89 | |
| 21 | APMPM J02324437 b | 23208.96 | 443700.1 | 1998.92 | 384 | 284 | 5 | 5 | 21.42 | 19.00 | 16.56 | 14.45 | 13.82 | 13.74 |
| 22 | APMPM J02445203 a,b | 24400.15 | 520243.0 | 1999.77 | 305 | 11 | 7 | 3 | 21.49 | 18.96 | 17.23 | 15.92 | 15.41 | 14.99 |
| 23 | SSSPM J03063648 a,b | 30611.59 | 364752.8 | 2000.00 | 180 | 670 | 9 | 8 | 20.55 | 17.67 | 13.80 | 11.69 | 11.07 | 10.63 |
| 24 | SSSPM J03274236 b | 32632.78 | 423608.3 | 2000.77 | 286 | 22 | 25 | 28 | 20.53 | 16.92 | 14.22 | 13.61 | 13.21 | |
| 25 | APMPM J03312349 a,b | 33039.10 | 234845.9 | 1998.89 | 621 | 58 | 8 | 5 | 21.30 | 18.87 | 17.08 | 15.80 | 15.31 | 14.94 |
| 26 | LP 888-18 a,b | 33130.25 | 304238.8 | 1999.94 | 40 | 392 | 5 | 6 | 19.91 | 17.21 | 13.59 | 11.36 | 10.70 | 10.26 |
| 27 | LP 944-20 a | 33935.21 | 352544.0 | 1998.93 | 302 | 280 | 6 | 10 | 20.24 | 16.84 | 13.29 | 10.73 | 10.02 | 9.55 |
| 28 | LP 775-31 b | 43516.12 | 160657.4 | 1998.90 | 156 | 315 | 3 | 4 | 18.85 | 16.34 | 12.35 | 10.41 | 9.78 | 9.35 |
| 29 | LP 655-48 b | 44023.33 | 053007.9 | 2001.79 | 339 | 126 | 2 | 2 | 18.85 | 16.50 | 13.17 | 10.66 | 9.99 | 9.55 |
| 30 | SSSPM J05005406 a,b | 50015.77 | 540627.3 | 1999.84 | 207 | 1022 | 9 | 2 | 20.10 | 17.31 | 15.56 | 14.44 | 14.12 | 13.97 |
| 31 | SSSPM J05114606 | 51101.63 | 460601.5 | 1999.77 | 53 | 121 | 9 | 6 | 19.97 | 17.01 | 13.89 | 13.19 | 12.71 | |
| 32 | APMPM J05365358 b | 53621.04 | 535829.7 | 1999.88 | 289 | 243 | 5 | 4 | 21.64 | 19.02 | 16.01 | 13.93 | 13.30 | 12.90 |
| 33 | ESO 207-61 | 70753.27 | 490050.3 | 2000.15 | 34 | 401 | 14 | 8 | 19.48 | 16.17 | 13.23 | 12.54 | 12.10 | |
| 34 | SSSPM J08291309 b | 82834.11 | 130920.1 | 2001.28 | 593 | 14 | 6 | 7 | 22.58 | 18.84 | 16.01 | 12.80 | 11.85 | 11.30 |
| 35 | LP 314-67 b | 94805.16 | 262418.9 | 1999.07 | 143 | 438 | 13 | 2 | 18.03 | 15.59 | 15.03 | 14.85 | ||
| 36 | 2MASSW J095219b | 95221.88 | 192431.9 | 1998.32 | 76 | 100 | 3 | 2 | 19.37 | 17.02 | 13.84 | 11.86 | 11.26 | 10.87 |
| 37 | LP 614-35 b | 120751.63 | 005232.0 | 1999.07 | 188 | 11 | 2 | 4 | 20.92 | 18.35 | 17.40 | 16.15 | 15.50 | 15.30 |
| 38 | APMPM J12122126 b | 121131.86 | 212543.4 | 1998.29 | 330 | 68 | 8 | 8 | 21.07 | 18.59 | 17.11 | 16.27 | 15.71 | 15.60 |
| 39 | APMPM J12222452 b | 122226.55 | 245215.8 | 1998.50 | 442 | 96 | 12 | 4 | 21.17 | 18.70 | 16.13 | 14.33 | 13.85 | 13.49 |
| 40 | LHS 2555a b | 122446.13 | 320016.8 | 1999.26 | 598 | 243 | 12 | 9 | 19.54 | 17.29 | 15.73 | 14.31 | 13.79 | 13.57 |
| 41 | APMPM J12512121 b | 125052.65 | 212113.6 | 2000.20 | 435 | 349 | 4 | 3 | 19.40 | 17.03 | 13.64 | 11.16 | 10.55 | 10.13 |
| 42 | Kelu 1 b | 130540.19 | 254105.9 | 1998.41 | 322 | 19 | 10 | 5 | 19.58 | 17.11 | 13.41 | 12.39 | 11.75 | |
| 43 | CE 303 b | 130921.85 | 233035.0 | 1998.32 | 8 | 376 | 9 | 2 | 20.41 | 17.83 | 14.52 | 11.78 | 11.08 | 10.67 |
| 44 | CE 352 b | 134038.77 | 303202.7 | 2000.23 | 335 | 103 | 7 | 4 | 20.58 | 18.26 | 17.23 | 15.70 | 15.27 | 15.04 |
| 45 | LP 859-1 b | 150416.21 | 235556.4 | 1998.48 | 339 | 85 | 14 | 3 | 20.26 | 17.82 | 14.66 | 12.01 | 11.38 | 11.03 |
| 46 | LHS 3141B b | 155937.99 | 222612.8 | 1999.32 | 193 | 538 | 8 | 21 | 21.65 | 19.41 | 16.34 | 13.61 | 13.12 | 12.84 |
| 47 | SSSPM J19264311 | 192608.59 | 431056.3 | 1999.53 | 167 | 1072 | 15 | 20 | 18.75 | 16.69 | 13.65 | 11.94 | 11.42 | 11.12 |
| 48 | APMPM J19574216 b | 195657.61 | 421623.5 | 2000.57 | 149 | 1017 | 4 | 6 | 19.39 | 17.32 | 14.53 | 12.38 | 11.99 | 11.66 |
| 49 | LP 815-21 b | 202804.52 | 181857.5 | 1998.44 | 105 | 175 | 5 | 6 | 20.38 | 18.11 | 17.45 | 16.10 | 15.91 | 15.28 |
| 50 | SSSPM J20336919 b | 203232.91 | 691859.1 | 2000.43 | 228 | 459 | 10 | 5 | 22.59 | 19.75 | 16.42 | 13.64 | 12.98 | 12.58 |
| 51 | APMPM J20364936 b | 203549.96 | 493607.7 | 1999.71 | 86 | 416 | 4 | 8 | 21.17 | 18.75 | 16.34 | 14.62 | 14.16 | 13.75 |
| 52 | SSSPM J20524759 b | 205228.08 | 475844.2 | 1999.78 | 7 | 435 | 5 | 7 | 21.67 | 18.82 | 15.55 | 12.94 | 12.29 | 11.88 |
| 53 | SSSPM J20598018 | 205902.19 | 801736.9 | 2000.66 | 361 | 46 | 6 | 29 | 20.50 | 16.91 | 14.28 | 13.69 | 13.41 | |
| 54 | SSSPM J21015110 | 210129.49 | 511002.9 | 1999.64 | 69 | 123 | 7 | 16 | 20.27 | 17.09 | 15.13 | 14.41 | 14.09 | |
| 55 | [HB88] M18 b | 211831.74 | 450552.2 | 1999.71 | 388 | 475 | 14 | 15 | 22.36 | 19.41 | 16.41 | 13.43 | 12.77 | 12.37 |
| 56 | [HB88] M12 b | 213114.14 | 422414.3 | 1999.63 | 48 | 71 | 6 | 9 | 21.27 | 18.63 | 16.46 | 14.52 | 13.92 | 13.57 |
| 57 | LP 819-9 b | 215930.91 | 155416.5 | 2000.78 | 0 | 283 | 2 | 4 | 20.80 | 18.47 | 16.50 | 15.07 | 14.59 | 14.31 |
| 58 | LHS 517 b | 220940.29 | 043826.7 | 1999.39 | 1125 | 24 | 2 | 1 | 11.64 | 9.35 | 7.55 | 6.51 | 5.90 | 5.59 |
| 59 | SSSPM J22296931 b | 222923.65 | 693056.9 | 2000.58 | 47 | 217 | 9 | 10 | 19.83 | 16.97 | 14.47 | 13.76 | 13.35 | |
| 60 | LDS4980 B b | 223558.17 | 075713.9 | 2000.59 | 112 | 208 | 2 | 6 | 18.35 | 15.05 | 14.53 | 14.25 | ||
| 61 | LDS4980 A b | 223600.63 | 075603.5 | 2000.59 | 103 | 210 | 9 | 2 | 17.54 | 14.65 | 14.26 | 13.86 | ||
| 62 | SSSPM J22404253 b | 224026.97 | 425318.4 | 2000.73 | 35 | 539 | 27 | 9 | 19.67 | 16.53 | 13.76 | 13.19 | 12.80 | |
| 63 | SSSPM J22575208 | 225731.68 | 520826.3 | 1999.82 | 57 | 113 | 11 | 16 | 20.20 | 17.33 | 14.93 | 14.37 | 14.00 | |
| 64 | SSSPM J22584639 | 225749.26 | 463844.5 | 2000.73 | 185 | 197 | 11 | 4 | 19.81 | 16.43 | 13.61 | 12.93 | 12.60 | |
| 65 | SSSPM J23075009 b | 230658.76 | 500858.9 | 1999.84 | 452 | 25 | 10 | 6 | 22.80 | 19.70 | 16.72 | 13.39 | 12.70 | 12.24 |
| 66 | SSSPM J23101759 | 231018.46 | 175909.0 | 1998.50 | 23 | 271 | 36 | 24 | 20.52 | 17.68 | 14.38 | 13.58 | 12.97 | |
| 67 | SSSPM J23194919 b | 231846.14 | 491918.0 | 2000.50 | 216 | 16 | 9 | 3 | 22.12 | 19.25 | 16.22 | 13.76 | 13.07 | 12.68 |
| 68 | SSSPM J23226358 | 232205.69 | 635758.0 | 1999.88 | 121 | 19 | 11 | 5 | 19.54 | 16.48 | 14.26 | 13.65 | 13.20 | |
| 69 | APMPM J23304737 | 233016.12 | 473645.9 | 2000.79 | 578 | 983 | 2 | 2 | 19.38 | 16.79 | 13.29 | 11.23 | 10.64 | 10.28 |
| 70 | APMPM J23312750 b | 233121.74 | 274950.0 | 1999.44 | 85 | 753 | 4 | 3 | 20.42 | 17.89 | 14.41 | 11.65 | 11.06 | 10.65 |
| 71 | SSSPM J23356913 b | 233519.59 | 691317.0 | 2000.76 | 66 | 168 | 10 | 3 | 22.25 | 19.29 | 16.46 | 13.92 | 13.25 | 12.90 |
| 72 | APMPM J23442906 | 234331.98 | 290627.1 | 1998.85 | 331 | 217 | 10 | 6 | 21.12 | 18.64 | 15.34 | 13.26 | 12.75 | 12.43 |
| 73 | SSSPM J23456810 b | 234457.97 | 680939.8 | 2000.77 | 206 | 81 | 11 | 4 | 22.26 | 19.49 | 16.39 | 13.98 | 13.36 | 12.96 |
| 74 | APMPM J23473154 b | 234654.71 | 315353.2 | 1998.95 | 424 | 408 | 3 | 4 | 22.51 | 19.49 | 15.91 | 13.28 | 12.68 | 12.20 |
| 75 | SSSPM J23522538 a | 235150.44 | 253736.6 | 1999.60 | 354 | 193 | 9 | 8 | 21.73 | 18.70 | 15.27 | 12.47 | 11.73 | 11.27 |
| 76 | SSSPM J23534123 b | 235301.41 | 412324.6 | 1999.70 | 130 | 0 | 20 | 8 | 22.23 | 19.08 | 16.89 | 14.39 | 13.73 | 13.33 |
| 77 | APMPM J23543316 a,b | 235409.28 | 331626.6 | 1999.57 | 326 | 389 | 8 | 13 | 22.20 | 19.30 | 16.57 | 13.05 | 12.36 | 11.88 |
| 78 | SSSPM J23563426 a,b | 235610.81 | 342604.4 | 1999.57 | 70 | 301 | 9 | 5 | 22.21 | 19.18 | 16.15 | 12.95 | 12.38 | 11.97 |
| 79 | SSSPM J24002008 | 235957.62 | 200739.4 | 1998.61 | 402 | 511 | 29 | 10 | 20.29 | 17.45 | 14.38 | 13.62 | 13.25 | |
| RN | Name | Optical imaging | Near-infrared imaging | ||||||||
|---|---|---|---|---|---|---|---|---|---|---|---|
| Date | ExpT() | ExpT() | Date | ExpT | |||||||
| 02 | BRI B00210214 | 1999 Jun 01 | 310s | 17.42 | 35s | 15.34 | 1999 Jul 22 | 32s | 11.87 | 11.16 | 10.60 |
| 05 | LP 645-52 | 1999 Jun 01 | 310s | 17.56 | 35s | 15.73 | 1999 Jun 02 | 32s | 13.80 | 13.35 | 13.05 |
| 06 | APMPM J00577604 | 2000 Jun 21 | 310s | 16.63 | 35s | 14.28 | 2000 Jun 19 | 32s | 12.71 | 12.09 | 11.75 |
| 13 | LP 769-14 | 1999 Jul 25 | 310s | 18.20 | 35s | 16.50 | 1999 Jun 02 | 32s | 14.62 | 14.05 | 13.74 |
| 15 | APMPM J02077214 | 1999 Jun 01 | 310s | 18.50 | 35s | 17.70 | 1999 Jul 23 | 32s | 16.42 | 15.95 | 15.75 |
| 16 | APMPM J02073722 | 1999 Jul 25 | 310s | 17.44 | 35s | 15.24 | 1999 Jul 23 | 32s | 12.48 | 11.86 | 11.44 |
| 21 | APMPM J02324437 | 2000 Jun 21 | 310s | 18.40 | 35s | 16.04 | 2000 Jun 19 | 32s | 14.65 | 14.13 | 13.79 |
| 22 | APMPM J02445203 | 2000 Jun 21 | 310s | 18.68 | 35s | 16.86 | 2000 Jun 22 | 32s | 16.11 | 15.59 | 15.26 |
| 25 | APMPMJ03312349 | 1999 Aug 29 | 310s | 18.50 | 35s | 17.00 | 1999 Sep 06 | 32s | 15.64 | 15.30 | 15.18 |
| 32 | APMPM J05365358 | 2000 Apr 08 | 310s | 18.20 | 35s | 16.50 | 2000 Aug 05 | 32s | 14.02 | 13.41 | 13.02 |
| 35 | LP 314-67 | 1999 Apr 23 | 310s | 18.10 | 35s | 17.00 | 2000 May 12 | 32s | — | — | — |
| 37 | LP 614-35 | 2000 Apr 04 | 310s | 18.47 | 35s | 17.42 | 1999 May 29 | 32s | 16.19 | 15.58 | 15.39 |
| 38 | APMPM J12122126 | 2000 Apr 04 | 310s | 18.41 | 35s | 17.36 | 2000 May 15 | 32s | 16.26 | 15.81 | 15.69 |
| 39 | APMPM J12222452 | 2000 Apr 04 | 310s | 18.17 | 35s | 16.31 | 2000 May 15 | 32s | 14.38 | 13.94 | 13.64 |
| 40 | LHS 2555a | 2000 Apr 04 | 310s | 16.92 | 35s | 15.64 | 2000 May 15 | 32s | 14.37 | 13.91 | 13.70 |
| 41 | APMPM J12512121 | 2000 Apr 04 | 310s | 16.07 | 35s | 13.95 | 2000 May 15 | 32s | 11.25 | 10.67 | 10.29 |
| 42 | Kelu 1 | 1999 Apr 23 | 310s | 19.10 | 35s | 17.20 | 2000 Oct 25 | 32s | 13.29 | 12.42 | 11.73 |
| 43 | CE 303 | 2000 Apr 02 | 310s | 17.00 | 35s | 14.77 | 2000 May 15 | 32s | 11.88 | 11.31 | 10.88 |
| 44 | CE 352 | 1999 Apr 23 | 310s | 18.10 | 35s | 17.10 | 1999 Apr 30 | 32s | 15.77 | 15.29 | 15.10 |
| 45 | LP 859-1 | 2000 Apr 02 | 310s | 16.96 | 35s | 14.77 | 2000 Apr 24 | 32s | 12.16 | 11.58 | 11.16 |
| 46 | LHS 3141B | 2000 Apr 02 | 310s | 18.46 | 35s | 16.15 | 2000 Apr 24 | 32s | 13.71 | 13.26 | 13.12 |
| 49 | LP 815-21 | 1999 May 31 | 310s | 18.11 | 35s | 17.37 | 2000 Oct 25 | 32s | 16.12 | 15.64 | 15.39 |
| 51 | APMPM J20364936 | 2000 Apr 02 | 310s | 18.51 | 35s | 16.53 | 2000 May 15 | 32s | 14.72 | 14.29 | 13.98 |
| 56 | [HB88] M12 | 1999 May 31 | 310s | 18.76 | 35s | 16.58 | 2000 Oct 25 | 32s | 14.51 | 13.92 | 13.58 |
| 57 | LP 819-9 | 1999 May 31 | 310s | 18.10 | 35s | 16.65 | 1999 May 29 | 32s | 15.05 | 14.60 | 14.32 |
| 60 | LDS4980 B | 1999 May 31 | 310s | 18.33 | 35s | 16.75 | 1999 Jun 02 | 32s | 14.66 | 14.16 | 13.88 |
| 61 | LDS4980 A | 1999 May 31 | 340s | 18.09 | 310s | 16.35 | 2000 Oct 25 | 32s | — | — | — |
| 69 | APMPM J23304737 | 1999 Jun 01 | 340s | 15.91 | 310s | 13.78 | 2000 Sep 22 | 32s | 11.27 | 10.73 | 10.37 |
| 70 | APMPM J23312750 | 1999 Jun 01 | 340s | 16.68 | 310s | 14.45 | 2000 Oct 25 | 32s | 11.67 | 11.09 | 10.73 |
| 72 | APMPM J23442906 | 1999 Jun 01 | 340s | 17.96 | 310s | 15.71 | 1999 Jul 22 | 32s | 13.19 | 12.78 | 12.42 |
| 74 | APMPM J23473154 | 2000 May 12 | 340s | 18.45 | 310s | 16.20 | 2000 Jun 19 | 32s | 13.75 | 12.82 | 12.34 |
| 77 | APMPM J23543316 | 2000 May 12 | 340s | 18.36 | 310s | 16.15 | 2000 May 15 | 32s | 13.21 | 12.61 | 12.10 |
| RN | Name | Optical spectroscopy | Near-infrared spectroscopy | ||||
|---|---|---|---|---|---|---|---|
| Date | ExpT | Date | ExpT(1.10–1.39m) | ExpT(1.42–1.83m) | ExpT(1.84–2.56m) | ||
| 02 | BRI B00210214 | 1999 Aug 31 | 3100s | — | — | — | — |
| 05 | LP 645-52 | 1999 Aug 31 | 3100s | — | — | — | — |
| 13 | LP 769-14 | 2000 Jun 21 | 5100s | — | — | — | — |
| 16 | APMPM J02073722 | 1999 Aug 29 | 3100s | — | — | — | — |
| 35 | LP 314-67 | 2000 Apr 05 | 3100s | — | — | — | — |
| 37 | LP 614-35 | 2000 Apr 04 | 3250s | — | — | — | — |
| 39 | APMPM J12222452 | 2000 Jun 21 | 5100s | — | — | — | — |
| 41 | APMPM J12512121 | 2000 Jun 21 | 3100s | — | — | — | — |
| 42 | Kelu 1 | 1999 Jul 07 | 3250s | 1999 Jul 27 | 450s | 450s | 650s |
| 43 | CE 303 | 2000 Jun 21 | 3100s | — | — | — | — |
| 44 | CE 352 | 1999 Jul 07 | 3100s | 1999 Jul 28 | 10100s | 10100s | 18100s |
| 45 | LP 859-1 | 2000 Apr 24 | 3100s | — | — | — | — |
| 46 | LHS 3141B | 2000 May 06 | 5250s | — | — | — | — |
| 49 | LP 815-21 | 1999 Aug 27 | 3250s | 1999 Jul 06 | 5100s | 5100s | 18100s |
| 51 | APMPM J20364936 | 1999 Aug 27 | 3250s | — | — | — | — |
| 56 | [HB88] M12 | 1999 Aug 26 | 3250s | 1999 Jul 06 | 4100s | 4100s | 6100s |
| 57 | LP 819-9 | 1999 Aug 29 | 3250s | — | — | — | — |
| 60 | LDS4980 B | 1999 Aug 29 | 3250s | — | — | — | — |
| 61 | LDS4980 A | 1999 Aug 29 | 3250s | — | — | — | — |
| 69 | APMPM J23304737 | 1999 Aug 29 | 5100s | — | — | — | — |
| 70 | APMPM J23312750 | 1999 Aug 28 | 6100s | 1999 Jul 23 | 425s | 425s | 625s |
| 72 | APMPM J23442906 | 1999 Aug 28 | 5100s | 1999 Jul 23 | 425s | 425s | 625s |

3.1.2 VLT/FORS1 spectroscopy
Of the 32 sources observed photometrically with FORS1, a subset of 22 were followed-up with low-resolution FORS1 spectroscopy (R600) with grism GRIS_300I+11 spanning 6000–11000Å, apart from APMPM J20364936 and LP 859-1 which were observed with grism GRIS_150I+17 covering 3500–11000Å. Total exposure times were set according to the brightness of the object as listed in Table 3. Data reduction involved subtracting an averaged dark frame and dividing by a dome flat field. Wavelength calibration was carried out using He and Ar arc lamp lines covering the whole wavelength range. The data were flux calibrated using an averaged sensitivity function created from a spectrophotometric standard star observed on the same night. The spectra shown in Figs. 4 and 3 have been normalised at 7500Å for consistency with existing spectral classification schemes (Kirkpatrick et al. kirkpatrick99 (1999); Martín et al. martin99 (1999)). No telluric correction was applied to the optical spectra.

3.1.3 VLT/ISAAC imaging
All but two (LP 314-67 and LDS 4980A) of the sources imaged with FORS1 were then imaged with ISAAC to obtain near-infrared photometry. ISAAC employs a HAWAII 10241024 pixel HgCdTe array covering the 1–2.5 m wavelength range with a pixel size of 0.147 arcsec, yielding a field of view of 2.52.5 arcmin. A series of five dithered positions was observed in each of three broad-band filters (, , ): for each position in each filter, a flat-field correction was applied and an average of the other four frames was used to subtract the sky flux. Aperture photometry was carried out for each individual filter. The magnitudes listed in Table 2 correspond to the average of all five measurements in each filter. It should be noted that the ISAAC filter is non-standard, thus potentially leading to problems when comparing with existing calibrations. However, although it was not available when we began our observational program, the 2MASS Second Incremental Data Release in March 2000 provided standard magnitudes for our entire sample, and it is these magnitudes which are in Table 1 and are used for all calculations made in this paper.
3.1.4 VLT/ISAAC spectroscopy
Low-resolution (R 600) spectroscopy spanning 1–2.5 m was obtained with ISAAC for 6 objects (see Table 3) including Kelu 1 (Ruiz et al. ruiz97 (1997)), which was observed as a template. A slit width of 1 arcsec was employed throughout and three gratings were used to cover the spectral ranges 1.10–1.39 m, 1.42–1.83 m, and 1.84–2.56 m. The sources were measured at three or more positions along the slit to permit removal of the sky spectrum. Featureless standards (typically F and G stars) were measured within one degree on the sky of each source and close in time in order to remove telluric absorption. Each individual frame was flat-fielded, sky-subtracted, and a one-dimensional spectrum extracted. These spectra were then divided by the standard, multiplied by an appropriate spectral template smoothed to our resolution, and then co-added to increase the signal-to-noise. The spectra as shown in Fig. 6 were normalised at 1.28 m.

3.2 ESO 3.6-m/EFOSC2 spectroscopy
A second subsample of 47 very red, high proper motion sources was observed in the optical with EFOSC2 on the ESO 3.6-m telescope on La Silla on 22–23 November 2001 and 5–8 December 2002. The weather during the 2001 run was photometric, with seeing 0.6–0.8 arcsec FWHM; the conditions during the 2002 run were poorer, with some observations affected by thin clouds and seeing of 1.0–1.5 arcsec FWHM.
EFOSC2 uses a 20482048 pixel Loral/Lesser CCD with a pixel size of 0.157 arcsec, yielding a useful field of view of 5.25.2 arcmin. Spectroscopy was obtained for most of the objects just once, but additional data were taken for potentially interesting candidates or targets with poorer signal-to-noise. In these latter cases, the sources were observed at two or three positions shifted along the slit by 100 pixels. The details for the observations for each source are given in Table 4. The data were reduced in a similar fashion to that described for the VLT/FORS1 spectroscopy, with the addition that an internal quartz flat field taken immediately after the first exposure in each series was used to remove fringing above 8000Å. The spectra were normalised at 7500Å and are displayed in Figs. 5–11. No telluric absorption correction was applied to the spectra.
| RN | Name | Optical spectroscopy | Near-infrared spectroscopy | ||
|---|---|---|---|---|---|
| Date | ExpT | Date | ExpT | ||
| 01 | SSSPM J00062157 | 2001 Nov 21 | 31000s | — | — |
| 03 | SSSPM J00275402 | 2002 Dec 06 | 1400s | — | — |
| 04 | SSSPM J00303427 | — | — | 2001 Nov 25 | 3150s |
| 07 | SSSPM J01095101 | 2002 Dec 05 | 3400s | 2001 Nov 25 | 360s |
| 08 | SSSPM J01094955 | — | — | 2001 Nov 25 | 3150s |
| 09 | LP 647-13 | 2002 Dec 05 | 1360s | — | — |
| 10 | SSSPM J01244240 | — | — | 2001 Nov 25 | 3150s |
| 11 | SSSPM J01256546 | — | — | 2001 Nov 25 | 3200s |
| 12 | SSSPM J01346315 | — | — | 2001 Nov 25 | 3150s |
| 14 | SSSPM J02043633 | 2001 Nov 22 | 1500s | 2001 Nov 24 | 3200s |
| 16 | APMPM J02073722 | — | — | 2001 Nov 24 | 3150s |
| 17 | SSSPM J02154804 | — | — | 2001 Nov 25 | 3150s |
| 18 | SSSPM J02191939 | 2001 Nov 21 | 3900s | 2001 Nov 24 | 3250s |
| 19 | SSSPM J02225412 | 2002 Dec 08 | 2900s | — | — |
| 20 | SSSPM J02314122 | 2002 Dec 08 | 1800s | — | — |
| 23 | SSSPM J03063648 | 2001 Nov 22 | 1300s | 2001 Nov 24 | 3120s |
| 24 | SSSPM J03274236 | 2002 Dec 06 | 1900s | — | — |
| 26 | LP 888-18 | 2001 Nov 22 | 1270s | 2001 Nov 24 | 3100s |
| 27 | LP 944-20 | 2001 Nov 22 | 1240s | 2001 Nov 24 | 360s |
| 28 | LP 775-31 | 2001 Nov 22 | 1200s | 2001 Nov 24 | 360s |
| 29 | LP 655-48 | 2001 Nov 22 | 1200s | 2001 Nov 24 | 360s |
| 30 | SSSPM J05005406 | 2001 Nov 22 | 1300s | — | — |
| 31 | SSSPM J05114606 | 2002 Dec 08 | 1780s | — | — |
| 33 | ESO 207-61 | 2002 Dec 06 | 2600s | — | — |
| 34 | SSSPM J08291309 | 2002 Dec 08 | 1480s | — | — |
| 36 | 2MASS J095219 | 2001 Nov 22 | 1240s | — | — |
| 47 | SSSPM J19264311 | 2002 Dec 05 | 1240s | — | — |
| 48 | APMPM J19574216 | 2002 Dec 06 | 1240s | — | — |
| 50 | SSSPM J20336919 | 2001 Nov 21 | 31200s | — | — |
| 52 | SSSPM J20524759 | 2002 Dec 05 | 1540s | — | — |
| 53 | SSSPM J20598018 | 2001 Nov 22 | 2900s | — | — |
| 55 | [HB88] M18 | 2002 Dec 06 | 2600s | — | — |
| 58 | LHS 517 | 2002 Dec 08 | 115s | — | — |
| 59 | SSSPM J22296931 | — | — | 2001 Nov 25 | 3200s |
| 62 | SSSPM J22404253 | 2002 Dec 06 | 1660s | — | — |
| 63 | SSSPM J22575208 | 2002 Dec 08 | 1720s | — | — |
| 64 | SSSPM J22584639 | 2002 Dec 08 | 1720s | — | — |
| 65 | SSSPM J23075009 | 2002 Dec 06 | 1660s | 2001 Nov 25 | 3200s |
| 66 | SSSPM J23101759 | 2001 Nov 22 | 3900s | 2001 Nov 24 | 3250s |
| 67 | SSSPM J23194919 | — | — | 2001 Nov 25 | 3150 s |
| 68 | SSSPM J23226358 | 2001 Nov 22 | 1600s | — | — |
| 71 | SSSPM J23356913 | 2001 Nov 22 | 1600s | — | — |
| 73 | SSSPM J23456810 | 2002 Dec 08 | 1600s | 2001 Nov 25 | 3200s |
| 74 | APMPM J23473154 | 2001 Nov 21 | 31200s | — | — |
| 75 | SSSPM J23522538 | 2001 Nov 22 | 1400s | 2001 Nov 24 | 3150s |
| 76 | SSSPM J23534123 | 2002 Dec 06 | 1540s | — | — |
| 77 | APMPM J23543316 | 2002 Dec 08 | 1540s | 2001 Nov 25 | 3150s |
| 78 | SSSPM J23563426 | 2002 Dec 08 | 2500s | 2001 Nov 25 | 3150s |
| 79 | SSSPM J24002008 | 2002 Dec 08 | 3900s | 2001 Nov 24 | 3250s |
3.3 NTT/SOFI spectroscopy
Additional near-infrared (0.95–2.5 m) spectroscopy was obtained using SOFI on the ESO NTT on La Silla on 24–25 November 2001 for sources identified for follow-up from the EFOSC2 optical spectroscopy and for sources with interesting near-infrared colours in the 2MASS database. Both nights were photometric with seeing varying between 0.8–1.0 arcsec FWHM.

SOFI employs a HAWAII 10241024 pixel HgCdTe array (Moorwood & Spyromilio moorwood (1999)) with a pixel size of 0.294 arcsec delivered by the Large Field Objective used for spectroscopy. A 1 arcsec slit was used yielding R600 for both blue (0.95–1.64 m) and red (1.53–2.52 m) gratings. Featureless standards (typically F5–F7) were measured within one degree on the sky of each source to remove telluric absorption and flux calibrate. Each source was observed at three positions along the slit to facilitate sky subtraction. The data were reduced in the same way as described in §3.1.4. The spectra were again normalised at 1.28 m and are shown in Fig. 6.
| RN | Name | H | H | SpT | SpT | SpT | SpT | SpT | distance | |
|---|---|---|---|---|---|---|---|---|---|---|
| index | EW | TiO5 | VO-a | PC3 | Comp | final | [pc] | [km/s] | ||
| 01 | SSSPM J00062157 | 1.013 | 1.9 | 0.275 (M7.8) | 2.290 (M7.8) | 1.982 (M8.6) | M8.5 | M8.5 | 25.0 3.0 | 87 |
| 02 | BRI B00210214 | 0.938 | 0.0 | 0.670 (L0.0) | 2.275 (L0.7) | 2.344 (M9.7) | M9.5 | M9.5 | 11.9 1.4 | 9 |
| 03 | SSSPM J00275402 | 1.947 | 14.5 | 0.278 (M7.8) | 2.213 (M7.0) | 1.500 (M6.3) | M7.0 | M7.0 | 20.8 2.5 | 41 |
| 05 | LP 645-52_1 | 0.920 | 0.2 | 0.314 (M4.8) | 1.996 (M4.7) | 1.276 (M5.0) | M5.0 | M5.0 | 100.5 12.1 | 209 |
| 05 | LP 645-52_2 | 0.930 | 0.2 | 0.310 (M4.9) | 2.012 (M4.9) | 1.228 (M4.6) | M5.0 | M5.0 | 100.5 12.1 | 209 |
| 07 | SSSPM J01095101 | 1.320 | 13.3 | 0.328 (M8.1) | 2.293 (M7.8) | 1.996 (M8.6) | M8.5 | M8.5 | 15.5 1.9 | 17 |
| 09 | LP647-13 | 1.310 | -7.9 | 0.56 (M9.4) | 2.360 (M8.5) | 2.080 (M8.9) | M9.0 | M9.0 | 11.2 1.3 | 19 |
| 13 | LP 769-14 | 1.136 | 2.5 | 0.335 (M4.6) | 2.023 (M5.0) | 1.204 (M4.5) | M4.5 | M4.5 | 159.2 19.1 | 142 |
| 14 | SSSPM J02043633 | 1.529 | 10.8 | 0.252 (M7.6) | 2.254 (M7.4) | 1.701 (M7.4) | M7.5 | M7.5 | 29.3 3.5 | 31 |
| 16 | APMPM J02073722 | 1.507 | 6.7 | 0.210 (M7.4) | 2.257 (M7.4) | 1.637 (M7.1) | M7.0 | M7.0 | 21.6 2.6 | 46 |
| 18 | SSSPM J02191939 | 0.935 | 0.0 | 0.951 (L1.6) | 2.289 (L0.6) | 3.016 (L1.7) | L0.5 | L1.0 | 24.9 3.0 | 31 |
| 19 | SSSPM J02225412 | 1.059 | 0.0 | 0.433 (M8.7) | 2.643 (M8.1) | 2.163 (M9.2) | M9.0 | M9.0 | 30.9 3.7 | 16 |
| 20 | SSSPM J02314122 | 0.779 | 0.0 | 0.414 (M8.6) | 2.267 (M7.6) | 2.194 (M9.3) | M8.5 | M8.5 | 32.7 3.9 | 51 |
| 23 | SSSPM J03063648 | 0.978 | 0.5 | 0.224 (M7.5) | 2.241 (M7.3) | 1.924 (M8.4) | M8.0 | M8.0 | 13.1 1.6 | 43 |
| 24 | SSSPM J03274236 | 0.925 | 0.0 | 0.251 (M7.6) | 2.226 (M7.1) | 2.133 (M9.1) | M8.5 | M8.5 | 38.8 4.7 | 51 |
| 26 | LP 888-18 | 1.544 | 11.0 | 0.264 (M7.7) | 2.259 (M7.5) | 1.817 (M7.9) | M8.0 | M8.0 | 11.2 1.3 | 21 |
| 27 | LP 944-20 | 1.001 | 0.0 | 0.521 (M9.2) | 2.455 (M9.5) | 2.258 (M9.4) | M9.5 | M9.5 | 6.6 0.8 | 13 |
| 28 | LP775-31 | 1.183 | 3.7 | 0.257 (M7.7) | 2.219 (M7.0) | 1.737 (M7.6) | M7.5 | M7.5 | 7.8 0.9 | 13 |
| 29 | LP655-48 | 1.480 | 10.0 | 0.282 (M7.8) | 2.213 (M7.0) | 1.666 (M7.2) | M7.5 | M7.5 | 8.8 1.1 | 15 |
| 31 | SSSPM J05114606 | 0.796 | 0.0 | 0.311 (M8.0) | 2.477 (M9.3) | 2.005 (M8.7) | M8.5 | M8.5 | 33.3 4.0 | 21 |
| 33 | ESO 207-61 | 1.174 | 2.8 | 0.311 (M8.0) | 2.321 (M8.1) | 1.969 (M8.5) | M8.5 | M8.5 | 24.6 2.9 | 47 |
| 34 | SSSPM J08291309 | 0.996 | 0.0 | 1.008 (L1.9) | 2.033 (L2.4) | 2.753 (L1.5) | L2.0 | L2.0 | 11.6 1.4 | 33 |
| 36 | 2MASSW J095219 | 1.575 | 11.3 | 0.240 (M5.6) | 2.106 (M5.9) | 1.489 (M6.3) | M6.0 | M6.0 | 21.0 2.5 | 13 |
| 39 | APMPM J12222452 | 0.867 | 0.0 | 0.287 (M5.1) | 2.041 (M5.2) | 1.253 (M4.8) | M5.0 | M5.0 | 129.4 15.5 | 279 |
| 41 | APMPM J12512121 | 1.109 | 2.6 | 0.238 (M7.6) | 2.272 (M7.6) | 1.614 (M6.9) | M7.5 | M7.5 | 11.1 1.3 | 29 |
| 42 | Kelu 1_1 | 0.933 | 0.0 | 0.965 (L1.7) | 1.983 (L2.8) | 2.128 (L0.9) | L2.0 | L2.0 | 15.4 1.8 | 24 |
| 42 | Kelu 1_2 | 1.163 | 0.0 | 1.009 (L1.9) | 2.087 (L2.1) | 2.471 (L1.2) | L2.0 | L2.0 | 15.4 1.8 | 24 |
| 43 | CE 303 | 1.456 | 6.8 | 0.258 (M7.7) | 2.322 (M8.1) | 1.771 (M7.7) | M8.0 | M8.0 | 13.6 1.6 | 24 |
| 45 | LP 859-1 | 0.974 | 0.2 | — (—) | 2.228 (M7.1) | 1.697 (M7.4) | M7.5 | M7.5 | 16.4 2.0 | 27 |
| 46 | LHS 3141B | 1.245 | 4.8 | 0.115 (M6.9) | 2.059 (M6.9) | 1.645 (M7.1) | M7.0 | M7.0 | 37.0 4.4 | 101 |
| 47 | SSSPM J19264311 | 0.912 | 0.0 | 0.303 (M4.9) | 2.018 (M4.9) | 1.230 (M4.7) | M5.0 | M5.0 | 43.0 5.2 | 222 |
| 48 | APMPM J19574216 | 0.966 | 0.0 | 0.264 (M5.4) | 2.024 (M5.0) | 1.273 (M4.9) | M5.0 | M5.0 | 54.4 6.5 | 266 |
| 50 | SSSPM J20336919 | 0.983 | 1.0 | 0.214 (M7.4) | 2.281 (M7.7) | 1.803 (M7.9) | M8.0 | M8.0 | 32.1 3.9 | 78 |
| 51 | APMPM J20364936 | 0.859 | 0.0 | 0.292 (M5.0) | 2.020 (M5.0) | 1.140 (M4.0) | M4.0 | M4.5 | 165.8 19.9 | 335 |
| 52 | SSSPM J20524759 | 1.475 | 12.1 | 0.303 (M7.9) | 2.333 (M8.2) | 1.847 (M8.0) | M8.0 | M8.0 | 23.2 2.8 | 48 |
| 53 | SSSPM J20598018 | 0.869 | 0.2 | 0.134 (M6.8) | 2.123 (M6.0) | 1.904 (M8.3) | M7.5 | M7.5 | 46.6 5.6 | 81 |
| 54 | SSSPM J21015110 | 1.212 | 7.1 | 0.299 (M5.0) | 2.129 (M6.1) | 1.341 (M5.4) | M6.0 | M5.5 | 107.7 12.9 | 72 |
| 55 | [HB88] M18 | 1.044 | 0.0 | 0.364 (M8.3) | 2.381 (M8.7) | 1.913 (M8.3) | M8.5 | M8.5 | 26.9 3.2 | 78 |
| 56 | [HB88] M12 | 1.556 | 6.6 | 0.279 (M5.2) | 2.044 (M5.2) | 1.190 (M4.4) | M4.5 | M4.5 | 153.0 18.4 | 62 |
| 57 | LP 819-9 | 0.938 | 0.0 | 0.384 (M4.1) | 2.006 (M4.8) | 1.134 (M4.0) | M4.0 | M4.0 | 199.8 24.0 | 269 |
| 58 | LHS 517 | 0.956 | 0.0 | 0.506 (M2.7) | 1.975 (M4.5) | 1.004 (M3.0) | M3.5 | M3.5 | 5.1 0.6 | 27 |
| 60 | LDS4980 B | 0.992 | 0.6 | 0.377 (M4.1) | 1.984 (M4.6) | 1.124 (M3.9) | M4.0 | M4.0 | 195.6 23.5 | 220 |
| 61 | LDS4980 A | 0.927 | 0.0 | 0.443 (M3.4) | 1.978 (M4.5) | 1.017 (M3.1) | M3.5 | M3.5 | 229.2 27.5 | 255 |
| 62 | SSSPM J22404253 | 1.238 | 7.1 | 0.254 (M7.7) | 2.257 (M7.5) | 1.774 (M7.7) | M8.0 | M8.0 | 33.9 4.1 | 87 |
| 63 | SSSPM J22575208 | 1.006 | 2.6 | 0.196 (M6.1) | 2.139 (M6.2) | 1.472 (M6.2) | M7.0 | M7.0 | 67.9 8.1 | 41 |
| 64 | SSSPM J22584639 | 0.833 | 0.0 | 0.231 (M7.5) | 2.181 (M6.6) | 2.430 (M9.8) | M8.5 | M8.5 | 29.3 3.5 | 38 |
| 65 | SSSPM J23075009 | 1.318 | 2.0 | 0.513 (M9.1) | 2.334 (M8.3) | 2.265 (M9.5) | M8.5 | M9.0 | 24.4 2.9 | 53 |
| 66 | SSSPM J23101759 | 1.550 | 0.0 | 0.520 (M9.2) | 2.280 (L0.7) | 2.273 (M9.5) | M9.5 | M9.5 | 35.7 4.3 | 48 |
| 68 | SSSPM J23226358 | 1.600 | 11.2 | 0.244 (M5.6) | 2.161 (M6.4) | 1.677 (M7.3) | M7.5 | M7.5 | 46.2 5.5 | 27 |
| 69 | APMPM J23304737 | 1.292 | 5.6 | 0.204 (M6.0) | 2.142 (M6.2) | 1.495 (M6.3) | M6.0 | M6.0 | 15.8 1.9 | 86 |
| 70 | APMPM J23312750 | 1.297 | 5.1 | 0.181 (M6.2) | 2.137 (M6.2) | 1.850 (M8.1) | M7.5 | M7.5 | 13.9 1.7 | 50 |
| 71 | SSSPM J23356913 | 1.300 | 6.1 | 0.257 (M7.7) | 2.173 (M6.6) | 1.563 (M6.7) | M7.0 | M7.0 | 42.7 5.1 | 37 |
| 72 | APMPM J23442906 | 0.975 | 3.0 | 0.121 (M6.9) | 2.161 (M6.4) | 1.530 (M6.5) | M6.0 | M6.5 | 34.1 4.1 | 64 |
| 73 | SSSPM J23456810 | 1.034 | 0.0 | 0.240 (M7.6) | 2.204 (M6.9) | 1.495 (M6.3) | M7.0 | M7.0 | 43.9 5.3 | 46 |
| 74 | APMPM J23473154 | 1.094 | 5.6 | 0.263 (M7.7) | 2.322 (M8.1) | 1.924 (M8.4) | M8.5 | M8.0 | 27.2 3.3 | 76 |
| 75 | SSSPM J23522538 | 1.415 | 6.0 | 0.422 (M8.6) | 2.174 (M6.6) | 2.221 (M9.4) | M9.0 | M9.0 | 16.0 1.9 | 31 |
| 76 | SSSPM J23534123 | 1.232 | 2.1 | 0.260 (M7.7) | 2.204 (M6.9) | 1.391 (M5.7) | M6.0 | M6.0 | 65.9 7.9 | 41 |
| 77 | APMPM J23543316 | 2.163 | Flare | 0.774 (L0.6) | 2.158 (Flare) | 1.475 (M6.2) | M8.5a | M8.5 | 22.6 2.7 | 55 |
| 78 | SSSPM J23563426 | 1.310 | 0.0 | 0.557 (M9.4) | 2.359 (M8.5) | 2.076 (M8.9) | M9.0 | M9.0 | 20.0 2.4 | 29 |
| 79 | SSSPM J24002008 | 1.048 | 0.0 | 0.612 (M9.7) | 2.476 (M9.7) | 2.308 (M9.6) | M9.5 | M9.5 | 35.7 4.3 | 110 |
Note: There are two independent data sets for LP 645-52 and Kelu 1, which are in good agreement. They lead to the same spectral types
and corresponding estimates of the distances and tangential velocities.
a The spectral type of this object was derived from the quiet spectrum
(see Scholz et al. 2004a for more details).
4 Spectroscopic classification of M and L dwarfs
4.1 Optical classification
Two independent classification schemes for M and L dwarfs based on their optical spectra have recently been defined by Kirkpatrick et al. (kirkpatrick99 (1999)) and Martín et al. (martin99 (1999)). The former scheme is based on spectral ratios in different regions of interest and on spectrum comparisons, while the second scheme is primarily based on a pseudo-continuum ratio known as PC3. In this paper, we have adopted classifications based on a hybrid of the most reliable indices for late M and early L dwarfs, namely TiO5 (Reid, Hawley, & Gizis reid95 (1995); Cruz & Reid cruz02 (2002)), VO-a (Kirkpatrick et al. kirkpatrick99 (1999); Cruz & Reid cruz02 (2002)), and PC3 (Martín et al. martin99 (1999)), as well the direct comparison with objects of known spectral type from Kirkpatrick et al. (kirkpatrick99 (1999)), Gizis et al. (gizis00 (2000)), and Reid et al. (reid99 (1999)) which we observed with the same instrument setups as our candidates. We also compared our spectra with templates available from other groups, including those of Neill Reid111http://dept.physics.upenn.edu/inr/ultracool.html.
Table 5 lists the values and the derived spectral types measured from the TiO5, VO-a, and PC3 indices, the spectral type determined by direct visual comparison, and the spectral type finally adopted for each source. The adopted spectral type was arrived at as follows. First, the mean value of the three independent indices was calculated. This value was adopted unless it was seen to be in gross disagreement with that determined from the template comparison, in which case the template comparison value was preferred. Although most spectral type determinations were indeed in good agreement, discrepancies were seen for a small number of objects, namely APMPM J23312750, SSSPM J23226358, SSSPM J20598018, SSSPM J23534123, SSSPM J03274236, and SSSPM J22584639. For each of these, the spectral type obtained from comparison with templates was adopted.


4.2 Near-infrared classification
A total of 27 objects were observed spectroscopically in the near-infrared. We have used a variety of different near-infrared classification schemes which were designed to provide a best match to the optical classifications for M and L dwarfs (Reid et al. reid01 (2001); Tokunaga & Kobayashi tokunaga99 (1999); Martín martin00 (2000)). The reader is referred to those papers for more details on each scheme.
Table 6 lists the numerical indices measured in each scheme, the corresponding spectral type, and the combined spectral type obtained by taking their mean for each source. Since 19 of these sources also have optical spectra, we are able to compare the optical and near-infrared classification schemes (Fig. 10). There appears to be a systematic shift between the schemes, with generally later spectral types (by roughly one subclass) being assigned in the near-infrared. This discrepancy and the relatively large scatter tends to suggest that the near-infrared schemes are less reliable that their optical counterparts, somewhat at odds with the findings of other studies (see, e.g., Reid et al. reid01 (2001)).

As a consequence, we have adopted spectral types for the sources with near-infrared spectra in the following manner. For the 19 sources with optical spectra, we have simply taken the optical classification. For the remaining 8 sources with near-infrared spectra only, we have ignored the numerical indices and have instead relied on direct comparison of the spectra with sources with known spectral types which we observed with the same setups (SSSPM J03063648, LP 944-20, Kelu 1), or templates made available by Neill Reid (see above) and Sandy Leggett222 http://www.jach.hawaii.edu/skl/data.html. The various computed indices, the associated spectral types, and the finally adopted spectral types are listed in Table 6. We calculated a formal uncertainty of half a subclass in the near-infrared classification. However, due to the systematic observed discrepancy between the optical and near-infrared spectral types of about one subclass, we adopt an error of one subclass on the near-infrared spectral types to err on the cautious side.
| RN | Name | R01 | TK99 | M00 | Mean | Adopted | Distance | vt | |
|---|---|---|---|---|---|---|---|---|---|
| H2OA | H2OB | K1 | QHband | NIR SpT | SpT (optical) | from NIR SpT | |||
| [pc] | [km/s] | ||||||||
| 04 | SSSPM J00303427 | 0.80 (M7.6) | 0.86 (M9.4) | 0.06 (M5.9) | 0.55 (M9.0) | M8.0 | M9.0a | 30.4 3.6 | 43 |
| 07 | SSSPM J01095101 | 0.66 (L2.1) | 0.77 (L1.5) | 0.22 (L2.1) | 0.42 (L1.1) | L2.0 | M8.5 | ||
| 08 | SSSPM J01094955 | 0.75 (M9.3) | 0.84 (M9.9) | 0.25 (L2.7) | 0.40 (L1.5) | L1.0 | M8.0a | 30.8 3.7 | 23 |
| 10 | SSSPM J01244240 | 0.78 (M8.3) | 0.83 (L0.0) | 0.10 (M9.3) | 0.52 (M9.5) | L2.5 | L0.5a | 17.3 2.1 | 22 |
| 11 | SSSPM J01256546 | 0.76 (M8.9) | 0.94 (M7.2) | 0.02 (M7.6) | 0.63 (M7.6) | M8.0 | M7.0a | 54.0 6.5 | 33 |
| 12 | SSSPM J01346315 | 0.80 (M7.8) | 0.78 (L1.2) | 0.22 (L2.0) | 0.49 (M9.9) | L0.0 | M8.0a | 47.9 5.7 | 26 |
| 14 | SSSPM J02043633 | 0.77 (M8.7) | 1.00 (M5.9) | 0.03 (M7.8) | 0.61 (M8.0) | M7.5 | M7.5 | ||
| 16 | APMPM J02073722 | 0.80 (M7.8) | 0.83 (L0.0) | 0.02 (M7.7) | 0.52 (M9.5) | M8.5 | M7.0 | ||
| 17 | SSSPM J02154804 | 0.81 (M7.4) | 0.90 (M8.2) | 0.02 (M7.6) | 0.50 (M9.9) | M8.5 | M8.0a | 30.9 3.7 | 52 |
| 18 | SSSPM J02191939 | 0.60 (M5.7) | 0.69 (L3.4) | 0.16 (L0.7) | 0.41 (L1.3) | L2.5 | L1.0 | ||
| 23 | SSSPM J03063648 | 0.73 (L0.0) | 0.87 (M9.1) | 0.09 (M9.1) | 0.44 (L0.8) | L0.0 | M8.0 | ||
| 26 | LP 888-18 | 0.74 (M9.7) | 0.86 (M9.3) | 0.08 (M9.0) | 0.45 (L0.6) | M9.5 | M8.0 | ||
| 27 | LP 944-20 | 0.63 (L3.2) | 0.79 (L0.9) | 0.11 (M9.6) | 0.38 (L1.9) | L1.5 | M9.5 | ||
| 28 | LP 775-31 | 0.71 (L0.6) | 0.82 (L0.3) | 0.02 (M6.8) | 0.44 (L0.7) | M9.5 | M7.5 | ||
| 29 | LP 655-48 | 0.77 (M8.6) | 0.89 (M8.6) | 0.06 (M8.5) | 0.53 (M9.2) | M8.5 | M7.5 | ||
| 42 | Kelu 1 | 0.66 (L2.2) | 0.75 (L2.1) | 0.28 (L3.2) | 0.35 (L2.3) | L2.5 | L2.0 | ||
| 56 | [HB88] M12 | 0.85 (M6.2) | 1.00 (M5.8) | 0.00 (M7.2) | 0.65 (M7.2) | M6.5 | M4.5 | ||
| 59 | SSSPM J22296931 | 0.80 (M7.6) | 0.88 (M8.7) | 0.14 (M4.2) | 0.55 (M8.9) | M7.5 | L0.0a | 34.4 4.1 | 36 |
| 65 | SSSPM J23075009 | 0.65 (L2.5) | 0.78 (L1.2) | 0.03 (M7.8) | 0.40 (L1.4) | L0.5 | M9.0 | ||
| 66 | SSSPM J23101759 | 0.72 (L0.3) | 0.78 (L1.4) | 0.13 (L0.0) | 0.37 (L2.0) | L1.0 | M9.5 | ||
| 67 | SSSPM J23194919 | 0.75 (M9.2) | 0.96 (M6.7) | 0.03 (M6.6) | 0.62 (M7.9) | M7.5 | M8.0a | 33.9 4.1 | 35 |
| 69 | APMPM J23304737 | 0.75 (M9.5) | 0.97 (M6.6) | 0.08 (M8.9) | 0.54 (M9.1) | M8.5 | M6.0 | ||
| 70 | APMPM J23312750 | 0.72 (L0.4) | 0.93 (M7.6) | 0.13 (L0.0) | 0.53 (M9.3) | M9.5 | M7.5 | ||
| 73 | SSSPM J23456810 | 0.71 (L0.7) | 1.04 (M4.8) | 0.06 (M8.5) | 0.64 (M7.4) | M8.0 | M7.0 | ||
| 75 | SSSPM J23522538 | 0.70 (L1.0) | 0.92 (M7.9) | 0.10 (M9.3) | 0.48 (L0.1) | M9.5 | M9.0 | ||
| 78 | SSSPM J23563426 | 0.62 (L3.5) | 0.81 (L0.5) | 0.10 (M5.1) | 0.30 (L3.1) | L0.5 | M9.0 | ||
| 79 | SSSPM J24002008 | 0.63 (L3.1) | 0.82 (L0.4) | 0.07 (M8.7) | 0.34 (L2.5) | L1.0 | M9.5 | ||
5 Subdwarfs found in the survey
We have identified five subdwarfs among our sample of red high proper motion objects. The spectral classification scheme for these objects, with lower metallicities than those of normal dwarfs, was developed by Reid et al. (1995) and later built upon by Gizis (gizis97 (1997)). The latter paper describes the three steps involving TiO and CaH band strengths which are used to pin down the spectral type. All objects shown in Fig. 11 fulfil the cutoff criteria defined by Eqs. 4–6 in Gizis (gizis97 (1997)) which defines them as subdwarfs and from the indices, three objects (LP 614-35, CE 352, SSSPM J05005406) are unambiguous extreme subdwarfs with spectral types esdM0.5, esdM3.0, and esdM6.0, respectively.
SSSPM J05005406 is among the latest extreme subdwarfs known: the current record holder is the very cool extreme subdwarf, APMPM J05592903, at esdM7.0 (Schweitzer et al. schweitzer99 (1999)). Very cool normal M-type subdwarfs (sdM) have been discovered by Lépine, Shara & Rich (2003a ) (LSR 14257102; sdM8.0) and by Scholz et al. (2004b ) (SSSPM J10131356; sdM9.5), and the first L subdwarfs have recently been published by Burgasser et al. (2003a ), Lépine et al. (2003b ), Burgasser et al. (burgasser04b (2004)), and Scholz et al. (2004c ).

One of the objects found here, LP 815-21, lies in the boundary region between subdwarfs and extreme subdwarfs. A direct comparison with the spectrum of LHS 489 (esdM0.0; Gizis gizis97 (1997)) establishes their similarity and allows us to classify LP815-21 also as an esdM0.0 object. Another problematic object is LP 314-67, where one of the three indices defined by Gizis (gizis97 (1997)) locates it between sdM and esdM, one defines it as sdM, and the last as esdM: again, direct comparison with a similar spectrum was necessary to yield a final spectral type of sdM3.5.
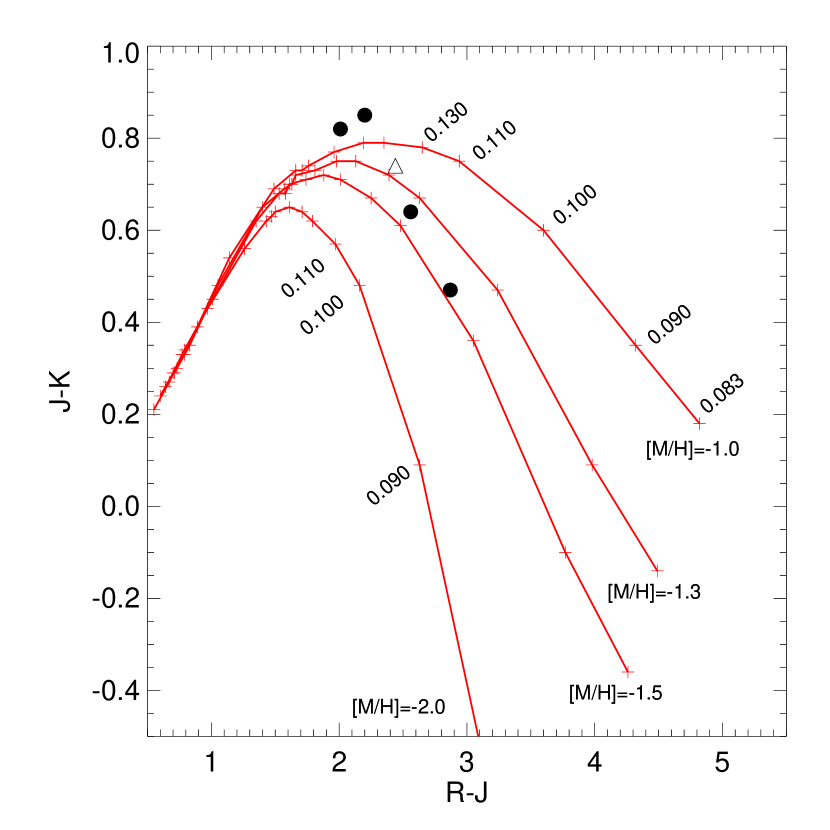
We have compared the measured colours for each subdwarf with the colours predicted by the evolutionary models for low-metallicity dwarfs of Baraffe et al. (baraffe97 (1997)) in order to make a preliminary estimate of the metallicity and mass for each source, assuming a typical age of 10 Gyr (Fig. 12). The derived metallicities tend to be higher than the assumed metallicity of 1.2 and 2.0 for subdwarfs and extreme subdwarfs proposed by Gizis (gizis97 (1997)). Assuming the metallicities from Fig. 12, we have estimated masses of 0.09–0.10, 0.11, 0.15, 0.10, and 0.20 M⊙ for SSSPM J05005406, LP 314-67, LP 614-35, CE 352, and LP 815-21, respectively. By comparing the observed magnitudes, metallicities, and masses to the magnitudes predicted by evolutionary tracks, we have derived distances of 63 9, 143 23, 264 15, 130 23, and 350 49 pc for SSSPM J05005406, LP 314-67, LP 614-35, CE 352, and LP 815-21, respectively, assuming an error of 15% for these model-dependent distances.
| RN | Name | TiO5 | CaH1 | CaH2 | CaH3 | SpT | dspec | vt | vr | |||
|---|---|---|---|---|---|---|---|---|---|---|---|---|
| [pc] | [km/s] | [km/s] | [km/s] | [km/s] | [km/s] | |||||||
| 30 | SSSPM J05005406 | 0.984 | 0.355 | 0.270 | 0.382 | esdM6.0 | 63 09a | 313 | 247 20 | 262 48 | 287 22 | 84 17 |
| 70 11b | 348 | 294 60 | 298 25 | 77 19 | ||||||||
| 54 08c | 268 | 220 43 | 274 21 | 94 16 | ||||||||
| 35 | LP 314-67 | 0.773 | 0.596 | 0.433 | 0.643 | sdM3.5 | 143 23a | 314 | 214 20 | 128 14 | 351 52 | 63 24 |
| 395 59b | 866 | 130 22 | 872 136 | 115 51 | ||||||||
| 193 29c | 423 | 128 15 | 454 71 | 27 30 | ||||||||
| 37 | LP 614-35 | 1.057 | 0.744 | 0.660 | 0.806 | esdM0.5 | 264 15a | 237 | 288 20 | 168 35 | 261 24 | 206 19 |
| 265 40b | 237 | 169 37 | 261 25 | 206 19 | ||||||||
| 257 39c | 230 | 163 34 | 258 23 | 207 19 | ||||||||
| 44 | CE 352 | 0.871 | — | 0.471 | 0.626 | esdM3.0 | 130 23a | 217 | 66 20 | 186 29 | 121 32 | 46 11 |
| 195 29b | 325 | 258 65 | 200 71 | 52 12 | ||||||||
| 149 22c | 249 | 207 32 | 144 34 | 48 11 | ||||||||
| 49 | LP 815-21 | 0.952 | — | 0.773 | 0.870 | esdM0.0 | 350 49a | 340 | 122 20 | 269 35 | 240 53 | 13 15 |
| 347 52b | 337 | 267 34 | 237 51 | 14 15 | ||||||||
| 278 42c | 270 | 233 30 | 181 42 | 23 13 |
As a check, we have also used comparison objects with known spectral types and trigonometric parallaxes drawn from Gizis (gizis97 (1997)). By comparing the 2MASS apparent magnitudes for our new subdwarfs with those for a Gizis (gizis97 (1997)) source with a matching spectral type, we are again able to estimate the distances for our sources. We have also used the empirical relationships between spectral types and absolute magnitudes for sdM and esdM objects given by Lépine et al. (2003c ). For the four new extreme subdwarfs, the bootstrapped distance estimates agree with the model-dependent estimates to within the errors, while the bootstrapping technique yields significant differences for the subdwarf LP 314-67, as seen in Table 7.
Armed with these distance estimates and the proper motions for each source, we only require the radial velocity before we are able to calculate the true space velocities. We have been able to use the relatively sharp Ca II lines at 8542 and 8662 Å to detect radial velocity shifts in the five subdwarfs. The measured shifts were , , , , and 0.5 Å, corresponding to heliocentric radial velocities of , , , , and km/s for SSSPM J05005406, LP 314-67, LP 614-35, CE 352, and LP 815-21, respectively.
Finally then, we are able to compute the heliocentric space velocities following Johnson & Soderblom (johnson87 (1987)), doing so for each distance estimation technique as described above. As listed in Table 7, the determined space velocity components are typical of (extreme) subdwarfs (cf. Figs. 17 and 18 in Lépine et al. 2003c with velocities ranging from 100 to 500 km/s). The largest calculated space velocity is that for the sdM3.5 object LP 314-67, assuming the distance bootstrapped from the Gizis (gizis97 (1997)) comparison source: its velocity is comparable to the largest space velocities for subdwarfs presented by Lépine et al. (2003c ).
6 Distance estimates for the normal M and L dwarfs
Our technique for establishing the distances of the normal M and L dwarfs in our sample is more straightforward, using the absolute versus spectral type relationship of Dahn et al. (dahn02 (2002)) as follows:
which is valid for spectral types between M6.5 and L8.0, and where the spectral type, SpT = 6.5 for M6.5 and increases to 18 for L8. The error in the relation is 0.25 magnitudes and in computing the distances for the sources in our sample, we have combined that error with a 0.1 magnitude error in the measured apparent magnitude. Note that we have used the magnitudes from 2MASS and not our own ISAAC magnitudes to compute distances.
For objects with spectral types earlier than M6.5, we have employed the absolute magnitudes given by Kirkpatrick & McCarthy (kirkpatrick94 (1994)) for all early- and mid-M dwarfs, except for M5.5 dwarfs. For these, we used absolute magnitudes of MJ = 9.87, MH = 9.31, and MKs = 8.97 as kindly provided by Hartmut Jahreiß (personal communication), based on the following standards: LHS 2, LHS 39, LHS 549, LHS 1565, and LHS 3339. For the early type sources in our sample, the distances were determined as an average of those calculated for each of the three near-infrared filters, and the uncertainties were estimated using the assumptions described above for the late-type objects.
The resulting distance estimates are listed in Tables 5 and 6. The great majority of the late-type ( M6) dwarfs appear to be located within 50 pc of the Sun, with 24 falling in the range of the catalogue of nearby stars ( 25 pc) and 11 of those within 15 pc. On the other hand, the majority of the earlier-type objects are located at larger distances ranging from 100–200 pc: only three of them are members of the 25 pc sample.
7 Kinematics and activity
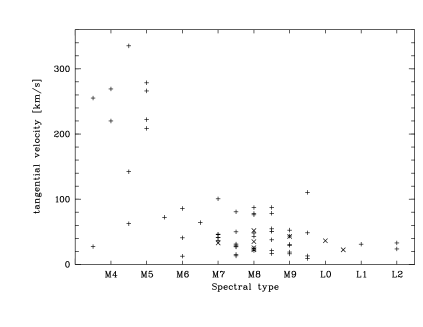
Combining the distance estimates with the measured proper motions, the tangential velocities of the sources can be calculated (Tables 5 and 6). The large distances estimated for most of the early-type M dwarfs ( M5.5) and the relatively large proper motions measured in some cases lead to extremely large tangential velocities of 200–300 km/s (Fig. 13), comparable with those of the subdwarfs described earlier (Table 7). The most extreme example is the M4.5 dwarf, APMPM J20364936, with a tangential velocity of 335 km/s. Such large velocities are more typical of metal-poor stars than of metal-rich ones, although Lépine et al. (2003c ) have also reported several normal M dwarfs which may be members of the Galactic halo population. Gizis (1997) described a number of sources with early M-type spectra and halo kinematics which he classified as normal M dwarfs, rather than sdM or esdM subdwarfs. Indeed such objects are to be expected, since his classification scheme sources with metallicities of are normal M dwarfs, not subdwarfs, and the metallicity distribution of halo stars extends down to this level. Among the later-type ( M5.5) dwarfs, the tangential velocities are typically substantially less than 100 km/s, with the M9.5 dwarf, SSSPM J2400-2008, the most extreme case at 110 km/s.
Gizis et al. (gizis00 (2000)) have demonstrated a relationship between tangential velocity and chromospheric activity for late (M8–M9.5) dwarfs, inasmuch as all objects with H equivalent widths over 10Å have tangential velocities greater than 20 km/s and up to 80 km/s. The velocity dispersion of a population of stars increases with age as they interact with the potential of the galactic disk and thus low velocity stars are generally younger than high velocity stars. The usual prejudice is that young, more rapidly rotating stars exhibit more chromospheric activity than their older, spun-down counterparts, but the Gizis et al. (gizis00 (2000)) finding shows that in fact the opposite applies to ultracool dwarfs, where the activity declines due to the very low temperatures.
There appears to be a second order effect however, namely that activity is also correlated with mass. For a given ultracool spectral type (e.g., late M or L), a sample of sources may contain both old and young objects: the old objects will be true stellar sources (i.e., above 0.075 M⊙) which have cooled and contracted down to their main sequence parameters, while the younger sources could well be substellar objects (i.e., below 0.075 M⊙) which are still deriving luminosity and an enhanced effective temperature from their pre-main sequence contraction. These latter sources will be slightly larger and more luminous, and have a lower surface gravity than their older, same-spectral-type counterparts. Gizis et al. (gizis00 (2000)) suggest that this may lead to the observed reduction in chromospheric activity.
With our new sample of ultracool dwarfs, we can explore these relationships a little further, although it must be emphasised that we cannot do so in a statistical sense. Our sample is proper-motion selected and is therefore biased towards older, high velocity objects and away from younger, lower velocity sources.
We have used two different indices to estimate the level of chromospheric activity for the objects in our sample. First, we have computed the H index defined by Kirkpatrick et al. (kirkpatrick99 (1999); see their Table 4), which measures the strength of the H emission line compared to the neighbouring continuum: values above 1 indicate significant emission. Second, we have measured the equivalent width of the H line. The results of both measurements are given in Table 5.
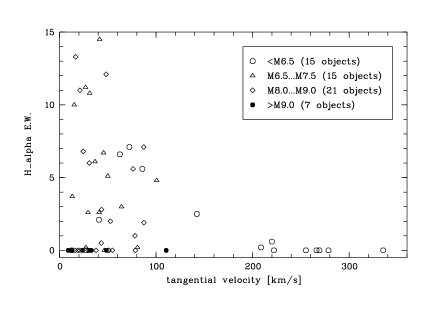
First, we note that there is a peak in activity around spectral types M6–M7, as also reported by Hawley, Gizis, & Reid (hawley96 (1996)) and Gizis et al. (gizis00 (2000)) for larger samples of nearby M dwarfs. In more detail, we see that there are seven very active objects with H equivalent widths larger than 10 Å, all of which are M7–M8.5 dwarfs. Interestingly, these sources all have relatively small tangential velocities, km/s, three of them below 20 km/s: their average velocity is roughly half that of the full population of M7–M8.5 sources in our sample.
Thus, at first sight, this subsample appears to contradict the finding of Gizis et al. (gizis00 (2000)), namely that active, very late type sources tended to have larger velocities than their inactive counterparts. However, when we more rigorously compare like with like, we find that their conclusion remains valid. If we consider only the M8–M9.5 sources and divide them into H active (EW0.5Å; 12 sources) and inactive (EW0.5Å; 13 sources) samples, we find mean tangential velocities of 52 and 40.5 km/s, respectively. That is, the active sources have higher velocities on average, consistent with the finding of Gizis et al. (gizis00 (2000)).
8 Discussion related to specific objects
8.1 L dwarfs
In Lodieu et al. (lodieu02 (2002)), we described the discovery of three new early L dwarfs from our proper motion survey, with optical and near-infrared spectroscopy for two of them (SSSPM J23101759, SSSPM J02191939) and near-infrared spectroscopy alone for the third (SSSPM J01095101). The spectral types derived by Lodieu et al. (lodieu02 (2002)) based on near-infrared spectral indices were L1, L2, and L2, respectively, but we now find that these results must be revised.
We have made direct comparisons of the optical spectra which we now have for all three sources with template stars observed with the same instrumental set-up, deriving revised spectral types of M9.5, L1.0, and M8.5 for SSSPM J23101759, SSSPM J02191939, and SSSPM J01095101, respectively, with uncertainties of half a subclass. These differ significantly from the previous results, in line with the trend shown in Fig. 10, where the near-infrared spectral classification tends to yield a later spectral types than found from the optical spectra.
As a consequence of the revised spectral types, the corresponding spectroscopic parallaxes shown in Table 5 have also been changed, although the objects remain relatively nearby: SSSPM J23101759 and SSSPM J02191939 lie within 30 pc, while SSSPM J01095101 may be within 15 pc.
The nearest L dwarf in our sample (SSSPM J08291309; L2.0) has a spectroscopic distance of 12 pc and we confirm the spectral type obtained from a lower signal-to-noise spectrum in the discovery paper by Scholz & Meusinger (scholz02b (2002)). Its optical spectrum is shown in Fig. 5 alongside the very similar spectrum for Kelu 1.
Finally, there are two other L dwarf candidates (SSSPM J01244240 at L0.5; SSSPM J22296931 at L0.0) in our sample for which, however, only near-infrared spectra could be used for classification (see Fig. 6). Given the apparent systematic shift in spectral types between optical and near-infrared spectra for the sources discussed above and as similarly seen for Kelu 1, LP 944-20, and SSSPM J24002008, these early L dwarf classifications for SSSPM J01244240 and SSSPM J22296931 must be regarded with some caution: it is entirely possible that they will be reclassified as late M dwarfs once appropriate optical spectra are obtained.
8.2 Nearby M dwarfs
Our sample contains two late M dwarfs within 10 pc, LP 775-31 and LP 655-48, which we originally classifed as M8.0 and M7.5, respectively, on their discovery (McCaughrean et al. mjm02 (2002)). Cruz & Reid (cruz02 (2002)) had earlier claimed that both sources were M6 dwarfs, but Cruz et al. (cruz03 (2003)) subsequently reclassified both as M7. We have also revisited their optical spectra as part of the present work and adopt spectral types of M7.5 for both (Table 5), consistent with the Cruz et al. (cruz03 (2003)) results to within the errors. In either case, the distances nominally stay below 10 pc, but as pointed out by Cruz et al. (cruz03 (2003)), trigonometric parallaxes are needed to settle the matter.
However, it is worth noting that the near-infrared spectra for these two sources differ significantly, with LP 655-48 being redder in the range 1.46–1.69 m, redder from 2.0–2.2 m, bluer from 2.2–2.4 m, and exhibiting a stronger CO bandhead break. As recently demonstrated by Close et al. (close03 (2003)), these differences may indicate that one or both of the objects may be a binary with a very late type companion.
In addition to these very nearby sources, there are several other M dwarfs in our sample which we find to be rather nearby, including LP 888-18 and APMPM J12512121 at 11 pc, and SSSPM J08291309 at 12 pc.
8.3 Objects with proper motions larger than 1 arcsec per year
Four of the discoveries presented in this study have proper motions exceeding 1 arcsec/yr. One of these objects, SSSPM J05005406, was spectroscopically classified as an ultracool subdwarf (esdM6.0), while the other three are mid-M dwarfs: SSSPM J19264311 (M5.0), APMPM J19574216 (M5.0), and APMPM J23304737 (M6.0). The large tangential velocities ( 200 km/s) implied for SSSPM J19264311 and APMPM J19574216 suggest that they may well be members of the Galactic halo population, while the derived 90 km/s for APMPM J23304737 may make it a representative of the thick disk. The identification of a relatively large number of these relatively rare objects in this study simply confirms the strong bias towards them that naturally results from proper motion based searches (see also Scholz et al. 2004b ).
8.4 Objects with blue colours
There are two objects in our sample with unusually blue colours for their spectral types, even after considering the rather large dispersion in the colours originating with the relatively poor accuracy of the photographic SSS magnitudes (see Fig. 2). The colour of the first of these objects, SSSPM J00275402, is 1.1, whereas its M7 spectral type would predict something closer to 2.5. None of the other colours for this source seem out of character with its spectral type which would, at first sight, suggest a photometric error in , despite its apparent brightness at that wavelength. An alternative solution might be the presence of a very blue companion or chance aligned field star.
The second source, SSSPM J01346315, has been classified as M8, but its 1.5 and 5.3 are more consistent with something closer to M5. In this case, the explanation may lie with the fact that we have only a near-infrared spectrum for this source, which may again have skewed our classification towards a later type than would be derived in the optical, as discussed above.
There are two other objects labelled in Fig. 2 with nominally erroneous colours: these are not members of our sample, but are shown for comparison. One is 2MASS 141121, classified as an M9 dwarf by both Cruz et al. (cruz03 (2003)) and Kendall et al. (kendall04 (2004)), but also appearing very blue in the optical with 2.0. Again, a blue companion or aligned field star might be the explanation. The other source, SDSS 1326-00 (Fan et al. fan00 (2000)) has an uncertain spectral type of “L8?” but was barely detected in the SSS band data and has a very small colour of 2.2, much below the expected 3.5. The proper motion for this source of (294,1027) (20,3) mas/yr obtained from one SSS, one 2MASS, and one SDSS position formally supports its identification, but there remains room for error, as the epochs of the three observations were not well distributed (SSS 1991.256; 2MASS 1999.093; SDSS 1999.219). This object requires further investigation and at the very least, a new epoch position would prove very helpful in verifying the proper motion and the corresponding SSS identification.
8.5 Common proper motion stars
One of the new high proper motion objects was found to be a common proper motion companion 32 arcsec from the previously known LHS 3141 and has therefore been named LHS 3141B. The catalogued proper motion of the primary, (204,519) (5,8) mas/yr, agrees to within the errors with our measured proper motion for LHS 3141B. We have classified this latter object as an M7 dwarf, but unfortunately, no spectral type presently exists for the brighter primary. According to its optical-to-infrared colours ( 1.1; 3.4), it should be an early-type M dwarf. Assuming a distance of 37 pc as derived from the spectroscopic parallax for the secondary, the projected physical separation is 1200 AU.
The previously known common proper motion pair LDS 4980 was included in our spectroscopic program due to the relatively red colour measured from APM scans of the POSS-1 and plates. The spectral types determined for the pair, M3.5 and M4, are rather early and imply a relatively large distance of 210 pc, in good agreement with independent estimates for the two components. The measured angular separation of about 79 arcsec between the pair then translates into a large projected physical separation of 16 600 AU or 0.08 pc. The proper motions of the two components also agree within the errors and the implied tangential velocity appears to be in excess of 200 km/s, rather large for M dwarfs and indicating membership in the Galactic halo.
Finally, our sample contains another new common proper motion component to a known system, APMPM J23543316, recently been described in detail by Scholz et al. (2004a ). It is a wide M8.5 companion to the M4/DA binary LHS 4039/LHS 4040 and was found to show very strong H emission line and a blue continuum below 7500 Å.
8.6 Objects without spectroscopy
As discussed in §3, eight of the objects in our sample have not yet been observed spectroscopically at either optical or near-infrared wavelengths, although imaging observations were made for all of them using the VLT.
Five of these objects (APMPM J02077214, APMPM J02445203, LHS 2555a, APMPM J03312349, APMPM J12122126) have small optical-to-infrared indices ( 4 and 1.5) typical of early-M dwarfs (cf. Fig. 2) or subdwarfs (§5). The other three objects (APMPM J00577604, APMPM J02324437, APMPM J05365358) have larger indices (5.2 6.2 and 2.1) similar to the spectroscopically-classified M5–M7 dwarfs in our sample. The brightest of these objects, APMPM J00577604 with 11.6, is most likely located within 50 pc and could be within 25 pc sample if its spectral type turns out to be later than M6.
9 Summary and outlook
We have presented optical and near-infrared photometry and spectroscopy for a sample of 71 red proper motion objects and we have classified 58 and 27 of them using optical and near-infrared spectroscopy, respectively; the remaining eight sources have optical and near-infrared photometry only.
The spectroscopic sample comprises 60 M dwarfs, 6 L dwarfs, and 5 subdwarfs. For the sources with both optical and near-infrared spectroscopy, we have observed a systematic shift in the near-infrared of about one subtype towards later spectral types. As a consequence, we have favoured the optical spectral types whenever possible for consistency with other approaches in the literature. Partly in connection with this, we have revisited the spectral typing of three previously published L dwarfs and two M dwarfs in the course of this work, generally finding them to have earlier types than before.
The large majority of the late-type dwarfs (spectral types later than M6) are located within 50 pc of the Sun and generally have small tangential velocities ( 50 km/s), whereas the early-type M dwarfs tend to have larger distances ranging from 100–200 pc and tangential velocities in the range 100–200 km/s. These correlations, of course, simply reflect the search strategy which we have employed, which is flux- and proper motion-limited. Intrinsically fainter sources can be nearby and need only have relatively low velocities; brighter, earlier-type stars can be picked up at larger distances, as long as they have larger space velocities. We see the previously known peak in chromospheric activity around M6–M7 and also provide mild confirmation for the finding by Gizis et al. (gizis00 (2000)) of a correlation between tangential velocity and chromospheric activity over the restricted spectral type range M8–M9.5. However, as discussed in §7, our proper motion selection strategy is biased towards older, higher velocity sources, making it hard to assign any kind of statistical significance to the reality of this effect.
Among the subdwarfs in the sample, four are classified as extreme subdwarfs and one of these, SSSPM 05005406 is among the coolest M subdwarfs discovered to date with an estimated spectral type of esdM6. The fact that we have not discovered any new L subdwarfs perhaps suggests that Population II may be deficient in substellar objects with respect to Population I, i.e., the local field. This is contrary to expectations: very metal-poor gas has a reduced dust cooling efficiency (less effective gas-to-dust coupling) and thus should yield smaller minimum Jeans mass fragments. These should then be able to collapse to form brown dwarfs before they merge into larger objects, and thus in theory yield large numbers of substellar objects (Zinnecker zinnecker95 (1995)). However, the search strategies for Population II brown dwarfs (substellar subdwarfs) still suffer from various selection biases, with the general problem of identifying very large proper motions at the magnitude limit of optical surveys and difficulties in optimising the colour search parameters.
Finally, we have identified several interesting new sources worthy of more detailed follow-up observations, including trigonometric parallax measurements, spectroscopy in the lithium line to search for evidence of a substellar nature, searches for low-mass companions, and so on. Three of the new objects lie at close to 10 pc; four objects have proper motions larger than 1 arcsec/yr; two targets have been identified as common proper motion companions to previously known nearby objects; and some objects exhibit unusual blue colours, which might indicate the presence of a companion.
Acknowledgements.
Our survey for new, faint, high proper motion objects is based on the SuperCOSMOS Sky Surveys, i.e., digitised data obtained from scans of UKST and ESO Schmidt plates. We would like to thank the SuperCOSMOS team for producing such excellent data. All of the new observations presented in this paper were obtained with ESO’s telescopes on Paranal and La Silla, and we acknowledge the expertise of, advice from, and enriching discussions with the ESO support teams during the various runs. We thank the referee, John Gizis, for his kind report and some useful comments. This research has also made use of data products from the Two Micron All Sky Survey, which is a joint project of the University of Massachusetts and the Infrared Processing and Analysis Center, funded by the National Aeronautics and Space Administration and the National Science Foundation, as well as of the VizieR catalogue access tool, CDS, Strasbourg. We thank Gyula Szokoly for obtaining low-resolution observations of the objects APMPM J20364936 and LP 859-1 for us. Finally, NL and MJM thank the European Research Training Network on “The Formation and Evolution of Young Stellar Clusters” (HPRN-CT-2000-00155) for financial support.References
- (1) Baraffe, I., Chabrier, G., Allard, F., & Hauschildt, P. H. 1998, A&A, 327, 1054
- (2) Burgasser, A. J., Kirkpatrick, J. D., & Reid, I. N. 2000, AJ, 120, 473
- (3) Burgasser, A. J., Kirkpatrick, J. D., & Brown, M. E. 2002, ApJ, 564, 421
- (4) Burgasser, A. J., Kirkpatrick, J. D., Burrows, A., et al. 2003a, ApJ, 592, 1186
- (5) Burgasser, A. J., Kirkpatrick, J. D., McElwain, M. W., et al. 2003b, AJ, 125, 850
- (6) Burgasser, A. J., McElwain, M. W., & Kirkpatrick, J. D. 2003c, AJ, 126, 2487
- (7) Burgasser, A. J., McElwain, M. W., Kirkpatrick, J. D., et al. 2004, AJ, 127, 2856
- (8) Burgasser, A. J. 2004, ApJ, 614, 73
- (9) Close, L. M., Siegler, N., Freed, M., & Biller, B. 2003, ApJ, 587, 407
- (10) Cruz, K. L., & Reid, I. N. 2002, AJ, 123, 2828
- (11) Cruz, K. L., Reid, I. N., Liebert, J., et al. 2003, AJ, 126, 2421
- (12) Dahn, C. C., Harris, H. C., Vrba, F. J., et al. 2002, AJ, 124, 1170
- (13) Delfosse, X., Forveille, T., Martín, E. L., et al. 2001, A&A, 366, L13
- (14) Digby, A. P., Hambly, N. C., Cooke, J. A., et al. 2003, MNRAS, 344, 583
- (15) Epchtein, N., de Batz, B., Capoani, L., et al. 1997, Msngr 87, 27
- (16) Fan, X., Knapp, G. R., Strauss, M. A., et al. 2000, AJ, 119, 928
- (17) Geballe, T. R., Knapp, G. R., Leggett, S. K., et al. 2002, ApJ, 564, 466
- (18) Gizis, J. E. 1997, AJ, 113, 806
- (19) Gizis, J. E., Monet, D. G., Reid, I. N., et al. 2000, AJ, 120, 1085
- (20) Gliese, W., & Jahreiß, H. 1991, Preliminary Version of the Third Catalogue of Nearby Stars, ADC Selected Astronomical Catalogs Vol. 1—CD-ROM
- (21) Goldman, B., Delfosse, X., Forveille, T., et al. 1999, A&A, 351, L5
- (22) Hambly, N. C., MacGillivray, H. T., Read M. A., et al. 2001a, MNRAS, 326, 1279
- (23) Hambly, N. C., Irwin, M. J., & MacGillivray, H. T. 2001b, MNRAS, 326, 1295
- (24) Hambly, N. C., Davenhall, A. C., Irwin, M. J., & MacGillivray, H. T. 2001c, MNRAS, 326, 1315
- (25) Hambly, N. C., Henry, T., Subasavage, J., Brown, M., & Jao, W.-C. 2004, AJ, 128, 437
- (26) Hawkins, M. R. S., & Bessell, M. S. 1988, MNRAS, 237, 177
- (27) Hawley, S. L., Gizis, J. E., & Reid, I. N. 1996, AJ, 112, 2799
- (28) Henry, T. J., Ianna, P. A., Kirkpatrick, J. D., et al. 1997, AJ, 114, 388
- (29) Henry, T. J., Walkowicz, L. M., Barto, T. C., & Golimowski, D. A. 2002, AJ, 123, 2002
- (30) Ianna, P. A., & Fredrick, L. W. 1995, ApJ, 441, L47
- (31) Johnson, D. R. H., & Soderblom, D. R. 1987, AJ, 93, 864
- (32) Kendall, T. R., Delfosse, X., Martín, E. L., & Forveille, T. 2004, A&A, 416, L17
- (33) Kirkpatrick, J. D., & McCarthy, D. W. 1994, AJ, 107, 333
- (34) Kirkpatrick, J. D., Henry, T. J., & Irwin, M. J. 1997, AJ, 113, 1421
- (35) Kirkpatrick, J. D., Reid, I. N., Liebert, J., et al. 1999, ApJ, 519, 802
- (36) Kirkpatrick, J. D., Reid, I. N., Liebert, J., et al. 2000, AJ, 120, 447
- (37) Leggett, S. K., Geballe, T. R., & Fan, X. 2000 ApJ, 536, L35
- (38) Lépine, S., Shara, M. M., & Rich, R. M. 2002, AJ, 124, 1190
- (39) Lépine, S., Shara, M. M., & Rich, R. M. 2003a, ApJ, 585, L69
- (40) Lépine, S., Rich, R. M., & Shara, M. M. 2003b, ApJ, 591, L49
- (41) Lépine, S., Rich, R. M., & Shara, M. M. 2003c, AJ, 125, 1598
- (42) Lépine, S., Shara, M. M., & Rich, R. M. 2003d, AJ, 126, 921
- (43) Leonard, P. J. T., & Tremaine, S. 1990, ApJ, 353, 486
- (44) Lodieu, N., Scholz, R.-D., & McCaughrean, M. J. 2002, A&A, 389, L20
- (45) Luyten, W. J. 1979, LHS Catalogue, Second Edition, (Minneapolis: Univ. Minnesota Press)
- 1979– (80) Luyten, W. J. 1979–1980, New Luyten Catalogue of Stars with Proper Motions Larger than Two Tenths of an Arcsecond. (Minneapolis: Univ. Minnesota), ADC Selected Astronomical Catalogs Vol. 1—CD-ROM
- (47) Martín, E. L., Delfosse, X., Basri, G., et al. 1999, AJ, 118, 2466
- (48) Martín, E. L. 2000, in R. Rebolo & M. R. Zapatero Osorio, eds., “Very low mass stars and brown dwarfs”, (Cambridge: Cambridge University Press), p153
- (49) Meillon, L., Crifo, F., Gomez, A., Udry, S., & Mayor, M. 1997, in B. Battrick, ed., “Hipparcos Venice ’97”, ESA-SP 402, p591
- (50) McCaughrean, M. J., Scholz, R.-D., & Lodieu, N. 2002, A&A, 390, L27
- (51) McCaughrean, M. J., Close, L. M., Scholz, R.-D., et al. 2004, A&A, 413, 1029
- (52) Monet, D. G., Levine, S. E., Canzian, B., et al. 2003, AJ, 125, 984
- (53) Moorwood, A. F. M., & Spyromilio, J. 1997, in J. Bergeron, ed., “The Early Universe with the VLT”, (Heidelberg: Springer), p21
- (54) Phan-Bao, N., Crifo, F., Delfosse, X., et al. 2003, A&A, 401, 959
- (55) Pokorny, R. S., Jones, H. R. A., & Hambly, N. C. 2003, A&A, 397, 575
- (56) Reid, I. N., Hawley, S. L., & Gizis, J. E. 1995, AJ, 110, 1838
- (57) Reid, I. N., Kirkpatrick, J. D., Gizis, J. E., et al. 1999, ApJ, 527, L105
- (58) Reid, I. N., Kirkpatrick, J. D., Gizis, J. E., et al. 2000, AJ, 119, 369
- (59) Reid, I. N., Burgasser, A. J., Cruz, K. L., et al. 2001, AJ, 121, 1710
- (60) Reid, I. N., & Cruz, K. L. 2002, AJ, 123, 2806
- (61) Reid, I. N., Kilkenny, D., & Cruz, K. L. 2002, AJ, 123, 2822
- (62) Reid, I. N., Kirkpatrick, J. D., Liebert, J., et al. 2002, AJ, 124, 519
- (63) Reid, I. N., Cruz, K. L., Laurie, S. P., et al. 2003, AJ, 125, 354
- (64) Reylé, C., Robin, A. C., Scholz, R.-D., & Irwin, M. J. 2002, A&A, 390, 491
- (65) Ruiz, M. T., Leggett, S. K., & Allard, F. 1997, ApJ, 491, 107
- (66) Ruiz, M. T., Wischnjewsky, M., Rojo, P. M., & Gonzalez, L. E. 2001, ApJS, 133, 119
- (67) Salim, S., Lépine, S., Rich, R. M., & Shara, M. M. 2003, ApJ, 586, 149
- (68) Scholz, R.-D., Irwin, M. J., Ibata, R., Jahreiß, H., & Malkov, O. Yu. 2000, A&A, 353, 958
- (69) Scholz, R.-D., Meusinger, H., & Jahreiß, H. 2001, A&A, 374, L12
- (70) Scholz, R.-D., Szokoly, G. P., Andersen, M., Ibata, R., & Irwin, M. J. 2002, ApJ, 565, 539
- (71) Scholz, R.-D., & Meusinger, H. 2002, MNRAS, 336, L49
- (72) Scholz, R.-D., McCaughrean, M. J., Lodieu, N., & Kuhlbrodt, B. 2003, A&A, 398, L29
- (73) Scholz, R.-D., Lodieu, N., Ibata, R., et al. 2004a, MNRAS, 347, 685
- (74) Scholz, R.-D., Lehmann, I., Matute, I., Zinnecker, H. 2004b, A&A, 425, 519
- (75) Scholz, R.-D., Lodieu, N., & McCaughrean, M. J. 2004c, A&A, in press
- (76) Schweitzer, A., Scholz, R.-D., Stauffer, J. R., Irwin, M. J., & McCaughrean, M. J. 1999, A&A, 350, L62
- (77) Teegarden, B. J., Pravdo, S. H., Hicks, M., et al. 2003, ApJ, 589, L51
- (78) Skrutskie, M. F., Schneider, S. E., Stiening, R. et al. 1997, F. Garzon et al., eds., “The Impact of Large Scale Near-IR Sky Surveys”, ASSL vol. 210, (Dordrecht: Kluwer), p25
- (79) Tinney, C. G. 1998, MNRAS, 296, L42
- (80) Tinney, C. G., Burgasser, A. J., & Kirkpatrick, J. D. 2003, AJ, 126, 975
- (81) Tokunaga, A., & Koyabashi, N. 1999, AJ, 117, 1010
- (82) Vrba, F. J., Henden, A. A., Luginbuhl, C. B., et al. 2004, AJ, 127, 2948
- (83) Wroblewski, H., & Torres, C. 1994, A&AS, 105, 179
- (84) Wroblewski, H., & Costa, E. 1999, A&AS, 139, 25
- (85) York, D. G., Adelman, J., Anderson, J. E., et al. 2000, AJ, 120, 1579
- (86) Zinnecker, H. 1995, in C. G. Tinney, ed., “The bottom of the main sequence — and beyond”, (Heidelberg: Springer), p257