Early re-brightening of the afterglow of GRB 050525a ††thanks: Based on observations performed with TAROT at the Calern observatory
We present time resolved optical data acquired by the TAROT automated observatory on the afterglow of GRB 050525a from 6 to 136 minutes after the GRB. We evidence a rapid re-brightening of 0.65 magnitude of the afterglow at 33 min after the GRB. The decay slope is in the first part and is after the re-brightening event. The afterglow of GRB 050525a is the third known afterglow that exhibits a re-brightening event begining at 0.01–0.02 day in the rest time frame.
Key Words.:
gamma-ray : bursts1 Introduction
GRB 050525a was a very bright gamma-ray burst (GRB) detected on the 25th of May 2005 at 00:02:53.3 UT (hereafter ) by the BAT instrument on the Swift spacecraft (trigger=130088, Band et al. band2005 (2005)). The gamma-ray light curve shows that GRB 050525a is a multipeak GRB, with an emission lasting approximately 10 sec above 50 keV. The fluence of GRB 050525a in the range 20-1000 keV is 7.84 10-5 erg/cm2, and its peak energy is = 84 keV (Golenetskii et al. golenetskii2005 (2005)). Spectroscopic observations performed 11 hours after the GRB revealed absorption lines from the host galaxy at a redshift z=0.606 (Foley et al. foley2005 (2005)). At that redshift, and adopting a flat cosmology with , , and h, the isotropic-equivalent energy of GRB 050525a in the range 1 keV to 10 MeV is erg. The intrinsic peak energy of the time integrated spectrum is 1352 keV.
In this letter we report the early optical observations of the GRB 050525a afterglow, performed with the robotic TAROT observatory. The Gamma-ray bursts Coordinates Network (GCN) notice, providing celestial coordinates to ground stations, was send at 00:08:48 (Band et al. band2005 (2005)), too late to detect the hypothetical optical prompt emission. The first image of TAROT started at 00:08:52.1 UT, 5min59s after the GRB. The afterglow was detected on all images taken until the end of the night at the TAROT observatory (02:19 UT) at the coordinate quoted by Rykoff et al.Rykoff2005 (2005): R.A. 18h 32m 32.76s and Dec. +26 (J2000.0). These data provide a continuous follow-up from 6 to 136 minutes after the GRB. In this paper we show that the classical exponential decay was perturbated at 33 min by a re-brightening event.
Section 2 describes the technical details of the TAROT observations and of data reductions. In section 3, we compare our early time observations of GRB 050525a with those of other bursts with early optical observations (t 0.01-0.1 day) and dense sampling. In section 4 we discuss the theoretical interpretations which have been proposed to explain the early re-brightening of GRB optical afterglows.
2 TAROT observations
TAROT is a fully autonomous 25 cm aperture telescope installed at the Calern observatory (Observatoire de la Cote d’Azur - France). This telescope is devoted to very early observations of GRB optical counterparts. A technical description of TAROT can be read in Bringer et al. (Bringer99 (1999)) and in Bringer et al. (bringer2001 (2001)). The CCD camera is a commercial Andor based on a Marconi 4240 chip and is placed at the newtonian focus. The spatial sampling is 3.3 arcsec/pixel. The field of view is . The readout noise is 9 electrons rms. The readout time is 5 seconds (to read the entire 2048x2048 matrix with no binning).
The first image was taken less than 4 seconds after the position of GRB 050525a was provided by the GCN. A series of 76 images of various exposure times (15, 30, 60, 120 s) were performed without any filter (hereafter clear filter). On-line preprocessing software enable to provide calibrated images less than 2 minutes after they were taken (corrected by dark, flat and astrometrically calibrated from the USNO-A1.0 catalog).
On the first 31 images, the afterglow is bright enough to be measured with a good accuracy on individual images. Later images were co-added to increase the signal to noise. Due to the decreasing of flux during exposures, the mean date of an observation, , is not the middle of exposure; it must be interpolated between (start of the first frame) and (end of the last frame) such that the flux verify:
| (1) |
Considering afterglow decay flux law: , and assuming all times counted since ,
| if =+1 | (2) | ||||
| if +1 | (3) |
and values are computed by iterations. Initial values are computed taking =+1. Then the fit of the first light curve refines the value. The second iteration is enough to converge (see Table 1 and Fig. 1).
| (min) | CR | 2 | (min) | CR | 2 |
|---|---|---|---|---|---|
| 6.104 | 15.09 | 0.15 | 18.931 | 16.36 | 0.25 |
| 6.471 | 14.86 | 0.13 | 20.249 | 16.52 | 0.26 |
| 6.839 | 15.09 | 0.15 | 21.351 | 16.49 | 0.26 |
| 7.326 | 15.21 | 0.16 | 22.452 | 16.80 | 0.31 |
| 7.931 | 15.20 | 0.16 | 23.554 | 16.33 | 0.24 |
| 8.536 | 15.34 | 0.21 | 25.779 | 16.74 | 0.27 |
| 9.978 | 15.50 | 0.18 | 27.111 | 16.47 | 0.25 |
| 10.338 | 15.63 | 0.19 | 29.351 | 17.03 | 0.30 |
| 10.698 | 15.99 | 0.22 | 30.453 | 16.94 | 0.29 |
| 11.172 | 15.91 | 0.21 | 31.569 | 17.19 | 0.31 |
| 11.791 | 15.71 | 0.20 | 34.477 | 16.52 | 0.26 |
| 12.403 | 15.80 | 0.20 | 36.580 | 16.34 | 0.26 |
| 13.363 | 15.84 | 0.21 | 38.697 | 16.79 | 0.35 |
| 14.472 | 15.84 | 0.21 | 42.842 | 16.43 | 0.25 |
| 15.589 | 15.94 | 0.25 | 52.338 | 16.98 | 0.29 |
| 16.705 | 16.67 | 0.27 | 65.275 | 17.08 | 0.30 |
| 17.814 | 16.35 | 0.25 | 78.185 | 17.66 | 0.34 |
| 18.931 | 16.36 | 0.25 | 108.318 | 17.91 | 0.36 |
The presence of the star USNO-B1 1163-0325216 (R16.6), at about 15 arcsec north-west from the afterglow, perturbated the photometry, especially when the afterglow fades. The set of magnitudes provided by Klotz et al. (klotz2005 (2005)) was affected by this effect, which leads to a false plateau for dates 40 min after the trigger. To eliminate this effect, we computed an image (designated hereafter mask) of the field which does not show the afterglow. The mask is synthetized in two steps: first we oversampled the 76 images by a factor three and stack them to synthetize the sum. In this image, the afterglow and the star are well separated. The second step is to clear only the afterglow spot in order to synthetize the mask. The mask was normalized in flux for each image and was substracted, leading to images where only the afterglow appears (and some residuals of bright stars). Then we can extract the magnitude of the afterglow avoiding problems of contamination by the nearby star.
The GRB 030329 afterglow shows there is no colour effect during the first phases of decay (Zeh et al. 2003a , 2003b ). Taking this advantage, we performed differential photometry with two stars as reference: USNO-B1 1163-0325130 (R=11.25) and USNO-B1 1163-0325158 (R=14.00). First, we verified that the magnitude of reference stars does not vary. As we have no information about the afterglow colours (we used no filter), we do not obtain directly R magnitudes. We designated by CR, the unfiltered magnitudes calibrated by USNO-B1 R magnitudes of reference stars. As the airmass only varied from 1.13 to 1.05 during measurements, its effect on colours is assumed to be negligible (presumatly lower than 0.05 mag, much less than other uncertainties). As a consequence, it is possible to convert our CR magnitudes into standard R magnitudes by a simple offset (estimated lower than 0.2 magnitude, depending on the intrinsic colour differences between afterglow and reference stars). Anyway, the CR magnitudes allows the compute decay slope parameter .
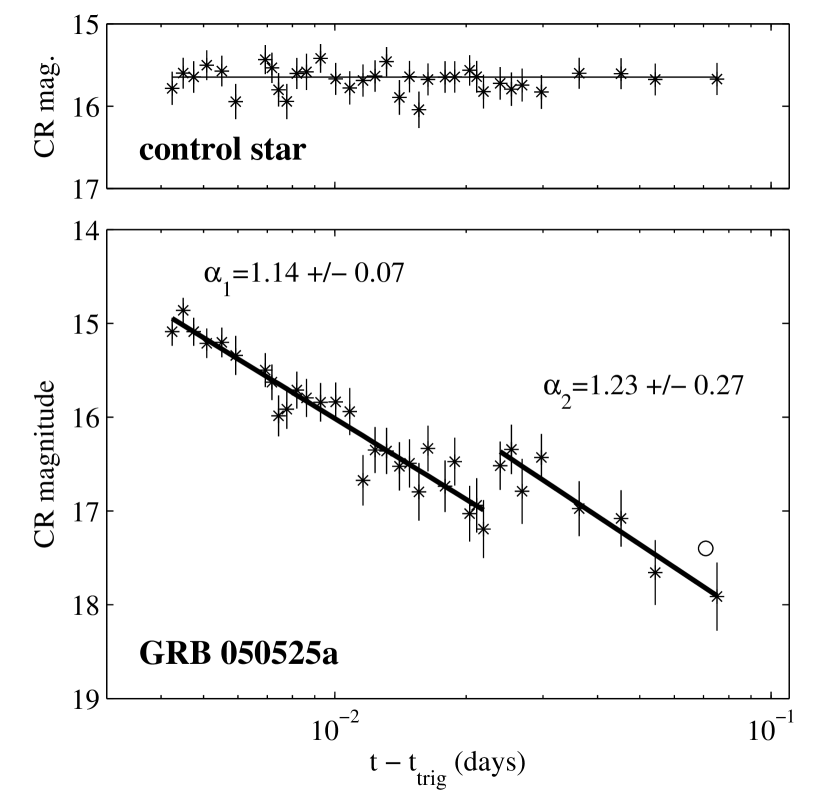
Light curve (Fig. 1) shows two parts separated at 33 min. Fits of slopes give and . Uncertainties are such that slopes are not significantly differents. The most important remark is the offset of about 0.65 magnitude (nearly a factor two) between the two parts. We can join the two curves by two extreme paths: i) a sharp re-brightening of 0.65 magnitude in less than 3 minute centered at 32.8 min, ii) a plateau (flat re-brightening) of CR 16.7, begining at 26 min and finishing at 43 min. The magnitude uncertainties of our measurements are too large to discriminate one assumption to the other.
On Fig. 1, we reported a measurement () obtained by Malesani et al. (malesani2005 (2005)). They used a large aperture telescope and a R filter. They found the afterglow 0.5 magnitude brighter than CR TAROT value. Less than 0.2 mag. of this offset can be due to the CR-R differences as explained in section 2. The remaining 0.3 mag may be due to the substraction of the USNO-B1 1163-0325216 nearby star. Due to a much larger aperture of telescope, Malesani mesurement is probably best accurate than the two last measurements obtained with TAROT. As a consequence =1.23 is probably over estimated.
To summarize, the re-brightening by a factor two of the afterglow of GRB 050525a is effective, the transition duration is comprised from less than 3 minutes () up to 17 minutes () centered at 32.8 min, and the slope of the temporal decay before and after the re-brightening are fully comparable.
3 Early optical GRB afterglows
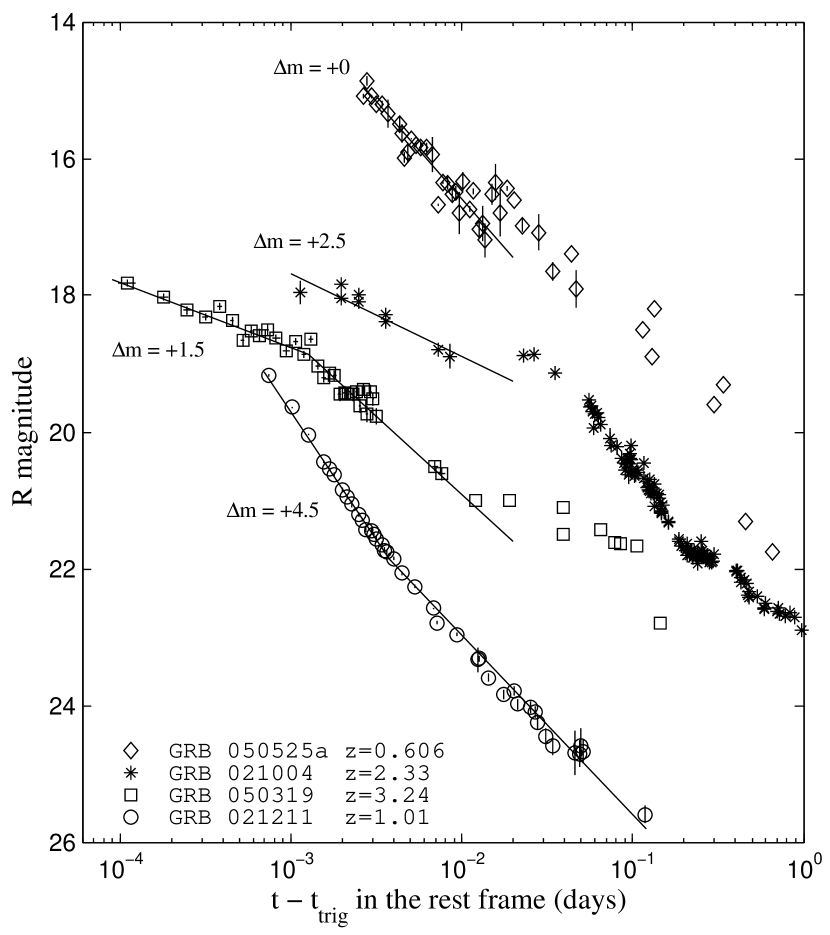
Only a few afterglows have been observed at optical wavelengths less than one hour after the GRB. They include GRB 990123, GRB 020418, GRB 021004 (z=2.33), GRB 021211 (z=1.01), GRB 041219a, GRB 050319 (z=3.24), GRB 050502a (z=3.79), and GRB 050525a (z=0.606) discussed in this paper. Within this small sample, short-scale variability seems to be the rule rather than the exception. This variability can be observed as single or multiple re-brightenings (GRB 021004, GRB 041219a, GRB 050319, GRB 050525a), as a shallowing (GRB 990123, GRB 021211) or a steepening(GRB 050319) of the light curve, or as a gradual rise of the afterglow (GRB 030418).
Figure 2 compares the early optical afterglows of four GRBs with a measured redshift (GRB 050502a is not included in this comparison since the data on its early afterglow have not yet been published). For a proper comparison, the abscissa of the plot gives the time after the trigger, in the referential of the GRB. A striking feature is the presence of an episode of re-brightening starting 0.01 to 0.02 days after the trigger, in three out of the four GRBs displayed in figure 2.111GRB 041219a, whose redshift is not known, exhibits a re-brightening episode starting 17 min, or 0.012 day, after the trigger (Blake et al. 2005). At first glance the three GRBs which exhibit rebrightnening episodes do not have special properties. GRB 040319 is a single pulse GRB, while GRB 021004 and GRB 050525a are multi-peak events. The isotropic-equivalent energies and rest frame peak energies of GRBs in figure 2 are 12.6 1052 erg and 135 keV for GRB 050525a, erg for GRB 050319222The peak energy of GRB 050319 is not known., 5.1 1052 erg and 266 keV for GRB 021004, and 1.4 1052 erg, and 92 keV for GRB 021211. Since three out of four GRBs with early optical follow-up exhibit re-brightening episodes, it is tempting to conclude that they represent a common feature of GRB afterglows. This remark clearly points out the necessity of very quick optical follow-up to measure the decay slope before 0.01 day (14 min), required to assess the time and amplitude of possible re-brightenings in future GRBs.
4 Discussion and conclusion
Within the context of the internal/external shock model of GRBs, re-brightening episodes have been explained by the reverse shock, by a continuing activity of the central engine, by a variable density profile of the external environment in which the fireball expands, by the presence of neutrons in the ejecta, or by the destruction of dust surrounding the source.
Late afterglow emission is explained as the forward shock component of external shock produced by the interaction of the expanding fireball with the external medium. Very early optical emission is thought to be an effect of the reverse shock component of the external shock. The emergence of the forward shock from the reverse shock emission component produces a shallowing of the early-time light curve after an initial steep decay that can mimick a re-brightening (Panaitescu & Kumar panaitescu2004 (2004)). Indeed this model has been recently invoked to explain the phenomenology of GRB 050525a (Shao & Dai Shao05 (2005)).
Variable energy input model also predicts early light curve re-brightenings (Nakar et al. nakar2003 (2003)). The energy variability could be provided by refreshed shocks produced by massive and slow shells ejected late in the GRB, that collide with the inital blast wave when it has decelerated. After the collision of each shell, the flux from the fireball increases but the light curve decay will continue with the same rate as prior to the collision. The net result is a shift upward of the initial light curve at the time of the collision with same decay rate as before collision (Bjornsson et al. bjornsson2004 (2004)). Alternatively, a variable energy input coud be due to initial energy (per solid angle) inhomogeneities in the jet (patchy shell model described by Kumar & Piran 2000b ).
In the variable density scenario, clumpy inter-stellar matter (ISM) or variable wind expelled from the massive progenitor, produces high density regions that, interacting with the expanding fireball, could provide flux enhancements if particular electron cooling conditions are satisifed (e.g. Lazzati et al. lazzati2002 (2002)). In this case, in fact, the flux would be sensitive to density variations only in the ’slow cooling regime’, with the observed frequency below the cooling frequency (Sari et al. Sari98 (1998)). The recovery of the initial slope after the bump could be achieved requiring a decrease in the density below the initial value immediately after the high density region (Lazzati et al. lazzati2002 (2002)).
Afterglow re-brightening has been predicted also by the neutron-fed afterglow model when the already decelerating ion shell sweeps up the trail of decay products left from the ahead decaying neutron shell. The arrival time of the re-brightening depends on the Lorentz factor of the neutron shell and can vary from few seconds to several tens of days after the burst (Beloborodov Beloborodov2003 (2003)).
Finally, dust destruction mechanisms might provide an enhancement of the observed optical flux within a time scale that depends, among several other parameters, on the density distribution of the circumburst dust. A decreasing of reddening is predicted in this case (Perna et al. perna2003 (2003)).
GRB 050525a is, after GRB 050319, the second GRB with a known distance, with detailed observations of the early afterglow at optical (this paper) and X-ray wavelengths (Band et al. band2005 (2005)). This proves that, eigth years after the discovery of GRB afterglows, a new window opens: multi-wavelength observations of the very early afterglow (the first hour). This remarkable advance has been possible thanks to the availability of arcminute localizations quickly distributed to efficient robotic telescopes, and to the excellent performance of the XRT on-board SWIFT. The observations presented in this paper demonstrate the richness of the information contained in the very early afterglow, and the great promises of the multi-wavelength observations which are now within our range.
Acknowledgements.
The TAROT telescope has been funded by the Centre National de la Recherche Scientifique (CNRS), Institut National des Sciences de l’Univers (INSU) and the Carlsberg Fundation. It has been built with the support of the Division Technique of INSU. We thank the technical staff joined with the TAROT project: G. Bucholtz, J. Esseric, C. Pollas and Y. Richaud.References
- (1) Band, D.et al. 2005 GCNC 3466
- (2) Beloborodov, A. M. 2003, ApJ 585, L19
- (3) Bjornsson, G., Gudmundusson, E.H. & Johannesson, G. 2004, ApJ, 615, L77
- (4) Blake, C.H., et al. 2005, Nature, 435, 181
- (5) Bringer, M., et al., 1999, A&AS 138, 581
- (6) Bringer, M., et al. 2001, Exper. Astrophys 12, 34
- (7) Foley, R.J., et al., 2005, GCNC 3483
- (8) Fox, D.W. et al. 2003a, Nature, 422, 284
- (9) Fox, D.W. et al. 2003b, ApJ, 586, L5
- (10) Golenetskii, S., et al., 2005, GCNC 3474
- (11) Holland, S., et al., 2002, AJ, 128, 1955
- (12) Klotz, A., Boër, M. & Atteia, J.L., 2005, GCNC 3473
- (13) Kumar, P. & Piran, T. 2000b, ApJ, 532, 286
- (14) Lazzati, D. et al. 2002, A&A, 396, L5
- (15) Li et al., 2003, ApJ, 586, L9
- (16) Malesani, D., et al., 2005, GCNC 3469
- (17) Nakar, E., Piran, T. & Granot, J. 2003, New Astron., 8, 495
- (18) Panaitescu, A. and Kumar, P. 2004, MNRAS, 353, 511
- (19) Perna, R., Lazzati, D. & Fiore, F. 2003, ApJ, 585, 775
- (20) E.S. Rykoff, E.S., et al. 2005, GCNC 3465
- (21) Sari, R., Piran, T. and Narayan, R. 1998, ApJL, 497, L17
- (22) Shao, L., & Dai, Z.G., 2005, submitted to ApJ, astro-ph/0506139
- (23) Wozniak, P.R. et al. 2005, ApJ, accepted
- (24) Zeh, A., et al. 2003a GCNC 2047
- (25) Zeh, A., et al. 2003b GCNC 2115