High-resolution spectroscopy of the old open cluster Collinder 261: abundances of Iron and other elements ††thanks: Based on observations collected at ESO telescopes under programme 65.N-0286
We present the analysis of high resolution spectra of six red giant stars in the old open cluster Collinder 261. Reddening values for individual stars, derived from the relation between colours and temperatures (deduced from our fully spectroscopic analysis) are consistent with previous determinations based on photometry. For this cluster we derive an iron abundance of [Fe/H] = 0.03 0.03. We also obtain the abundances of light metals (O, Na and Al), -elements (Mg, Si, Ca, Ti), elements of the Fe-group (Sc, Cr, Mn, Co, Ni) and the neutron-capture element Ba. No intrinsic star-to-star scatter is present in any of these elements within our sample. We compare our findings with previous investigations on this cluster, discussing in detail differences in analysis methods and results.
Key Words.:
Stars: abundances – Stars: atmospheres – Stars: Population I – Galaxy: disk – Galaxy: open clusters – Galaxy: open clusters: individual: Collinder 2611 Introduction
This is the second paper of a series devoted to the study of detailed elemental abundances of open clusters (OCs), with the final goal of deriving the time evolution of abundances and of the radial abundance gradient in the Galactic disk.
Collinder 261 (Cr 261) is a populous system located in the inner Galactic disk (), and is of particular interest for such studies because it is one of the oldest disk clusters (with an age of 5 to 11 Gyr, see Janes & Phelps 1994; Mazur et al. 1995, Gozzoli et al. 1996, Carraro et al. 1998). Despite its old age, both photometric (ibidem) and spectroscopic (Friel at el. 2002, Friel et al. 2003) studies estimate a solar or only slightly sub-solar metallicity. This cluster is therefore one of the few examples of old and rather metal rich simple stellar population, and represents an important test for stellar evolutionary models. It is moreover an important test particle to understand the Galaxy conditions at early epochs in the disk, the effect of the environment on the survival and evolution of a bound system, the effect of Galactic chemical evolution on the metallicity of clusters formed at different distances from the Galactic centre, and the evolution of the chemical abundance gradient.
We have been studying open clusters as tracers of the Galaxy evolution for several years, and to this purpose we are building a large and homogeneous database of photometry and high-resolution spectroscopy, to infer ages, distances, reddening values and chemical abundances. The most recent results from the photometric project can be found in Tosi et al. (2004) and Bragaglia & Tosi (2005, and in preparation). Using high resolution spectroscopy of clump and red giant branch (RGB) stars, we have analysed so far NGC 6819 (Bragaglia et al. 2001), NGC 2506, NGC 6134 and IC 4651 (Carretta et al. 2004a, hereafter C04).
The metallicity of large samples of open clusters has been traditionally derived from photometric data or low-resolution spectroscopy (see e.g. Janes 1979, Panagia & Tosi 1981, and the extensive analyses by Friel 1995, Twarog et al. 1997, and Friel et al. 2002). Both these methodologies lead to relatively inaccurate results and do not allow to estimate the abundances of individual chemical species. So far, only in a few cases high-resolution spectra have been used for open clusters. Cr 261 is one of them, since Friel et al. (2003, hereafter F03) have recently derived abundances of iron, oxygen and other elements from high-resolution spectra of four of its red giants. However, since homogeneity is one of the requirements of our global study of OCs, we have performed an independent study, applying our standard abundance analysis to six stars of Cr 261, using spectra with better resolution than F03’s. Four of the stars are also F03 targets, and have therefore been used to evaluate the uncertainties on the abundances resulting from different approaches, a very useful by-product.
The outline of this paper is the following: we describe our observations in Section 2; we derive the atmospheric parameters and iron abundances in Section 3, and we compare the reddening derived from our spectroscopy with the photometric one in Section 4; our results on abundances are presented and extensively compared with the values inferred by F03 in Section 5, and with other clusters in Section 6; the overall results are summarized in Section 7.
2 Observations
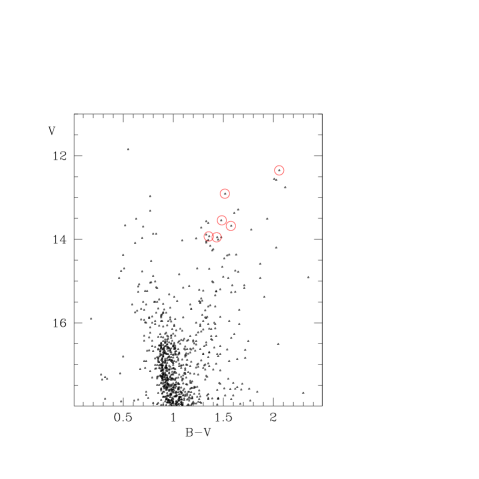
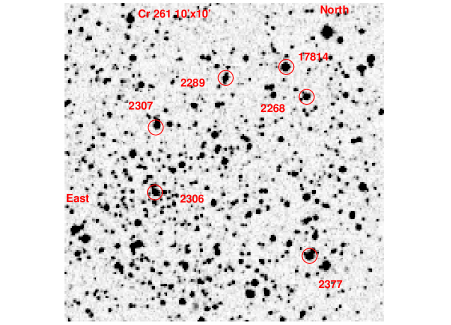
We observed six stars in Cr 261 with FEROS at the 1.5m telescope in La Silla (Chile) from April 28 to May 1 2000 (see C04 for details). We selected Red Clump (RC) and RGB stars from the photometric data of Gozzoli et al. (1996) for which membership information was kindly made available by E. Friel in advance of publication. Core Helium burning RC stars are the best targets for spectroscopic studies of evolved populations, since they represent a quite homogeneous group, and their temperatures are sufficiently high for a safe analysis based on model atmospheres. However, given the telescope size, the relatively faint magnitude of the RC in Cr 261, and the need of high S/N spectra, we only observed two clump stars, together with four RGB ones, two of which are only slightly brighter than the clump. A finding chart for all the observed targets is shown in Fig. 1, and the cluster CMD is presented in Fig. 2, where the 6 stars are marked. Table 1 gives a log of the observations, and useful information on the selected stars. S/N values are measured near 6700 Å. For multiple exposures, radial velocity and S/N refer to the final, co-added spectra.
| ID | ID | Ra | Dec | V | B-V | K | S/N | RV | Date obs. | UT | Exp |
|---|---|---|---|---|---|---|---|---|---|---|---|
| PJM | (2000) | (2000) | 2MASS | kms-1 | start | (s) | |||||
| 17814 | 1871 | 12:37:43.608 | -68:19:55.06 | 12.350 | 2.060 | 7.907 | 130 | -26.85 | 2000 Apr 29 | 3:27:25 | 3600 |
| 2377 | 2105 | 12:37:34.828 | -68:23:24.99 | 12.908 | 1.517 | 9.184 | 95 | -25.34 | 2000 Apr 30 | 6:09:47 | 3600 |
| 2000 Apr 30 | 6:09:47 | 3600 | |||||||||
| 2307 | 1045 | 12:38:08.499 | -68:21:15.01 | 13.547 | 1.487 | 9.788 | 85 | -25.56 | 2000 May 01 | 3:16:43 | 3600 |
| 2000 May 01 | 3:16:43 | 3600 | |||||||||
| 2289 | 1485 | 12:37:55.557 | -68:20:14.36 | 13.680 | 1.577 | 9.801 | 85 | -27.63 | 2000 Apr 29 | 4:37:56 | 3600 |
| 2000 Apr 29 | 5:41:30 | 3600 | |||||||||
| 2268 | 2001 | 12:37:38.681 | -68:20:25.87 | 13.932 | 1.356 | 10.696 | 75 | -25.37 | 2000 Apr 29 | 6:48:44 | 3600 |
| 2000 Apr 30 | 3:45:22 | 3600 | |||||||||
| 2000 Apr 30 | 4:48:33 | 3600 | |||||||||
| 2306 | 1080 | 12:38:07.420 | -68:22:30.82 | 13.952 | 1.435 | 10.343 | 70 | -25.31 | 2000 May 01 | 5:42:01 | 3600 |
| 2000 May 01 | 6:45:03 | 3600 |
3 Analysis
3.1 Atmospheric parameters
To derive effective temperatures, gravities and microturbulent velocities we followed exactly the procedure described in C04 (Section 3). Our adopted atmospheric parameters, derived from a fully spectroscopic analysis, are listed in Table 2.
| Star | Teff | nr | log(n) | [Fe/H]i | nr | log(n) | ||||
|---|---|---|---|---|---|---|---|---|---|---|
| (K) | (dex) | (km s-1) | Fe i | Fe ii | ||||||
| 17814 | 3980 | 0.43 | 1.44 | 94 | 7.223 | 0.139 | -0.31 | 9 | 7.182 | 0.190 |
| 2377 | 4180 | 1.59 | 1.29 | 124 | 7.456 | 0.145 | -0.08 | 8 | 7.408 | 0.188 |
| 2307 | 4470 | 2.07 | 1.23 | 126 | 7.548 | 0.157 | 0.00 | 10 | 7.493 | 0.189 |
| 2289 | 4340 | 1.76 | 1.27 | 113 | 7.484 | 0.128 | -0.06 | 12 | 7.433 | 0.172 |
| 2268 | 4580 | 1.83 | 1.26 | 122 | 7.522 | 0.114 | -0.02 | 11 | 7.472 | 0.188 |
| 2306 | 4500 | 2.09 | 1.23 | 114 | 7.536 | 0.152 | 0.00 | 11 | 7.485 | 0.256 |
3.2 Equivalent widths
We measured the s employing an updated version of the spectrum analysis package developed in Padova by one of us (RG), following the method described in Bragaglia et al. (2001). Continuum tracing, a difficult task at these metallicities and cool temperatures, was checked with spectrum synthesis of Fe i and Fe ii lines, and the ensuing analysis was done as amply described in C04.
Fe lines were considered only in the interval 5500-7000 Å to minimize problems in the continuum tracing due to line crowding blueward of this region, and contamination by telluric lines and possible fringing effects in the red. Sources of oscillator strengths and atomic parameters are the same as given by Gratton et al. (2003): discussion and references can be found in that paper.
Errors in s are estimated to be 4 mÅ, and were determined comparing the s of Fe i lines in the two stars 2307 and 2268, of similar atmospheric parameters and intermediate S/N ratios.
| Ratio | [A/H] | EW | tot.1 | tot.2 | ||||
| (+60 K) | (+0.2 dex) | (+0.05 dex) | (+0.14 km/s) | (dex) | (dex) | |||
| (1) | (2) | (3) | (4) | (5) | (6) | (7) | (8) | (9) |
| Fe/HI | +0.037 | +0.017 | +0.006 | 0.038 | 120 | +0.013 | 0.053 | 0.058 |
| Fe/HII | 0.067 | +0.111 | +0.018 | 0.028 | 10 | +0.044 | ||
| O/FeI | +0.001 | 0.019 | 0.012 | 0.069 | 4 | +0.070 | 0.069 | 0.101 |
| Na/FeI | +0.018 | 0.058 | 0.005 | 0.046 | 6 | +0.057 | 0.049 | 0.095 |
| Mg/FeI | 0.005 | 0.040 | 0.001 | 0.053 | 8 | +0.049 | 0.053 | 0.083 |
| Al/FeI | +0.010 | 0.022 | 0.009 | 0.064 | 2 | +0.099 | 0.065 | 0.121 |
| Si/FeI | 0.061 | +0.018 | +0.004 | 0.059 | 17 | +0.034 | 0.085 | 0.093 |
| Ca/FeI | +0.032 | 0.047 | 0.006 | 0.011 | 17 | +0.034 | 0.034 | 0.067 |
| Sc/FeII | +0.062 | 0.031 | 0.002 | 0.022 | 9 | +0.047 | 0.066 | 0.087 |
| Ti/FeI | +0.063 | 0.025 | 0.009 | 0.008 | 23 | +0.029 | 0.064 | 0.075 |
| Ti/FeII | +0.060 | 0.033 | 0.001 | 0.010 | 10 | +0.044 | 0.061 | 0.082 |
| Cr/FeI | +0.033 | 0.029 | 0.006 | 0.008 | 38 | +0.023 | 0.034 | 0.051 |
| Cr/FeII | +0.022 | 0.026 | 0.005 | 0.021 | 8 | +0.049 | 0.030 | 0.063 |
| Mn/FeI | +0.037 | 0.034 | +0.001 | 0.002 | 7 | +0.053 | 0.037 | 0.073 |
| Co/FeI | 0.007 | +0.014 | +0.002 | 0.016 | 8 | +0.049 | 0.017 | 0.054 |
| Ni/FeI | 0.020 | +0.020 | +0.003 | 0.023 | 37 | +0.023 | 0.030 | 0.043 |
| Ba/FeII | +0.080 | 0.045 | +0.002 | 0.051 | 2 | +0.099 | 0.095 | 0.144 |
3.3 Errors on atmospheric parameters
Uncertainties in atmospheric parameters have been estimated as in C04. We find values very similar to the ones in C04, as expected since we are dealing with stars of similar metallicity and evolutionary status observed with the same instrumentation. We give here only a concise presentation, and refer to C04 for an extensive description and discussion.
Errors in effective temperatures:
they were estimated from the errors in the slope of the relation between Fe i abundances and line excitation potentials. If we exclude the star near the tip (in C04 we found that the adopted model atmospheres from the Kurucz grid are not adequate for the analysis of stars near the tip of the Red Giant Branch of open clusters), we estimate a standard error of 93 21 (rms=47) K; we adopt 90 K, that corresponds to an average rms of 0.013 dex eV-1 in the slope.
This error includes two different terms: i) a random component (the true internal error), that affects s measurement, and that reflects errors from Poisson statistics, read-out noise, etc; and ii) a systematic component, that is the same for each line in all stars, and reflects e.g. the presence of blends, or uncertain line oscillator strengths. As computed in C04, the random component is about 60 % of the total error, so the internal random error in Teff is 56 K.
Errors in surface gravities:
since our parameters have been derived entirely from spectroscopy, there are only two contributions to random errors: from the uncertainty in Teff and from the measurement errors of the individual lines. To determine the first component, one has to take into account the variation in ionization equilibrium due to changes in atmospheric parameters. From Table 3 (see below for a description), considering our random error in Teff, we derive a contribution to the random error in of 0.22 dex.
The second component may be evaluated weighting the average rms of abundances from a single line (random error: 0.088 dex) with the number of lines (120 for Fe i and 10 for Fe ii) and finding, using again Table 3, what difference in gravity is implied. We find that the s contribute 0.067 dex to the random error in .
Adding in quadrature the two components, we obtain a total random uncertainty in the adopted gravity of 0.23 dex.
Errors in microturbulent velocities:
We used star 2289 and repeated the analysis changing until the 1 value from the original slope of the relation line strengths-abundances was reached; the corresponding error is 0.15 km s-1, 60 % of which is random, i.e. 0.09 km s-1.
Since the values are derived from a relation (see C04), we have to take into account also the rms scatter (0.17 km s-1) around this relation. To obtain the final estimate of the error we have to subtract (in quadrature) from this value the random error given just above. The final error on is then 0.14 km s-1.
Sensitivity of abundances to atmospheric parameters:
Table 3 shows the sensitivity of the derived abundances to variations in atmospheric parameters (Cols. 2 to 5; note that these variations have the same size of the actual internal errors), and to errors in s (Col. 7, where the average error from a single line is weighted by the square root of the mean number of lines, given in Col. 6). This is done for iron and for the other elements measured in this paper, and is derived for the RC star 2268, as representative of the whole sample.
As discussed in C04, these sensitivities are computed assuming that errors on the single parameters are independent of each other, but this is not the case: e.g., Teff’s and gravities, and Teff’s and microturbulent velocities are strictly correlated. Col. 8 of Table 3 shows the random error in abundance for all the elements considered, taking into account only the dominant uncertainty sources, i.e. Teff and and the effect of their covariance. This amounts to 0.053 dex for [Fe/H]i. Taking into account all the uncertainty sources, we obtain instead 0.058 dex. This second kind of estimate is given in Col. 9, also for all other elements.
4 Reddening estimates from spectroscopy
Our Teff’s are completely spectroscopic, i.e. reddening-free, so they can be used to derive an estimate of the cluster reddening independently of the photometric determination. The method has been discussed in C04. Shortly, from the Teff and the colour-temperature relation of Alonso et al. (1999) we determine the de-reddened colour for each star, and the reddening follows from the comparison with the observed colour.
This can be done for several photometric systems; we have searched the BDA (Mermilliod 1995, and http://obswww.unige.ch/webda/webda.html) and the Simbad databases for data on Cr 261. There are two papers presenting and photometry, namely Gozzoli et al. (1996) and Mazur et al. (1995; but they have published information only for the variable stars). Janes et al. (1994) provide only and ; no data in the Strömgren system was found. We took the photometry from 2MASS (Cutri et al. 2003: Point Source Catalogue, All-Sky Data Release, http://www.ipac.caltech.edu/2mass/) and transformed it to the TCS system. We adopted the colour-temperature transformations by Alonso et al. (1999) for and , taking into account the cluster metallicity, and derived an estimate of the E value [adopting : Cardelli et al. 1989] for all stars except the one near the RGB tip, which is too cool. Results are presented in Table 4, where the average reddening values were computed without the two doubtful cases (see below).
| Star | E(B-V) | E(B-V) | Notes |
| (B-V) | (V-K) | ||
| 2377 | 0.150: | 0.222: | contam. ? |
| 2307 | 0.307 | 0.397 | |
| 2289 | 0.316 | 0.374 | |
| 2268 | 0.238 | 0.254: | contam. ? |
| 2306 | 0.274 | 0.358 | |
| average | 0.299 | 0.376 | 3 stars |
| 0.022 | 0.020 |

We notice that there are two discrepant cases (star 2377 both in and , and star 2268 only in ), with reddening values much lower than the other stars. Excluding a strong differential reddening, which was not found by any photometric study, a very plausible explanation is that their bluer colours are caused by blends; being these stars among the reddest ones in the cluster, the possibility of a blend with a bluer object is not negligible.
We have checked our original photometric images for star 2377, but could not find any strong indication in favour of (or against) another component. Star 2377 is about 0.12 mag bluer than expected, with = 1.52 instead of 1.64. We have estimated the effect of possible blends on star 2377, and found that we would get B–V and V–K colours consistent with the observed ones by blending an RGB star of the same magnitude as star 2377 with an object just brighter than the MS turn-off of Cr 261 (i.e. with V16.0, B16.9 and K14.8). Since such contaminating candidates are numerous in the observed field, the chances for blends are not negligible. Moreover, we cannot exclude additional blends in the K band, due to the worse resolution of the 2MASS photometry. The faintness of the blended objects relative to our RGB stars explains the absence of related features in the observed spectra.
Furthermore, star 2377 has an anomalous position in the , CMD (see Fig. 3(a)), being bluer than the expected RGB locus, but its position is closer to the RGB in the , CMD (Fig. 3(b)), and absolutely correct if we consider its Teff (Fig. 3(c)). We take this as further evidence in favour of a blend.
A second interesting result is that we derive from a reddening lower by 0.077 mag than from : 0.299 (=0.022) and 0.376 (=0.020) respectively. This may require a value of R, the ratio between selective and total absorption, higher than the ’normal’ 3.1: a value of R near 3.8 would be more appropriate to explain the difference. This value is not extreme (see e.g. the case of M 4, where Ivans et al. (1999) find R = 3.4 0.4). Geminale & Popowski (2004) have recently determined RV values for Milky Way stars using ultraviolet colour excesses, and the ones for the two stars nearest to Cr 261 are definitely larger than 3.1: HD109399, with an approximate distance to Cr 261 of 4.4 deg has RV = 4.26, while HD109867, with a distance of about 1.1 deg, has RV = 3.67.
Another solution would be an error in the photometry, either in the 2MASS values, or in the Johnson-Cousins ones of Gozzoli et al. (1996). In the latter case, this would require an error of about 0.08 mag in , which is hard to justify: Gozzoli et al. (1996) compared their CMDs to the ones by Mazur et al. (1995) and found them perfectly consistent, even if no star-to-star comparison could be done.
Of course, a combination of both explanations is also possible: new photometry or larger samples of spectra are required to settle this matter.
Finally, we notice that the infrared maps of Schlegel et al. (1998) give E= 0.433 for the location of the cluster; however Cr 261 is near the Galactic plane () and Schlegel et al. caution against use of their maps for .
5 Comparison with previous works: metallicity
Cr 261 was included among the old OCs studied by Friel et al. (2002) by means of moderate resolution spectroscopy (1.8 Å pix-1) with Argus at CTIO. They observed 25 bright stars, confirming membership for 21 of them, and deduced a mean metallicity of [Fe/H]=0.16 dex (=0.13 dex).
F03 observed stars 17814, 2377, 2307, and 2306 at a resolution of R = 25000, and typical S/N of 80, using the echelle spectrograph mounted at the CTIO 4m telescope. Our spectra have similar S/N and exposure times, but about twice their resolution; this is due to the very high efficiency of FEROS compared to the spectrograph used by F03.
To overcome problems with line-blanketing, which is rather severe in these cool and metal rich stars, F03 determined the continuum level of their spectra from the comparison with a spectrum of Arcturus of similar resolution. From the analysis of equivalent widths they estimated an average iron abundance for the cluster of [Fe/H] = 0.05, and roughly solar oxygen and -elements abundance ratios.
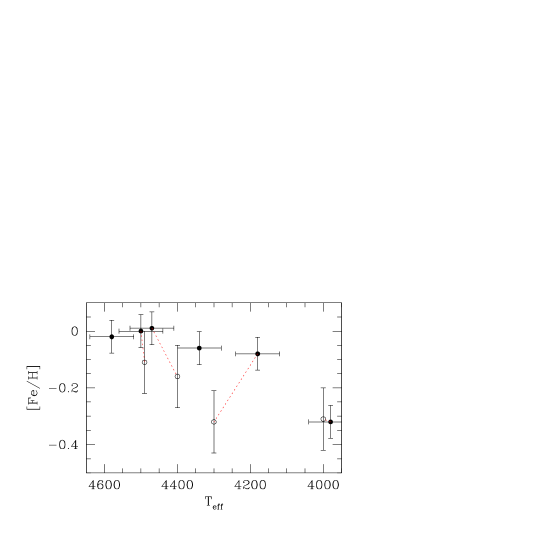
Table LABEL:noifriel presents a direct comparison of values obtained in the present work and by F03 for radial velocity, atmospheric parameters, and iron abundance. Fig. 4 shows a graphic comparison between abundances of Fe i, plotted against Teff. A trend of lower [Fe/H] with decreasing Teff is clearly visible; this is not unusual for analyses of cool, metal rich stars. Notice however that in our study the five stars with higher Teff give [Fe/H] values in complete agreement with each other. The only really discrepant value is for the star near the RGB tip (for which, nonetheless, F03 results are almost identical to ours).
| ID | RV | Teff | IDF03 | RVF03 | TeffF03 | F03 | F03 | ||||
|---|---|---|---|---|---|---|---|---|---|---|---|
| (km s-1) | (K) | (dex) | (km s-1) | (km s-1) | (K) | (dex) | (km s-1) | ||||
| 17814 | -26.85 | 3980 | 0.43 | 1.44 | -0.32 | 1871 | -26.0 | 4000 | 0.7 | 1.5 | -0.31 |
| 2377 | -25.34 | 4180 | 1.59 | 1.29 | -0.08 | 2105 | -25.2 | 4300 | 1.5 | 1.5 | -0.32 |
| 2307 | -25.56 | 4470 | 2.07 | 1.29 | 0.01 | 1045 | -24.8 | 4400 | 1.5 | 1.2 | -0.16 |
| 2306 | -25.31 | 4500 | 2.09 | 1.26 | 0.00 | 1080 | -24.5 | 4490 | 2.2 | 1.2 | -0.11 |
Several factors may contribute to these differences:
i) The use of different atmospheric models (Kurucz and MARCS). However, both analyses are differential (with respect to the Sun and Arcturus), and the difference in abundances should be minimal.
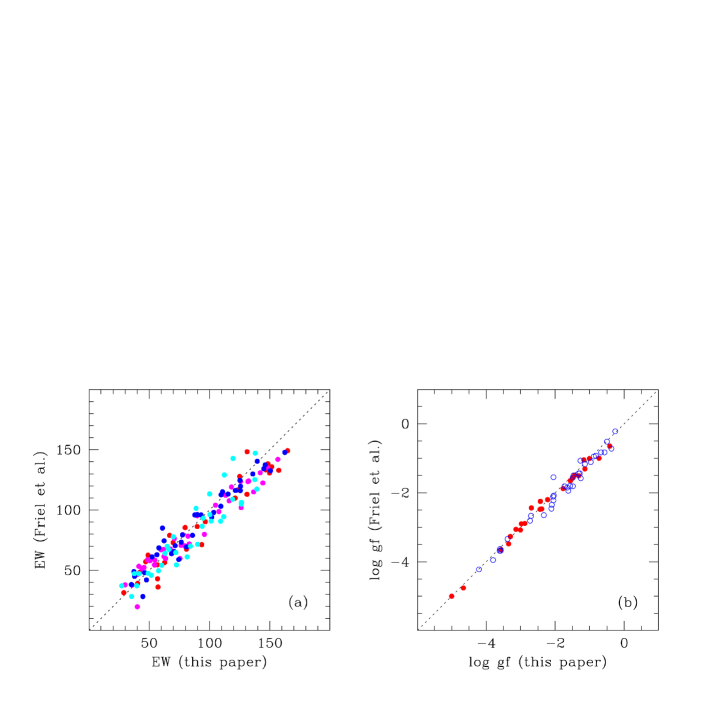
ii) The different format and resolution of the spectra. We have a larger coverage in wavelength, so we measure more than 100 Fe i lines for each star, instead of about 40 as in the F03 study. Our resolution is about twice as large, which allows easier continuum tracing and measurement of blended lines. We have compared the s for the lines in common [see Fig.5(a)]: the mean difference between the two sets of s is 3.8 mÅ (rms = 10.7 mÅ), in the sense ours minus F03’s. The internal error on s is 4 mÅ in our spectra, and 7 mÅ in F03. This translates also into a different dispersion in the Fe abundances, which is less than 0.14 dex in our case and slightly more than 0.2 dex in F03.
iii) Different ’s. The two studies adopt slightly different values [as shown if Fig. 5(b)], ours being on average larger111 F03 compared their ’s with literature sources, finding that their values were systematically smaller. For the 24 Fe i lines in common, the average difference is 0.04 dex. This implies the derivation of larger values for the microturbulent velocity ’s and smaller abundances.
iv) Other differences in the analysis methods. These effects are more difficult to assess, given the number of assumptions and methodologies. There is one point that surely introduces large differences: the determination of the microturbulent velocity by zeroing the slope of abundances from individual Fe i lines versus s. As we understand it, F03 found eliminating trends with measured s, while we used a mean relation between and . The values of used to this purpose were found by zeroing the trend of Fe i abundances versus s expected on the basis of model atmospheres. Our approach follows the prescriptions by Magain (1984), and it should be preferred to the technique used by F03 because in the latter case random errors on measured s produce systematically larger ’s, and hence smaller abundances. To quantify this effect, we have re-determined the Fe i abundance for star 2377, the one for which the [Fe/H] values differ most, applying our method to F03 s and ’s, and with Kurucz atmospheres. We started from the published atmospheric parameters and iterated until no trend with expected s was present; the final solution we found for this star is Teff=4320, =1.60, =1.25, and [Fe/H]=0.07, much closer to our values. We suggest that the different approach to estimate is the major source of the abundance difference.
The adopted solar abundances for iron are very close in the two studies: (Fe)=7.54 in our case and 7.52 in F03 (E. Friel, private communication). If we translate their results for the metal abundance of Cr 261 to our scale, we obtain [Fe/H]=0.24 dex, slightly increasing the nominal difference.
| element | nr | abu. | nr | abu. | Solar | ||
| ———17814——— | ———2289——— | ||||||
| i | 94 | 0.32 | 0.14 | 113 | 0.06 | 0.13 | 7.54 |
| ii | 9 | 0.31 | 0.19 | 12 | 0.06 | 0.17 | 7.49 |
| i a | 1 | 0.08 | 8.52 | ||||
| i b | 1 | 0.57 | 1 | 0.25 | 8.79 | ||
| i a | 1 | 0.04 | 8.79 | ||||
| i | 5 | 0.87 | 0.17 | 5 | 0.36 | 0.08 | 6.21 |
| i | 8 | 0.31 | 0.15 | 5 | 0.09 | 0.17 | 7.43 |
| i | 5 | 0.37 | 0.13 | 6 | 0.18 | 0.19 | 6.23 |
| i | 9 | 0.13 | 0.11 | 18 | 0.22 | 0.21 | 7.53 |
| i | 11 | 0.29 | 0.10 | 16 | 0.08 | 0.13 | 6.27 |
| ii | 5 | 0.19 | 0.17 | 6 | 0.16 | 0.14 | 3.13 |
| i | 24 | 0.28 | 0.23 | 23 | 0.06 | 0.22 | 5.00 |
| ii | 11 | 0.03 | 0.21 | 12 | 0.11 | 0.15 | 5.07 |
| i | 33 | 0.02 | 0.19 | 38 | 0.07 | 0.17 | 5.67 |
| ii | 3 | 0.32 | 0.04 | 7 | 0.08 | 0.12 | 5.71 |
| i | 3 | 0.14 | 0.07 | 6 | 0.02 | 0.16 | 5.34 |
| i | 4 | 0.10 | 0.22 | 4 | 0.12 | 0.07 | 4.92 |
| i | 28 | 0.16 | 0.18 | 36 | 0.03 | 0.19 | 6.28 |
| ii | 2 | 0.35 | 0.06 | 2 | 0.35 | 0.04 | 2.22 |
| ———2268——— | ———2377——— | ||||||
| i | 122 | 0.02 | 0.11 | 124 | 0.08 | 0.15 | 7.54 |
| ii | 11 | 0.02 | 0.19 | 8 | 0.08 | 0.19 | 7.49 |
| i a | 1 | 0.16 | 1 | 0.07 | 8.52 | ||
| i b | 1 | 0.30 | 1 | 0.35 | 8.79 | ||
| i a | 1 | 0.23 | 1 | 0.08 | 8.79 | ||
| i | 5 | 0.22 | 0.03 | 5 | 0.37 | 0.07 | 6.21 |
| i | 8 | 0.19 | 0.23 | 7 | 0.30 | 0.19 | 7.43 |
| i | 6 | 0.10 | 0.14 | 6 | 0.22 | 0.14 | 6.23 |
| i | 16 | 0.16 | 0.12 | 16 | 0.31 | 0.18 | 7.53 |
| i | 10 | 0.01 | 0.09 | 9 | 0.04 | 0.08 | 6.27 |
| ii | 6 | 0.06 | 0.13 | 7 | 0.15 | 0.14 | 3.13 |
| i | 23 | 0.21 | 0.20 | 23 | 0.15 | 0.23 | 5.00 |
| ii | 9 | 0.11 | 0.17 | 9 | 0.02 | 0.11 | 5.07 |
| i | 40 | 0.06 | 0.19 | 36 | 0.02 | 0.19 | 5.67 |
| ii | 7 | 0.03 | 0.10 | 5 | 0.19 | 0.24 | 5.71 |
| i | 6 | 0.04 | 0.16 | 6 | 0.07 | 0.10 | 5.34 |
| i | 4 | 0.11 | 0.21 | 5 | 0.00 | 0.17 | 4.92 |
| i | 44 | 0.02 | 0.16 | 46 | 0.12 | 0.19 | 6.28 |
| ii | 2 | 0.15 | 0.09 | 2 | 0.34 | 0.02 | 2.22 |
| ———2307——— | ———2306——— | ||||||
| i | 126 | 0.01 | 0.16 | 114 | 0.00 | 0.15 | 7.54 |
| ii | 10 | 0.00 | 0.19 | 11 | 0.01 | 0.26 | 7.49 |
| i a | 1 | 0.26 | 1 | 0.02 | 8.52 | ||
| i b | 1 | 0.34 | 1 | 0.25 | 8.79 | ||
| i a | 1 | 0.21 | 1 | 0.06 | 8.79 | ||
| i | 5 | 0.38 | 0.08 | 5 | 0.33 | 0.09 | 6.21 |
| i | 9 | 0.13 | 0.16 | 8 | 0.15 | 0.16 | 7.43 |
| i | 6 | 0.02 | 0.18 | 6 | 0.14 | 0.11 | 6.23 |
| i | 16 | 0.26 | 0.19 | 17 | 0.23 | 0.17 | 7.53 |
| i | 14 | 0.04 | 0.16 | 0 | 0.04 | 0.13 | 6.27 |
| ii | 6 | 0.15 | 0.16 | 6 | 0.10 | 0.09 | 3.13 |
| i | 21 | 0.19 | 0.21 | 21 | 0.03 | 0.23 | 5.00 |
| ii | 12 | 0.00 | 0.16 | 8 | 0.03 | 0.14 | 5.07 |
| i | 34 | 0.10 | 0.15 | 40 | 0.05 | 0.21 | 5.67 |
| ii | 6 | 0.14 | 0.10 | 5 | 0.05 | 0.39 | 5.71 |
| i | 6 | 0.06 | 0.17 | 6 | 0.05 | 0.14 | 5.34 |
| i | 4 | 0.13 | 0.05 | 5 | 0.06 | 0.19 | 4.92 |
| i | 39 | 0.00 | 0.17 | 22 | 0.19 | 0.10 | 6.28 |
| ii | 2 | 0.38 | 0.01 | 3 | 0.30 | 0.01 | 2.22 |
6 Abundances
The iron abundances222In the analysis we used the reference solar values given by Gratton et al. (2003) in their Table 8, col. 5; for elements not studied in that paper (such as Co and Ba) we adopted the solar abundance from meteorites given in Anders and Grevesse (1989). All values are listed in Table 6. are given in Tables 2 and 6 for each star, and an average of [Fe/H]i= dex (rms=0.11, 6 stars) is found. However, this value includes star 17814 near the RGB tip, for which the analysis might be somewhat less reliable. In the following, we will exclude this star when reporting the average abundance ratios. Therefore, we adopt a final value of [Fe/H] dex (rms=0.03 dex, 5 stars) for the metallicity of Cr 261.
The error quoted here is given by the scatter in the results for individual stars, so it represents a measure of the internal errors. It agrees with (actually, it is smaller than) the errors expected from uncertainties in the atmospheric parameters. We do not attach much weight to this difference, since the sample includes only 5 stars. Systematic errors, not included in these estimates, are much larger and uncertain. However, our purpose is to construct a large and homogeneous set of abundances for open clusters. The error bar that we quote is then to be considered as the individual error for Cr 261 around the mean relation defined in our series of papers.
We also derived abundance ratios [X/Fe] for the light metals (O, Na and Al), elements (Mg, Si, Ca, Ti i and Ti ii), elements of the Fe-group (Sc, Cr i, Cr ii, Mn, Co, Ni) and the neutron-capture element Ba ii. Detailed abundance ratios for these elements are given in Table 6, along with the number of lines used in the analysis and the 1 rms variance.
Mean abundance ratios for the cluster are given in the second column of Table 7. The 1 errors around the mean values are generally comparable to, or smaller than, what is expected from the errors in atmospheric parameters and s (see Table 3). This suggests that no intrinsic star-to-star scatter is present within our sample.
In the third column of Table 3 we list for comparison the original values obtained by F03, while in the last column we recomputed their average values by accounting for the different adopted solar abundances (in F03 they mostly come from Anders and Grevesse 1989, apart from the iron solar value mentioned above).
| Element | [X/Fe] | [X/Fe] | [X/Fe] | ||
|---|---|---|---|---|---|
| us | us | F03 | F03 | F03,conv. | |
| Fe i | 0.03 | 0.04 | 0.22 | 0.11 | 0.24 |
| C i a | 0.11 | 0.11 | |||
| O i a | 0.12 | 0.09 | 0.10 | 0.15 | 0.01 |
| O i b | 0.30 | 0.04 | 0.10 | 0.15 | 0.01 |
| Na i | 0.33 | 0.06 | 0.48 | 0.22 | 0.62 |
| Mg i | 0.17 | 0.07 | 0.07 | 0.12 | 0.24 |
| Al i | 0.12 | 0.08 | 0.39 | 0.12 | 0.65 |
| Si i | 0.24 | 0.05 | 0.22 | 0.09 | 0.26 |
| Ca i | 0.01 | 0.05 | 0.04 | 0.10 | 0.07 |
| Sc ii | 0.12 | 0.04 | |||
| Ti i | 0.12 | 0.09 | 0.07 | 0.09 | 0.06 |
| Ti ii | 0.06 | 0.04 | 0.06 | 0.01 | 0.17 |
| Cr i | 0.01 | 0.06 | 0.19 | 0.13 | 0.17 |
| Cr ii | 0.06 | 0.09 | |||
| Mn i | 0.03 | 0.04 | |||
| Co i | 0.01 | 0.10 | |||
| Ni i | 0.06 | 0.08 | 0.02 | 0.04 | 0.01 |
| Ba ii | 0.30 | 0.08 |
6.1 The light elements O, Na, Al
The oxygen abundances given in Table 6 are only preliminary values computed from the measured equivalent widths of the forbidden [O i] 6300.31 Å line, which is a primary O indicator. We checked that the oxygen lines in all Cr 261 stars were not affected by telluric components by comparison to an early type star.
Recently, Johansson et al. (2003) recomputed the laboratory oscillator strength of the weak, high excitation Ni i line at 6300.35 Å, claimed to be a significant contaminant of the forbidden [O i] line in the Sun by Allende Prieto et al. (2001). To evaluate this contamination, we computed the s of the Ni line using the [Ni/Fe] ratios we determined for our program stars in Cr 261, and the by Johansson et al. The contribution of Ni to the s of the forbidden [O i] line ranges from about 20% up to 40% in the program stars.
In order to derive reliable O abundances, a careful synthesis of the [O i] lines is necessary, including not only the contribution of the nearby Ni line but also the coupling with C abundances. This requires solving the set of related dissociation equations and will be deferred to a forthcoming paper on C, N, O abundances in OCs. First estimates of the C abundances from the spectral synthesis of the C2 molecular features at 5086 Å provide an average ratio [C/Fe] dex, dex (5 stars, excluding the tip giant). With this slight underabundance of C, the average [O/Fe] ratio from the synthesis of the [O i] 6300.31 line would be of 0.12 dex ( dex, 5 stars). This is in good agreement with the results of F03, who adopted the C abundance from Arcturus ([C/Fe] dex). The derived preliminary values are shown in Table 6.
We measured the s of the Na i doublets at 5682-88, 6154-60 and 8184-93 Å; the Na abundaces were computed excluding the 5682 Å line, since it is clearly discrepant. Our Na abundances were corrected for departures from the LTE following Gratton et al. (1999). Abundances derived from the 5 lines in the three different doublets are in good agreement with each other, while in F03 there is a larger line-to-line scatter, likely because they did not consider non-LTE effects for the 5682-5688 Å doublet.
As usual among old OCs, [Na/Fe] ratios are enhanced with respect to stars of similar metallicity in the Galactic field (see e.g. the compilation given by F03 in their table 7). Our average [Na/Fe] is +0.33 dex, less than that found by F03 (they derived +0.48, or +0.45 if we exclude the RGB tip star). If we account for the different solar abundances adopted, the F03 value becomes even larger ([Na/Fe]=+0.62 dex).
Our analysis shows a very small star-to-star scatter, and this result is quite robust, since it is based on 5 lines of 3 different doublets, falling in different spectral regions. Apart from the slightly discrepant star 2268 (with [Na/Fe]=+0.22), the other four stars share the same Na abundances within a few hundredths of dex ([Na/Fe] = +0.36, rms=0.02). Although the sample is limited, this may imply that open cluster stars do not experience the same phenomenon of different star-to-star Na-enhancement affecting most globular cluster giants (for a recent review, see Gratton et al. 2004).
For Al, we measured all the 3 subordinate doublets used by Carretta et al. (2004b). As discussed there the correction for non-LTE effects should increase with decreasing metallicity, therefore we consider it negligible in our case.
The [Al/Fe] ratios we determined are slightly above solar, but also in this case less than in F03’s study: our average [Al/Fe] is +0.12 dex, as compared to their value of +0.40 dex (or +0.65 dex, once corrected to our scale). With our determination, Cr 261 does show the same behaviour - at least for Al - of field disk stars of solar metallicity, as is the case for most old open clusters. So, while it appears that the [Na/Fe] ratio is enhanced (and also shows a rather large scatter, of more than 0.4 dex) in old open clusters with respect to their field counterparts of similar metallicity, the Al enhancement is not so widespread.
In the past several authors have discussed the possibility that the large enhancements in Na and (to a lesser extent) in Al may be due to the same mechanism acting in more metal-poor evolved giants, such as those of globular clusters: internal mixing. However, this hypothesis presents several shortcomings:
-
•
A Na-O anticorrelation, signature of proton-capture reactions at high temperature in the same site where the ON and NeNa cycles occur (see Gratton et al. 2004 for a recent review), has not been observed yet in open cluster stars.
-
•
it is now acknowledged that the bulk of abundance anomalies in globular cluster stars is produced elsewhere than in the observed stars themselves, since star-to-star variations in all the main elements involved (C, N, O, Na, Al: Gratton et al. 2001, Carretta et al. 2004c) are observed down to unevolved dwarfs. Intermediate-mass AGB stars of a previous generation are the favoured candidate polluters (see Gratton et al. 2004).
-
•
It has been suggested (e.g. Lotz & Friel 1995) that most red giants in old open clusters exhibit little or no variation in the CN band strengths, at odds with what is observed in globular cluster giants. In the internal mixing scenario, C and N are the first elements to be affected by any little composition change due to non-canonical mechanisms connecting the outer envelope with inner regions near the energy generating CNO-burning shell. However, no inhomogeneities in the N abundance are detected among dwarf stars in the old open cluster M 67 (Hufnagel 1996), and the spread in CN observed in giants of the old cluster NGC 6791 (Hufnagel et al. 1995) is compatible with the normal changes undergone by a star when evolving along the red giant branch.
6.2 The -elements
We derived the abundances of the -elements Mg i, Si i, Ca i, Ti i and Ti ii. These four ”-elements”, which are often taken together, do not appear to have all the same behaviour, as already noticed for other open clusters and stellar populations. Perhaps bundling them together is not the best way to examine the evolution of elements with time, or with iron abundance. For example, Ti can be considered either as the heaviest element synthesized by -capture processes or one of the lightest elements in the Fe-group (e.g. Wheeler et al. 1989).
Our [Mg/Fe] and [Si/Fe] abundance ratios are both above solar (at +0.17 dex and +0.24 dex, respectively) for this near solar metallicity cluster. As far as Mg is concerned, Cr 261 closely follows the behaviour of all the other old OCs studied so far, and the trend with metallicity defined by Galactic field stars. However, Si is much more discrepant with respect to the same field stars, both in our analysis and in the one by F03, and in about half the clusters for which reliable Si abundances from high-resolution spectroscopy exist.
Before giving too much weight to these results, we have to verify whether they could be due to some error in the abundance analysis. For instance, a Teff underestimated by about 200 K would bring the [Mg/Fe] and [Si/Fe] ratios closer to solar. The use of higher temperatures would also increase the values derived from the ionization equilibrium of Fe by about 0.6 dex, putting them in better agreement with the ones derived from the location of the stars in the CMD. However, such warmer temperatures would also result in metallicities higher by about 0.15 dex, values that are not supported by the synthetic CMDs or by any other spectroscopic metallicity estimate.
A more interesting possibility is that the adopted model atmospheres are not fully adequate even for these relatively warmer stars. Temperature gradients steeper than those of the Kurucz model atmospheres may reconcile most of the residual discrepancies: ionization equilibrium with gravities from the CMD; abundance ratios of Mg and Si with Fe against solar abundances; overall metal abundance from spectroscopy and photometry. Such steeper gradients might be due to e.g. the effects of adiabatic expansion of raising gas columns in 3-d model atmospheres, as shown by Asplund and collaborators (e.g. Asplund et al. 2000). However, reliable 3-d model atmospheres are not yet available for red giants. We then prefer to keep the uniformity of our analysis throughout this series of papers, and not apply arbitrary modifications to the standard 1-d model atmospheres. The reader should however be cautioned of the possibility that small systematic deviations of abundance ratios from solar over the whole set of data might be due to the analysis method rather than to real abundance anomalies.
Cr 261 shows a nearly solar [Ca/Fe], in agreement with the other old OCs, where the Ca abundance traces that of Fe, although with a rather large scatter (of the order of 0.3 to 0.4 dex). The [Ti/Fe] ratios are slightly below solar and they closely follow the trend defined by field stars, again as found for the other old OCs. Cr 261 does not stand out in these distributions, although both our determination and F03’s are located near the bottom envelope of the [Ca/Fe] vs [Fe/H] scatter.
Finally, we note that the Ti i and ii values are in good agreement with each other, supporting the surface gravities derived from the iron lines. Note however that the regions in the atmosphere where Ti lines form are quite similar to those where Fe lines form (the same is valid for the Cr lines mentioned in the next subsection), so that this test does not exclude a steeper temperature gradient.
6.3 Elements of the Fe-group and Barium
Among the elements of the Fe-peak, the abundances of Sc ii, Mn i and Co i include corrections for hyperfine structure (HFS, see Gratton et al. 2003 for references). The good agreement of the mean abundance of Cr i and Cr ii supports the atmospheric parameters derived from our full spectroscopic analysis.
Among these elements, only the [Sc/Fe]ii ratio is slightly overabundant with respect to the solar value, but this is the typical behaviour of both disk field stars and of the other old OCs. The ratios of Cr (from both neutral and singly ionized lines), Mn, Co, and Ni to iron closely trace the behaviour of solar metallicity stars with [Fe/H].
The abundances of Ba, which is produced in neutron capture reactions, are important since they reflect the contribution to the chemical enrichment by AGB stars. At solar metallicity, Ba is mostly produced by the main -processes in low mass (1-3 M⊙) AGB stars, with a small contribution ( 15%) from -processes. The derivation of abundances in different metallicity regimes is a good method to study the metallicity dependence of the nucleosynthetic yields.
Abundances of Ba were derived in all the stars of our sample. We used the two subordinate lines of Ba ii at 5853 and 6496 Å that are free of HFS effects (Mashonkina and Gehren 2001). In order to check for possible effects of departures from LTE, we compared the abundances from the 5853 Å line (for which the effects are small, according to Mashonkina and Gehren) to the abundances obtained from the other subordinate line, for which they found more significative effects. The average difference is log n(Ba)6496 - log n(Ba), dex (6 stars), therefore we do not expect remarkable corrections for non-LTE, in this case.
The average [Ba/Fe] ratio derived in Cr 261 is quite high, with small star-to-star scatter, well within the uncertainties of the adopted atmospheric parameters. This would suggest a larger contribution of the low mass producers of process elements with respect to type Ia SNe, producing Fe but not Ba. However, at solar metallicity the [Ba/Fe] ratio in old open clusters seems to show a large scatter (about 0.5 dex). Although this may indicate a possible range in the ratio of contributions from AGB stars and SNe, we caution that the many differences involved in the abundance analysis of this element (HFS, application or lack of correction for departures from LTE) might introduce some spurious effect, masked as an intrinsic scatter.
7 Summary and conclusions
In this paper we have derived atmospheric parameters and elemental abundances for 6 giant stars in Cr 261. The iron abundance deduced from the 5 warmer stars in our sample is [Fe/H] = (rms 0.03).
This has been compared to the values of [Fe/H]= (Friel et al. 2002), and 0.20 (F03), and to the value found from photometric data with the synthetic CMD technique. Gozzoli et al. (1996) found that the best fits were generally obtained with the solar abundance tracks, and this has been confirmed by the new analysis with other, newer evolutionary tracks (Bragaglia & Tosi 2005, and in preparation): the cluster appears to be at a distance of about 2.7 kpc from the Sun, to have a reddening of E around 0.30, an age of about 6 Gyr and solar metallicity.
We also measured the reddening, comparing intrinsic colours derived from the spectroscopic temperatures and the Alonso et al. (1999) Teff-colour relations with the observed ones. We found values compatible with those based purely on photometric data, but two stars show hints of possible contaminations in the optical/IR photometry. We also found indication of a possible non-standard ratio between selective and total absorption.
We measured abundances for several elements other than iron, namely Na, Mg, Al, Si, Ca, Sc, Ti, Cr, Mn, Co, Ni, Ba. This is important if we want to compare the nucleosynthetic history of open clusters to that of field thin and thick disk stars, or to the halo components.
Systematic differences should be taken into account when comparing literature results; however, the sources of these differences are various, and a more detailed and critical analysis is deferred to another paper. To eliminate at least part of these systematic differences, the original abundance ratios of several other OCs and field disk stars were transformed to our scale by correcting for the different solar values adopted (Bragaglia et al. in preparation). We have compared in this way our abundances for Cr 261 with those previously obtained for this cluster and with those of several other OCs and of field disk stars. While Cr 261 seems to generally fit in the trends defined by old open clusters, more definitive conclusions on the similarities/dissimilarities between open clusters and other components of the Galaxy will have to wait until a larger sample of OCs is studied in a truly homogeneous way.
Acknowledgements.
We thank E. Friel for useful discussions and crucial information on cluster membership, and all the authors who sent us references on their adopted solar values. E.C. warmly thanks Jennifer Sobeck for enlightening discussions on Mn abundances and other issues. This research has made use of the SIMBAD data base, operated at CDS, Strasbourg, France, and of the BDA, maintained by J.-C. Mermilliod. This publication makes use of data products from the Two Micron All Sky Survey, which is a joint project of the University of Massachusetts and the Infrared Processing and Analysis Center/California Institute of Technology, funded by the National Aeronautics and Space Administration and the National Science Foundation. This work was partially funded by Cofin 2000-MN02241491 and Cofin 2003-029437 by the Italian MIUR.References
- (1) Allende Prieto, C., Lambert, D.L., Asplund, M. 2001, ApJ, 556, L73
- (2) Alonso, A., Arribas, S. & Martinez-Roger, C. 1999, A&AS, 140, 261
- (3) Anders, E., & Grevesse, N. 1989, Geochimica et Cosmochimica Acta, 53, 197
- (4) Asplund, M., Ludwig, H.-C., Nordlund, Å., & Stein, R.F., 2000, A&A, 359, 669
- (5) Bragaglia, A., et al. 2001, AJ, 121, 327
- (6) Bragaglia, A., & Tosi, M. 2005, in Chemical Abundances and Mixing in Stars in the Milky Way and its Satellites, L.Pasquini, S.Randich eds, Springer-Verlag Series ”ESO Astrophysics Symposia”, in press
- (7) Cardelli, J.A., Clayton, G.C., & Mathis, J.S. 1989, ApJ, 345, 245
- (8) Carraro, G., Bresolin, F., Villanova, S., Matteucci, F., Patat, F., Romaniello, M. 2004, AJ, 128, 1676
- (9) Carraro, G., Ng, Y.K., & Portinari, L. 1998, MNRAS, 296, 1045
- (10) Carretta, E., Bragaglia, A., Gratton R.G., & Tosi, M. 2004a, A&A, 422, 951 (C04)
- (11) Carretta, E., Gratton R.G., Bragaglia, A., Bonifacio, P. & Pasquini, L. 2004b, A&A, 416, 925
- (12) Carretta, E., Gratton R.G., Lucatello, S., Bragaglia, A., Bonifacio, P. 2004c, A&A, 433, 597
- (13) Cutri, R.M., et al. 2003, VizieR On-line Data Catalog: II/246, Originally published in: University of Massachusetts and Infrared Processing and Analysis Center, (IPAC/California Institute of Technology)
- (14) Friel, E.D. 1995, ARA&A, 33, 381
- (15) Friel, E.D., et al. 2002, AJ, 124, 2693
- (16) Friel, E.D., Jacobson, H.R., Barrett, E., Fullton, L., Balachandran, S.C., & Pilachowski, C.A. 2003, AJ, 126, 2372 (F03)
- (17) Geminale, A., & Popowski, P. 2004, AcA, 54, 275
- (18) Gozzoli, E., Tosi, M., Marconi, G., & Bragaglia, A. 1996, MNRAS, 283, 66
- (19) Gratton, R.G., Sneden, C., & Carretta, E. 2004, ARA&A, 42, 385
- (20) Gratton, R.G., Carretta, E., Eriksson, K., & Gustafsson, B. 1999, A&A, 350, 955
- (21) Gratton, R.G., Carretta, E., Claudi, R., Lucatello, S., & Barbieri, M. 2003, A&A, 404, 187
- (22) Gratton, R.G., Bonifacio, P., Bragaglia, A., Carretta, E., Castellani, V. et al. 2001, A&A, 369, 87
- (23) Janes, K.A. 1979, ApJS, 39, 135
- (24) Janes, K.A., & Phelps, R.L. 1994, AJ, 108, 1773
- (25) Johansson, S., Litz n, U., Lundberg, H., Zhang, Z. 2003, ApJ, 584, L107
- (26) Hufnagel, B. 1996, BAAS, 26, 1367
- (27) Hufnagel, B., Smith, G.H., Janes, K.A. 1995, AJ, 110, 693
- (28) Kurucz, R.L. 1995, CD-ROM 13, Smithsonian Astrophysical Observatory, Cambridge
- (29) Lotz, J., & Friel, E.D. 1995, BAAS, 26, 1486
- (30) Magain, P. 1984, A&A, 134, 189
- (31) Mashonkina, L., Gehren, T. 2001, A&A, 376, 232
- (32) Mazur, B., Krzeminski, W., & Kaluzny, J. 1995, MNRAS, 273, 59
- (33) Mermilliod, J.-C. 1995, in Information and On-Line Data in Astronomy, D. Egret, M.A. Albrecht eds, Kluwer Academic Press (Dordrecht), p. 127
- (34) Panagia, N., & Tosi, M. 1989, A&A, 96, 306
- (35) Phelps, R.L., Janes, K.A., & Montgomery, K.A. 1994, AJ, 107, 1079
- (36) Schlegel, D.J., Finkbeiner, D.P., & Davis, M. 1998, ApJ, 500, 525
- (37) Tautvaisiene, G., Edvardsson, B., Tuominen, I., & Ilyin, I. 2000, A&A, 360, 499
- (38) Twarog, B.A., Ashman, K.M., & Anthony-Twarog, B.J. 1997, AJ 114, 2556
- (39) Wheeler, J.C., Sneden, C., & Truran, J.W.Jr. 1989, ARA&A, 27, 279