The sub-damped Ly system toward HE 00012340:
galaxy formation at
††thanks: Based on observations carried out at the European
Southern Observatory (ESO), La Silla, under prog. ID No.
166.A-0106 with the UVES spectrograph at the ESO Very Large
Telescope, Paranal, Chile.
We present a detailed analysis of chemical abundances in a sub-damped Ly absorber (sub-DLA) at towards the quasar HE 00012340 (). Our study is based on high-resolution () spectroscopic data from the UVES instrument installed on the ESO Very Large Telescope (VLT). This sub-DLA system consists of at least 25 individual subcomponents spanning a restframe velocity range of km s-1. The total neutral hydrogen column density is log H i. Detected species include C ii, C iv, N i, N ii, O i, Mg ii, Al ii, Al iii, Si ii, Si iv, P ii, Fe ii, and possibly D i. For the dominating neutral gas component at km s-1 (relative to ) we derive an oxygen abundance of [O/H] (1/65 solar). With its extremely low nitrogen content ([N/H] and [N/O] ) the absorber exhibits a classic massive star abundance pattern. Our measurements place the absorber towards HE 00012340 among the systems with the lowest ever measured [N/] ratios in the Universe. The low [N/O] value is consistent with the idea that primary nitrogen production by the very first stars have enriched the intergalactic gas to a level of [N/O]. Peculiar abundances are found in the outermost blue components near km s-1 (in the restframe) where we observe significant overabundances of phosphorus ([P/C]), silicon ([Si/C]), and aluminum ([Al/C]) after correcting for the effects of ionization. Our study suggests that the sight line passes through the gaseous environment of one or more stellar clusters that locally enriched their interstellar neighbourhood by supernova ejecta generating the observed abundance anomalies. The large velocity spread of the entire absorption system points to a merger that triggers the formation of these clusters. We thus may be observing a young galaxy at that currently forms out of a merger event.
Key Words.:
cosmology: observations - galaxies: abundances - galaxies: evolution - quasars: absorption lines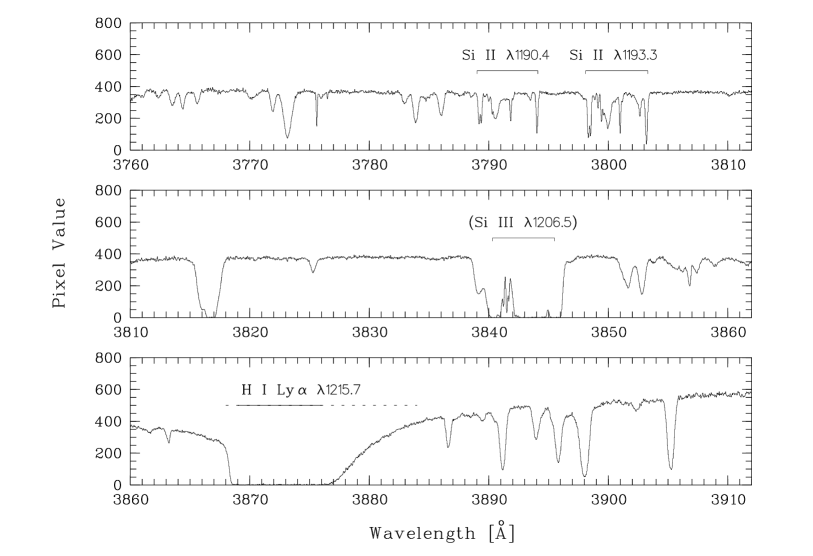
1 Introduction
Absorption line systems at high redshift provide a wealth of information about the chemical evolution of the early Universe. Next to the Ly forest and the Lyman limit systems that trace the low-density IGM or the intergalactic environment of galaxies at neutral hydrogen column densities of H i cm -2, the physical and chemical properties of absorbers with H i cm -2 are particularly interesting. These systems contain most of the neutral gas mass in the Universe at (Lanzetta, Wolfe, & Turnshek 1995; Wolfe et al. 1995) and consist of heavy elements in an abundance pattern that suggests the chemical enrichment by the first generations of stars (e.g., Lu et al. 1996; Prochaska & Wolfe 1999). Such absorbers therefore may represent progenitors of present-day galaxies.
Most of the information about abundances of metals, dust, and molecules in these systems has been obtained from the damped Ly systems (DLAs), which have H i column densities cm -2 (e.g., Ledoux, Petitjean, & Srianand 2003). Absorption systems with somewhat lower column densities ( cm H i cm -2) are the so-called sub-damped Ly systems (sub-DLAs; e.g., Dessauges-Zavadsky et al. 2003; P\a’eroux et al. 2003). While there is no compelling evidence that DLAs and sub-DLAs trace different classes of protogalactic objects, abundance measurements in sub-DLAs are of particular interest because of their absorption characteristics. For total H i column densities cm -2 and metallicities less than solar, the absorption lines from neutral oxygen and neutral nitrogen (two important elements for disentangling the complex chemical enrichment history of high- absorbers) are relatively weak. This enables us to derive accurate abundances for these two important elements in sub-DLAs without facing the problem of heavy line saturation in the oxygen lines.
In this paper we present the detailed analysis of a sub-damped Ly system at in the direction of the quasar HE 00012340. This paper represents the first one in a series of two dealing with the chemical and physical properties of particularly interesting sub-DLA systems in the data set of the ESO-VLT Large Programme “The Cosmic Evolution of the IGM”. This paper is organized as follows: in Sect. 2 we present the observations, the data reduction, and the data analysis method. Absorption by neutral and weakly ionized species is presented in Sect. 3. Sect. 4 deals with the properties of the highly ionized gas. We discuss the results in Sect. 5 and summarize our study in Sect. 6.
2 Observations, data handling, and analysis method
The quasar HE 00012340 (, ) was observed with the UVES instrument installed on the VLT as part of the ESO-VLT Large Programme “The Cosmic Evolution of the IGM”, which aims at providing a homogeneous data set of high-resolution (), high signal-to-noise (S/N) spectral data for QSO absorption line spectroscopy of the IGM in the redshift range between .
HE 00012340 was observed through a 1” slit (with a seeing typically ”) with two setups using dichroic beams splitters for the blue and the red arm (Dic 1, B346nmR580nm, and Dic 2, B437nm860nm, respectively). This setup provides a wavelength coverage from to Å, with small gaps near and Å. The total integration time (Dic 1 Dic 2) for HE 00012340 was 12 hours. The raw data were reduced using the UVES pipeline implemented in the ESO-MIDAS software package. The pipeline reduction includes flat-fielding, bias- and sky-subtraction, and a relative wavelength calibration. The individual spectra then have been coadded and corrected to vacuum wavelengths. The S/N in the spectrum generally is very high and attains a maximum of per resolution element for Å. In Fig. 1, a representative portion of the UVES spectrum of HE 00012340 in the wavelength range between and Å is displayed, showing selected absorption lines of the sub-DLA system at .
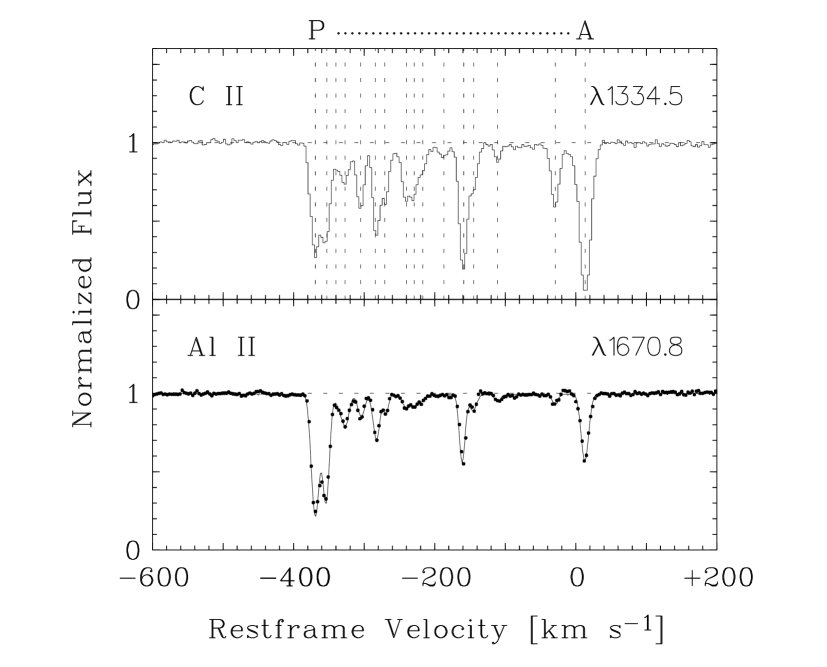
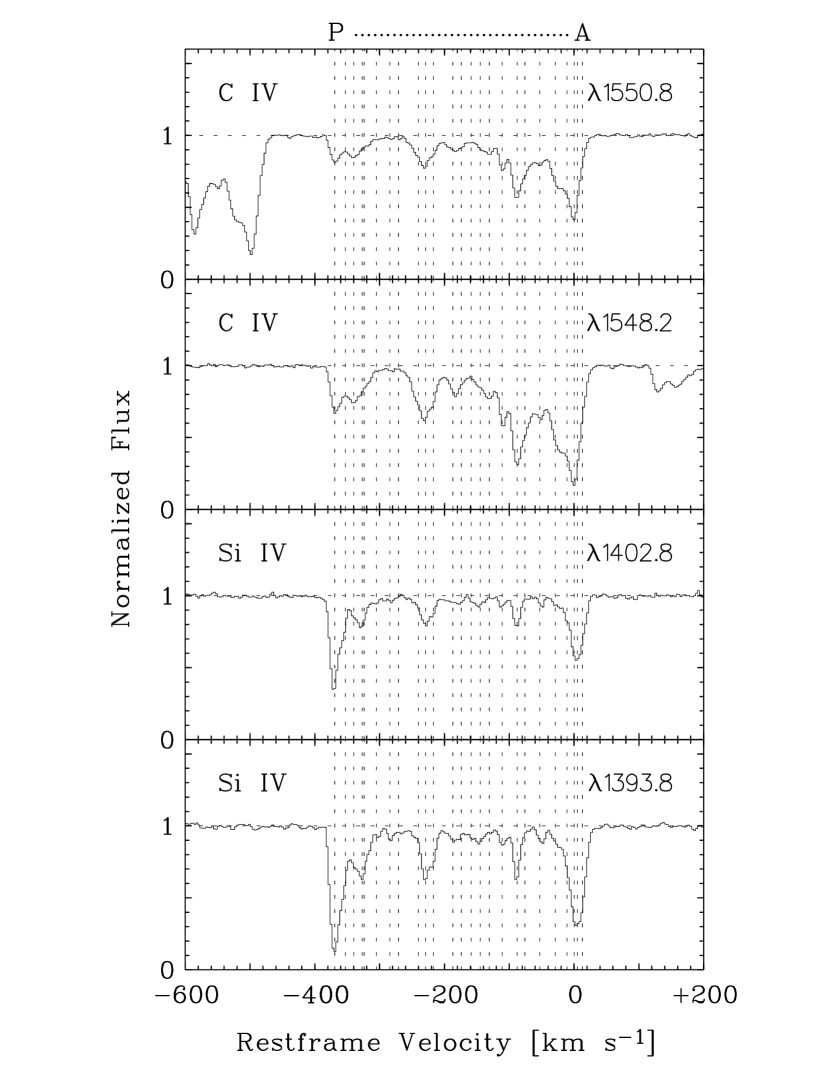
For the spectral analysis of the data we made use of the FITLYMAN package in MIDAS (Fontana & Ballester 1995). This routine uses a minimization algorithm to derive column densities, , and Doppler-parameters, , via Voigt-profile fitting, taking into account the spectral resolution of the instrument (see above). First of all, we have disentangled the component structure in the absorber for a) neutral and weakly ionized species (singly ionized species plus Al iii), and b) highly ionized species (C iv and Si iv), as explained in detail in Sects. 3 and 4. Using a number of high S/N absorption profiles from various species we then obtained Doppler parameters for each component by Voigt profile fitting. We use a single value per absorption component to fit all neutral and weakly ionized species except hydrogen and deuterium. Fig. 2, lower panel, shows an example for a Voigt profile fit to the Al ii line. The spectral data are plotted with black points, the corresponding fit is shown as solid line. Throughout this paper we use wavelengths and oscillator strengths from the atomic line list of Morton (2003).
3 Neutral and weakly ionized species
3.1 Velocity structure and values
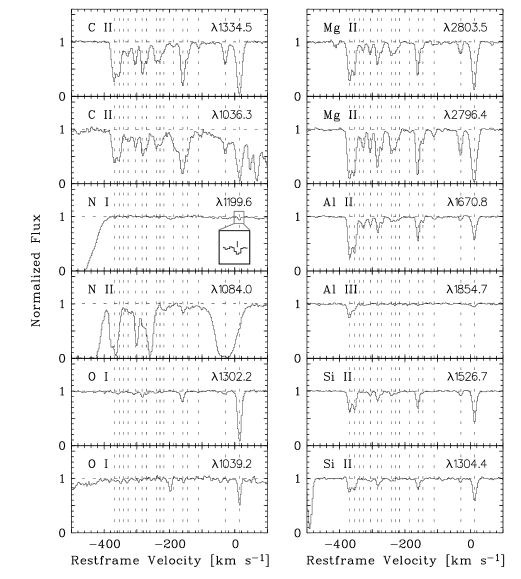
Fig. 2 (upper panel) shows the C ii line plotted on the restframe velocity scale, demonstrating the complex component structure of this absorption system. The C ii line, among others, is sufficiently strong to show also weak velocity components and lies in a region that is not affected by line blending. Moreover, this line has high S/N, so that the various subcomponents can be reliably identified. To derive a unique model for the velocity component structure we have fitted Voigt profiles to a number of high S/N lines of C ii, Mg ii, and Si ii. We identify velocity subcomponents, in Fig. 2 shown with vertical dashed lines. In the restframe these absorption components have relative velocities of , , , , , , , , , , , , , , , and km s-1. This velocity model then has been used to derive values and column densities for each component via Voigt-profile fitting. The resulting values for and log and their errors are listed in Table 1. Throughout the following, we label the individual velocity components with the letters A to P in alphabetical order (i.e, component A is the one at km s-1). The strongest absorption in C ii and other neutral and weakly ionized species is seen in component A, thus at the outermost red wing of the overall absorption structure.
3.2 Metals
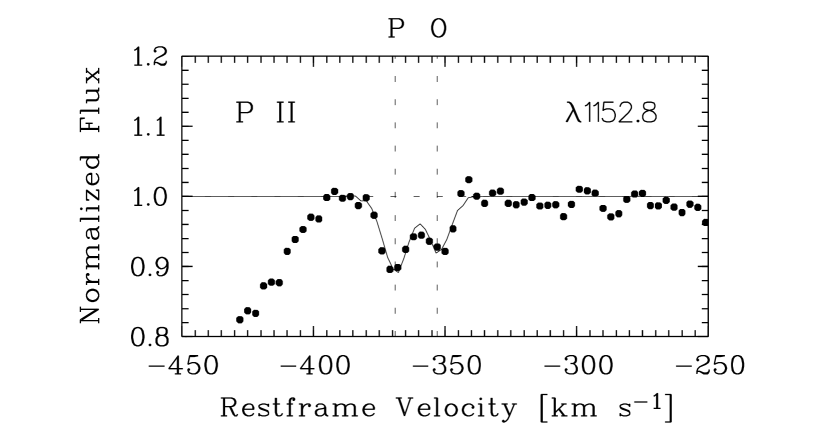
A number of neutral and weakly ionized species are detected in the various velocity components, including C ii, N i, N ii, O i, Mg ii, Al ii, Al iii, Si ii, P ii, and Fe ii. A selection of velocity profiles of these species are shown in Fig. 3. Column densities for these ions as well as upper limits for undetected species (e.g., Zn ii, S ii, and molecular hydrogen, H2) are listed in Table 1. The strong lines of C ii () and Mg ii () are saturated in the dominating neutral components A, E, K, O, and P. As there are no weaker transitions available for these species, the column densities derived for C ii and Mg ii in these components are relatively uncertain (see Table 1). For O i, N i, Al ii, Al iii, Si ii, and Fe ii unsaturated lines are available that allow us to derive accurate column densities from profile fitting. N i absorption is detected solely in component A. The measured equivalent width of the N i feature in the line (see Fig. 3, third panel in the left row) is only mÅ, corresponding to a significance at the measured local S/N of per resolution element. Remarkable is the detection of P ii in outermost blue components O and P, as shown in Fig. 4. This is surprising, since P ii has a relatively low cosmic abundance (log (P/H)) and is not observed in the strongest neutral component A.
| Comp. | Ion | log a | a | Comp. | Ion | log a | a | ||||
|---|---|---|---|---|---|---|---|---|---|---|---|
| [km s-1] | [km s-1] | [km s-1] | [km s-1] | ||||||||
| A | C ii | I | C ii | ||||||||
| N i | Mg ii | ||||||||||
| N ii | Al ii | ||||||||||
| O i | Si ii | ||||||||||
| Mg ii | Fe ii | ||||||||||
| Al ii | |||||||||||
| Al iii | J | C ii | |||||||||
| Si ii | Mg ii | ||||||||||
| P ii | Al ii | ||||||||||
| S ii | Si ii | ||||||||||
| Fe ii | Fe ii | ||||||||||
| Fe iii | |||||||||||
| Zn ii | K | C ii | |||||||||
| H2 | O i | ||||||||||
| Mg ii | |||||||||||
| B | C ii | Al ii | |||||||||
| O i | Al iii | ||||||||||
| Mg ii | Si ii | ||||||||||
| Al ii | Fe ii | ||||||||||
| Si ii | |||||||||||
| Fe ii | L | C ii | |||||||||
| O i | |||||||||||
| C | C ii | Mg ii | |||||||||
| Mg ii | Al ii | ||||||||||
| Al ii | Si ii | ||||||||||
| Si ii | Fe ii | ||||||||||
| D | C ii | M | C ii | ||||||||
| Mg ii | Mg ii | ||||||||||
| Al ii | Al ii | ||||||||||
| Si ii | Si ii | ||||||||||
| E | C ii | N | C ii | ||||||||
| N ii | Mg ii | ||||||||||
| O i | Al ii | ||||||||||
| Mg ii | Si ii | ||||||||||
| Al ii | |||||||||||
| Al iii | O | C ii | |||||||||
| Si ii | O i | ||||||||||
| Fe ii | Mg ii | ||||||||||
| Fe iii | Al ii | ||||||||||
| Al iii | |||||||||||
| F | C ii | Si ii | |||||||||
| Mg ii | P ii | ||||||||||
| Fe ii | |||||||||||
| G | C ii | Fe iii | |||||||||
| Mg ii | |||||||||||
| Al ii | P | C ii | |||||||||
| Si ii | O i | ||||||||||
| Mg ii | |||||||||||
| H | C ii | Al ii | |||||||||
| Mg ii | Al iii | ||||||||||
| Al ii | Si ii | ||||||||||
| Si ii | P ii | ||||||||||
| Fe ii | Fe ii | ||||||||||
| Fe iii |
a errors and upper limits are given.
3.3 Neutral hydrogen absorption
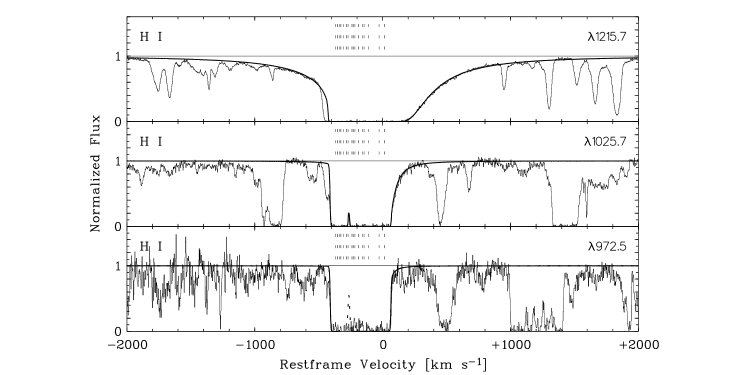
Neutral hydrogen absorption in the sub-DLA is seen in Ly , Ly , and Ly , as shown in Fig. 5. The other lines from the H i Lyman series either have very low S/N or are located bluewards of the available UVES wavelength range. As clearly visible in Figs. 1 and 5, the Ly absorption is very asymmetric due to the large number of neutral gas components at the blue side that contribute to the overall H i absorption. The red part of the Ly absorption shows a well-defined damping wing caused by the strongest neutral gas component at km s-1 (component A). Due to the asymmetry, a free single-component fit of the Ly , Ly , and Ly absorption cannot even roughly reproduce the observed shape of the absorption. Therefore, the complex velocity structure of the absorber has to be taken into account for the profile fit of the H i Lyman series absorption. Fixing the centroid of the fit at km s-1 and only fitting the damping wing on the red side of the Ly , Ly , and Ly absorption simultaneously results in an H i column density of log (H i for component A. Similarly, we can constrain the total H i column density in the two bluest velocity components O and P to log (H i by fixing the velocity centroid at km s-1 and fitting the blue wing of the Ly and Ly absorption. Note that the additional absorption occurring in the blue wing of the Ly , Ly , and Ly absorption is possibly due to deuterium (D i) in components O and P in combination with an additional weak H i component near km s-1. This will be further discussed in the Appendix.
The entire H i absorption in Ly , Ly , and Ly profile can be modeled by taking into account the absorption from the intermediate velocity components. For our model, we consider absorption from the strongest neutral gas components A, B, E, K, L, O, and P, for which we have fixed the velocity-component structure as seen in the metal-line absorption. Characteristic is the presence of a residual flux spike in the Ly profile near km s-1, which needs to be reproduced by our model. A similar spike is not seen in the Ly absorption profile, but it is likely that in this region the Ly line is blended with absorption from the Ly forest. The best fitting model has logarithmic H i column densities of , , , , , , and for the components A, B, E, K, L, O, & P, respectively. This model is shown Fig. 5 with a thick solid line; the expected flux spike near km s-1 in the Ly absorption is indicated with a thick dashed line. Note that this fit for the intermediate velocity components is not unique, as other combinations of H i column densities also can reproduce the shape of the observed H i absorption. An important outcome of this model is, however, that the absorption of the intermediate components does not significantly influence the shape of the H i absorption in blue and red wing of the Lyman lines. Therefore, the values of log (H i and log (H i derived above represent reliable estimates for the H i column densities in components A and OP.
| Species | I.P. | log (X/H)☉ a | [X/H]b |
|---|---|---|---|
| [eV] | (+12) | ||
| C ii | 24.38 | 8.52 | |
| N i | 14.53 | 7.95 | |
| N ii | 29.60 | 7.95 | |
| O i | 13.62 | 8.69 | |
| Mg ii | 15.04 | 7.58 | |
| Al ii | 18.83 | 6.49 | |
| Al iii | 28.45 | 6.49 | |
| Si ii | 16.35 | 7.56 | |
| P ii | 19.77 | 5.56 | |
| S ii | 23.34 | 7.20 | |
| Fe ii | 16.19 | 7.50 | |
| Fe iii | 30.65 | 7.50 | |
| Zn ii | 17.96 | 4.67 |
a Reference abundances are taken from Allende Prieto et al. (2001) for oxygen and from
the compilation of Morton (2003) and references therein.
b [X/H]log (X/H)log (X/H)☉.
3.4 Abundances and abundance ratios
3.4.1 Component A
First, we concentrate on the dominating neutral component (component A) in our discussion of abundances and abundance ratios in the absorber. The best element to derive the overall abundance in the gas is oxygen, since neutral oxygen and neutral hydrogen have very similar ionization potentials and both elements are coupled by a strong charge-exchange reaction. Moreover, oxygen does not deplete significantly into dust grains. Our analysis yields [O/H 111[X/H]log (X/H)log (X/H)☉, which corresponds to an abundance of solar. In striking contrast, the nitrogen abundance is significantly lower, [N/H or solar, as derived from N i. The resulting nitrogen-to-oxygen ratio [N/O, if accurate, would be one of the lowest ever measured in DLAs so far. However, the interpretation of N i/H i is not as straightforward as for O i/H i. Although the ionization potential of N i is only slightly higher than that of hydrogen ( versus eV), ionization effects can significantly affect the determination of [N/H] from N i and H i in absorbers with overall column densities cm-2. The reason for this is that charge exchange reactions are less efficient between N i and H i (in contrast to O i and H i; see Butler & Dalgarno 1979) and N i has a relatively large photoionization cross section (Sofia & Jenkins 1998). Thus, a considerable fraction of the nitrogen in component A may reside in the N+ phase, particularly if a substantial ionizing radiation field is present. While the uncertain column density constraint from the blended N ii line (log (N ii) does not provide a very stringent estimate of the abundance of singly ionized nitrogen, we can check upon possible ionization effects in component A using other weakly ionized species. The ratio of (Al iii/A ii suggests that ionization could be important. This ratio, however, is difficult to interpret due to the uncertain recombination rate of Al+ (see Vladilo et al. 2001; Nussbaumer & Storey 1986) and the observed discrepancies between (Al iii/A ii) and other ionic ratios in high-z photo-ionization models (e.g., D’Odorico & Petitjean 2001). An important element to investigate ionization conditions in interstellar and intergalactic gas is the element sulfur (Richter et al. 2001). S ii has an ionization potential of eV and depletes only very little into dust, so that we expect most S to be in form of S ii. Since the ionization potential of S ii is significantly higher than that of O i and H i ( eV for both), S ii lives in gas where part of the hydrogen is ionized. From the observed S ii/O i ratio we thus can learn about the hydrogen ionization fraction (see Richter et al. 2001 for details). Although S ii is not detected in our sub-DLA, the upper limit for the S ii column density in component A (log (S ii) yields [S/H] and [S ii/O i]. If one assumes a solar sulfur-to-oxygen ratio, the possible small excess of S ii compared to O i implies that the degree of ionization in component A is low ( percent). 222Note that if the intrinsic S/O ratio in this system is significantly lower than solar, the ionization fraction would be underestimated by this method. Some DLAs indeed show sub-solar S/O ratios (e.g., Prochaska, Howk, & Wolfe (2003)). We conclude that N ii/N i most likely is small, so that we can give a conservative limit for the nitrogen abundance in component A of [N/H] and [N/O].
The apparently low degree of ionization in combination with the equal abundances of Si and O speaks against any significant dust depletion of silicon in component A. The situation is somewhat less clear for the elements Mg, Al, and Fe, which are all underabundant compared to oxygen ([Mg/O], [Al/O], and [Fe/O]). These elements could be depleted into dust grains. In fact, with [Fe/O] and [Si/O] the absorber follows the trend for dust depletion patterns found in damped Ly systems and in the Galactic halo (see Petitjean, Srianand, & Ledoux 2002, their Fig. 7). However, next to dust depletion nucleosynthesis effects certainly have to be considered for these elements given the low overall abundance and the very low nitrogen content. In this context, the observed abundances of iron and aluminum could also be explained by a slightly enhanced [/Fe] element ratio and a mild odd-even effect for Al. In contrast to Fe and Al, the column density of magnesium unfortunately is too uncertain (due to saturation of the two available Mg ii lines) to draw meaningful conclusions about the apparent Mg underabundance. The absence of molecular hydrogen absorption in component A represents yet another piece of information on the dust abundance in the gas. From the H2 column density limit (see Table 1) we obtain an upper limit for the molecular hydrogen fraction of H(H iH. As H2 preferentially forms on the surfaces of dust grains, the lack of H2 further supports the above conclusion that the dust abundance in component A must be small (see also Ledoux, Petitjean, & Srianand 2003). Little can be said about the carbon abundance in component A, as the value of [C/H - although similar to that of oxygen - is very uncertain due to saturation of the two C ii lines. If the value would be only slightly higher than the assumed km s-1, the C ii column density (and thus the derived carbon abundance) would drop substantially.
All measured abundances in component A are summarized in Table 2.
3.4.2 Components O and P
We now turn to components O and P, which show a very distinct abundance pattern. As discussed in Sect. 3.3, the Ly Voigt profile fit yields log (H i for components O and P together. The combined O i column density for O and P is log (see Table 1), from which we infer an oxygen abundance of [O/H]. This is consistent with the oxygen abundance derived for component A. The large value for log (C ii/O i) in component O implies that the degree of ionization must be large. Note that the C ii absorption in components O and P is not saturated (unlike in component A), so that the derived C ii column densities are accurate (see Table 1). From C ii, Mg ii, Si ii, Al ii, and P ii we obtain (Mg ii/C ii, (Si ii/C ii, (Al ii/C ii, and (P ii/C ii. From Fe ii and Fe iii we derive ((Fe iiFe iii)/C ii. These ratios suggest significant overabundances of silicon, aluminum, and phosphorus in components O and P. However, a confirmation of this statement and a more quantitative estimate of the apparent overabundances has to await a detailed photoionization modeling for these species. This will be presented in Sect. 4.2.
4 Highly-ionized species
4.1 Component structure and column densities
Absorption by highly ionized gas in the absorber is seen in C iv and Si iv . O vi and N v are not detected, but blending problems hamper a reliable detection of these ions. The component structure seen in C iv and Si iv (Fig. 6) is even more complex than that of the neutral and weakly ionized gas. All in all, we identify 25 absorption components including the 16 components detected in neutral and weakly ionized species. All C iv and Si iv measurements are summarized in Table 3.
| Comp. | Ion | log a | a | ||
|---|---|---|---|---|---|
| [km s-1] | [km s-1] | ||||
| A | C iv | ||||
| Si iv | |||||
| A1 | Si iv | ||||
| A2 | C iv | ||||
| A3 | Si iv | ||||
| B | C iv | ||||
| B1 | C iv | ||||
| Si iv | |||||
| B2 | C iv | ||||
| B3 | C iv | ||||
| Si iv | |||||
| C | C iv | ||||
| Si iv | |||||
| C1 | C iv | ||||
| D | C iv | ||||
| Si iv | |||||
| E | Si iv | ||||
| E1 | C iv | ||||
| F | C iv | ||||
| Si iv | |||||
| G | C iv | ||||
| Si iv | |||||
| H | C iv | ||||
| Si iv | |||||
| I | C iv | ||||
| Si iv | |||||
| J | Si iv | ||||
| K | Si iv | ||||
| L | Si iv | ||||
| L1 | Si iv | ||||
| M | C iv | ||||
| Si iv | |||||
| N | C iv | ||||
| Si iv | |||||
| O | C iv | ||||
| Si iv | |||||
| P | C iv | ||||
| Si iv |
a errors and upper limits are given.
4.2 Photoionization modeling for comp. O and P
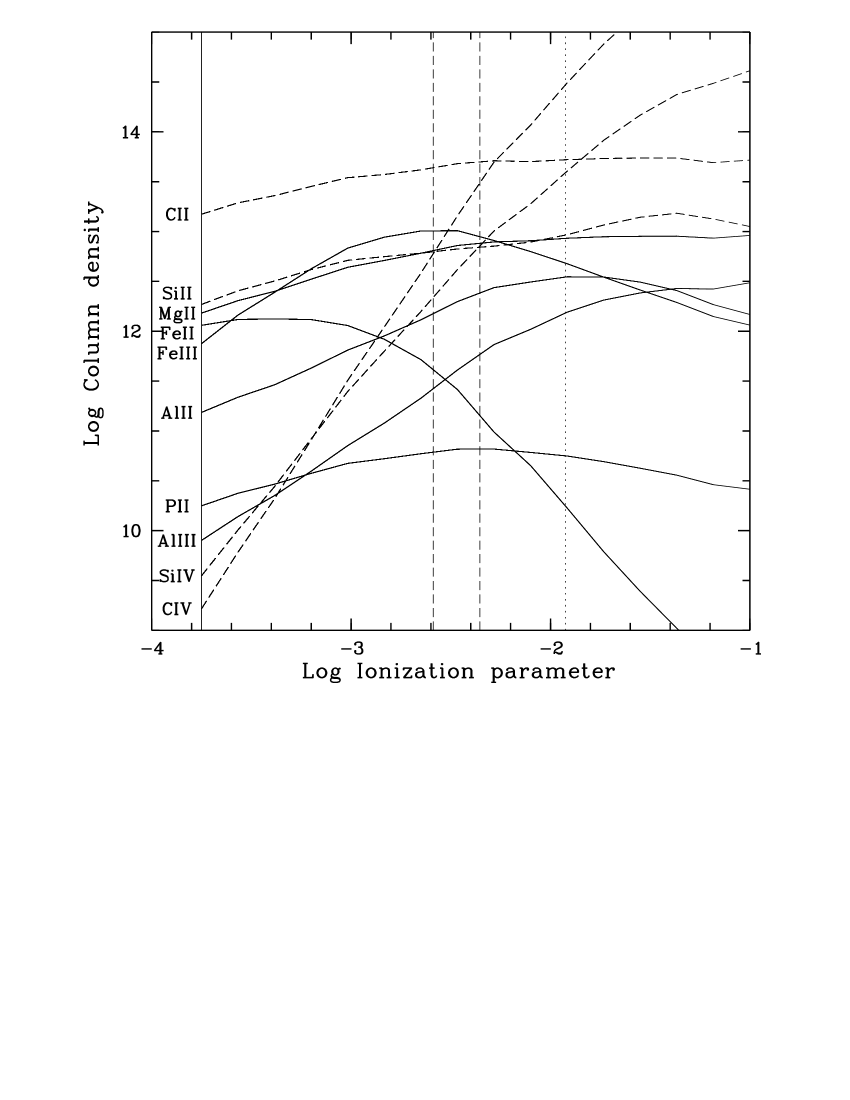
Our measurements of C ii, C iv, Si ii, and Si iv allow us to model the photoionization in components O and P and to constrain the ionization parameter , the ratio of ionizing photon density to gas density. We have used the photoionization code CLOUDY v94.00 (Ferland 1996) and have modeled a plane-parallel slab of gas with a metallicity of 0.01 solar and solar relative chemical abundances (Fig. 7). The calculations were done using a constant density and were stopped whenever the neutral hydrogen column density reached cm-2. The total hydrogen column density in the model, (H i+H ii), comes out to cm-2. For the ionizing radiation, we used the Madau, Haardt & Rees (1999) metagalactic spectrum at . Our CLOUDY modeling for the column density ratios of C iv/C ii and Si iv/Si ii implies ionization parameters of log and , respectively, thus in good agreement with each other (see Fig. 7, vertical dashed lines). A value of log further is consistent with the observed column densities/column density limits for Fe ii and Fe iii. From the Al iii/Al ii ratio we obtain a significantly higher value of log (Fig. 7, vertical dotted line). This high value most likely is a result of the poorly known dielectric recombination rate of Al+ at high temperatures (Petitjean, Rauch, & Carswell 1994; Nussbaumer & Storey 1986) and therefore will not be considered here any further. Comparing the column densities predicted by the CLOUDY model with those measured allows us to constrain the metal abundances in components O and P. The results are summarized in Table 4. For oxygen, carbon, magnesium, and iron we obtain abundances that are consistent with those measured in component A. For aluminum, silicon, and in particular for phosphorus, the CLOUDY model results in relative abundances that are significantly enhanced compared to solar. The overabundances relative to carbon amount to dex for aluminum, dex for silicon, and dex for phosphorus (see Table 4).
| Species | log (X/H)☉ a | [X/H] b | [X/C] b |
|---|---|---|---|
| (+12) | |||
| C | 8.52 | … | |
| O | 8.69 | ||
| Mg | 7.58 | ||
| Al | 6.49 | ||
| Si | 7.56 | ||
| P | 5.56 | ||
| Fe | 7.50 |
a Reference abundances are taken from Allende Prieto et al. (2001) for oxygen and from
the compilation of Morton (2003) and references therein.
b Based on the CLOUDY photoionization model
described in Sect. 4.2.
5 Discussion
Our measurements of the sub-DLA at towards HE 00012340 unveil a number of interesting abundance properties in this absorption system. With [O/H], [N/H], and [N/O] the sub-DLA towards HE 00012340 exhibits a classic massive star abundance pattern with little sign of primary nitrogen (e.g., Umeda & Nomoto 2004). While the alpha-element abundances [O/H] and [Si/H] are comparable to those measured for other sub-DLAs and DLAs at similar redshifts (e.g., Dessauges-Zavadsky et al. 2002; Pettini et al. 2002), the [N/] ([N/O]) ratio is among the lowest ever measured in DLAs and other astrophysical sites. [N/] is a particularly important parameter to trace the chemical evolution in the early Universe. Nitrogen is believed to be produced mainly in intermediate-mass stars. The nitrogen deficiency observed in the intergalactic medium and in blue compact dwarf (BCD) galaxies (e.g., Prochaska et al. 2002; Izotov & Thuan 1999) probably is a result from the early chemical enrichment of Type II supernovae from massive stars that produce only very little primary nitrogen. In low-metallicity environments with [/H, a first [N/] plateau possibly is present near dex, whereas for more metal-rich systems a second plateau occurs near dex (Centuri\a’on et al. 2003). The region around [N/ is much more populated than the region near dex, showing that most of observed environments must have experienced a second epoch of nitrogen and -element enrichment after the initial enrichment to the [N/ level. In contrast to the dex plateau, that near dex exhibits only small scatter ( dex) in (N/O). To our knowledge, no systems with [N/O] ratios have been found so far. This may suggest that the value of [N/O] represents the ground floor for (N/O) in the Universe, set by the coeval injection of primary nitrogen and oxygen from the first generation of (massive) stars. The results presented here support this scenario. However, the number of systems with very low (N/O) values is still very limited and thus the existence of the dex plateau still has to be confirmed by additional measurements (Centuri\a’on et al. 2003; Israelian et al. 2004).
Another interesting result of our study is the abnormal abundance pattern seen in components O and P. The ion column densities in these components derived in Sect. 3.4.2 and the CLOUDY model presented in Sect. 4.2 imply significant overabundances of aluminum ( dex), silicon ( dex), and phosphorus ( dex) compared to carbon. Such an abundance pattern is highly unusual for DLAs. The findings may indicate that the line of sight towards HE passes through a confined gaseous region in the DLA host that is locally polluted with heavy elements by nearby supernova explosions. Since the ejecta of a single supernova do not contain enough material to significantly enhance the heavy metal abundance in larger volumes of interstellar gas, it seems plausible that the chemically enriched gas components O and P is related to massive (coeval) star-formation activity, such as in massive star clusters. Recent models for the so-called “hypernovae” (supernovae that have explosion energies erg) predict significantly enhanced [Si/C] abundances in the supervova ejecta as a result of carbon and oxygen burning in low-density regions that lead to an enhanced freeze-out of elements (e.g., Nakamura et al. 2001). Yet, these models cannot explain overabundances of phosphorus and aluminum and thus the exact explosion mechanism that may lead to the observed abundance pattern in components O and P remains unknown.
A striking feature of the absorber towards HE 00012340 is the large number of individual velocity components that span a very large velocity range of almost km s-1. This velocity span seems very large for a single (proto)galactic structure. One possible explanation for this is that the absorption pattern reflects a merger event of two galaxies or protogalactic structures. The individual velocity components that are quite narrow but that do not contain large columns of gas then may arise in tidal gaseous features produced by the merger event, spread out over a large spatial and radial-velocity range. An interesting aspect of a merger scenario lies in the idea that the merger actually triggers the formation of the stellar clusters (e.g., a nuclear cluster) that give rise to the abundance anomalies in components O and P. It is well known that merger/accretion events are of prime importance for starburst activity and the formation of massive stellar clusters in and around galaxies (e.g., Knierman et al. 2003; Schweizer & Seitzer 1998). If the absorber towards HE 00012340 currently undergoes a merger event that leads to the formation of massive stellar clusters, these clusters should locally enrich their interstellar environment with heavy elements by supernova explosions. Such circum-cluster environments, when they are young, should not have had enough time to mix with the more extended interstellar environment of the host galaxy. This possibly creates distinct regions with enhanced heavy-element abundances similar to what is observed in components O and P. The sub-DLA towards HE 00012340 thus may represent a young galaxy at that currently forms due to merging.
6 Summary
We have performed a detailed analysis of the sub-DLA at
towards HE 00012340 and have derived the following results:
(1) We identify 16 absorption subcomponents in neutral and weakly ionized
species (H i, D i, C ii, N i, N ii, O i,
Mg ii, Al ii, Al iii, Si ii, P ii, and Fe ii),
and 25 subcomponents in C iv and Si iv.
These components span a velocity range of km s-1 in
the restframe. The system has a
total neutral hydrogen column density of log (H i.
(2) The overall abundance of the absorber is [M/H] dex
(1/65 solar), as derived from unsaturated O i absorption in the strongest
neutral gas component A at km s-1
(relative to ). The lack of depletion of Si ii and the
absence of molecular hydrogen imply that the absorber is devoid of dust.
(3) The gas in component A shows a classic massive star abundance
pattern with little sign of primary nitrogen. Taking
possible ionization effects into account, we estimate
[N/H] and [N/O]. These
values place the absorber among systems
with the lowest measured [N/] ratios in
astrophysical sites so far. This result is in line
with the idea that the first stars in the Universe
have enriched the intergalactic medium to a level
of [N/.
(4) Components O and P near km s-1
exhibit significant overabundances
of phosphorus, silicon, and aluminum
([P/C], [Si/C], and [Al/C])
after applying an ionization correction.
Possibly, the gas belonging to these components
is locally enriched by the supernova ejecta from
one or more massive stellar clusters. Absorption
by D i is possibly detected in components O and P
in the blue wings of the H i Ly , Ly and
Ly lines. However, our analysis of these lines
leads to an extraordinarily high D/H
ratio of , implying that
the D i absorption is blended with an H i interloper.
(5) We suggest that the large number of absorption
components spread over several hundred km s-1
indicates the merging of two galaxies or protogalactic
structures. This merging eventually triggers
the formation of star clusters that are responsible
for the abundance anomalies observed in
components O and P.
If so, the sub-DLA towards HE 00012340 may
represent a young galaxy at that
currently forms out of a merger event.
Acknowledgements.
This work is based on observations collected during program 166.A-0106 (PI: Jacqueline Bergeron) of the European Southern Observatory with the Ultraviolet and Visible Echelle Spectrograph mounted on the 8.2 m KUEYEN telescope operated at the Paranal Observatory, Chile. We are grateful to the astronomers that have performed the observations in service mode. P.R. is supported by the German Deutsche Forschungsgemeinschaft, DFG, through Emmy-Noether grant Ri 1124/3-1.References
- (1) Allende Prieto, C., Lambert, D.L., & Asplund, M. 2001, ApJ, 556, L63
- (2) Burles, S., Nollet, K.M., & Turner, M.S. 2001, ApJ, 552, L1
- (3) Centuri\a’on, M., Molaro, P., Vladilo, G., P\a’eroux, C., Levshakov, S.A., & D’Odorico, V. 2003, A&A, 403, 55
- (4) Dessauges-Zavadsky, M., P\a’eroux, C., Kim, T.-S., D’Odorico, S., & McMahon, R. G. 2003, MNRAS, 345, 447
- (5) D’Odorico, V., & Petitjean, P. 2001, A&A, 370, 729
- (6) Ferland, G. 1996, Hazy, a Brief Introduction to CLOUDY 90, Univ. Kentucky Phys. Dept. Int. Rep.
- (7) Fontana, A., & Ballester, P. 1995, ESO Messenger, 80, 37
- (8) Israelian, G., Ecuvillon, A., Rebolo, R., Garc\a’ia-L\a’opez, R., Bonifacio, P., & Molaro, P. 2004, A&A, 421, 649
- (9) Izotov, Y.I., & Thuan, T.X. 1999, ApJ, 511, 639
- (10) Jedamizik, K. 2002, P&SS, 50, 1239
- (11) Jos\a’e, J., Coc, A., & Hernanz, M. 2003, ApJ, 560, 897
- (12) Knierman, K.A., et al. 2003, AJ, 126, 1277
- (13) Lanzetta, K.M., Wolfe, A.M., & Turnshek, D.A. 1995, ApJ, 440, 435
- (14) Ledoux, C., Petitjean, P., & Srianand, R. 2003, MNRAS, 346, 209
- (15) Lu, L., Sargent, W.L.W., Barlow, T.A., Churchill, C.W., & Vogt, S.S. 1996, ApJS 107, 475
- (16) Madau, P., Haardt, F., & Rees, M.J., 1999, ApJ, 514, 648
- (17) Morton, D.C. 2003, ApJS, 149, 205
- (18) Nakamura, T., Umeda, H., Iwamoto, K., Nomoto, K., Hashimoto, M., Hix., W.R., & Thielemann, F.-K. 2001, ApJ, 555, 880
- (19) Nussbaumer, H., & Storey, P.J. 1986, A&AS, 64, 545
- (20) P\a’eroux, C., Dessauges-Zavadsky, M., D’Odorico, S., Kim, T.-S., & McMahon, R. G. 2003, MNRAS, 345, 480
- (21) Petitjean, P., Rauch, M., & Carswell, R.F. 1994, A&A, 291, 29
- (22) Petitjean, P., Srianand, R., & Ledoux, C. 2002, MNRAS, 332, 383
- (23) Pettini, M., Ellison, S., Bergeron, J., & Petitjean, P. 2002, A&A, 391, 21
- (24) Prochaska, J.X., et al. 2002, PASP, 114, 933
- (25) Prochaska, J.X., Howk, J.C., & Wolfe, A.M. 2003, Nature, 423, 57
- (26) Prochaska, J.X., & Wolfe, A.M. 1999, ApJS, 121, 369
- (27) Richter, P., et al. 2001, ApJ, 559, 318
- (28) Schweizer, F., & Seitzer, P. 1998, AJ, 116, 2206
- (29) Shields, G.A. 1996, ApJ, 461, L9
- (30) Smith, G.H., & Kraft, R.P. 1996, PASP 108, 344
- (31) Sofia, U.J., & Jenkins, E.B. 1998, ApJ, 499, 951
- (32) Umeda, H., & Nomoto, K. 2004, Nature, 422, 871
- (33) Vladilo, G., Centuri\a’on, M., Bonifacio, P., Howk, J.C 2001, ApJ 543, 24
- (34) Wolfe, A.M., Lanzetta, K.M., Foltz, C.B., & Chaffee, F.H. 1995, ApJ, 454, 698
Appendix A Comments on Deuterium
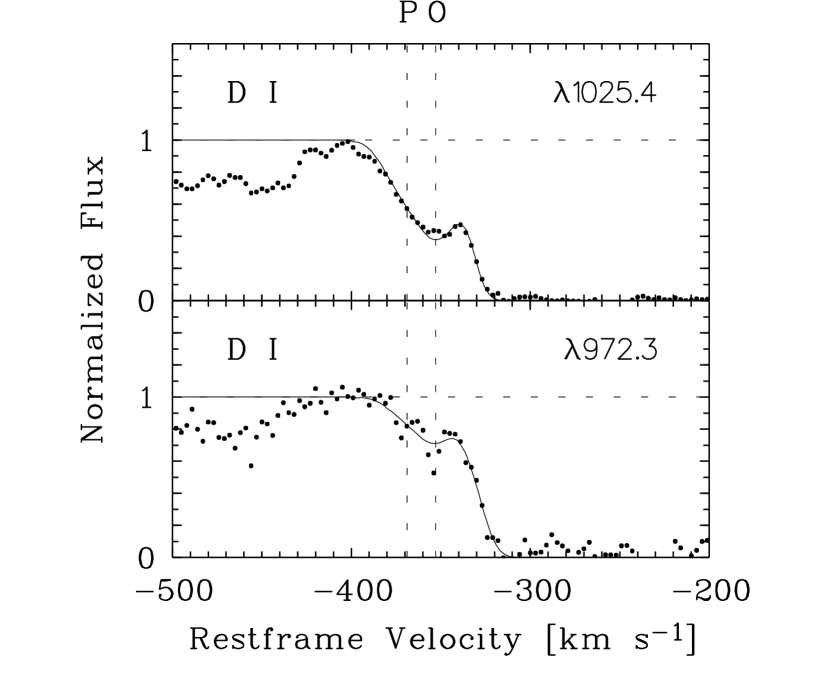
The H i profile fit described in Sect. 3.3 (Fig. 5) suggests the presence of additional absorption in the blue wing of the Ly , Ly , and Ly profiles - exactly at the position where D i absorption from the two bluer-most components O and P is expected. A Voigt-profile fit to the possible D i Ly and Ly absorption (shown in Fig. A.1) provides log (D i and log (D i together with (D i and (D i. The values for log (D i) do not change significantly if one assumes lower values. With (H i) (see Sect. 3.3), we derive a limit for the deuterium-to-hydrogen ratio of (D/H). This is times higher than the canonical value for chemically young gas (; e.g., Burles et al. 2001). The simplest and most likely explanation for this unusually high (D/H) ratio is to assume that the deuterium lines in components O and P are blended with an ‘hydrogen interloper’, a weak H i absorber that would be located near km s-1 (in the restframe) and that coincidentally falls together with the D i absorption in components O and P. However, as recently reviewed by Jedamzik (2002), there are a number of possible production mechanisms at high that may locally enhance the (D/H) ratio in certain environments, e.g., in regions predominantly enriched by supermassive stars. It is an intriguing coincidence that the apparently enhanced (D/H) ratio in the absorber toward HE 00012340 is observed in gas that exhibits abundance anomalies also in other elements (P, Si, and Al; see Sect. 4.2). We therefore have to acknowledge that the existence of an intrinsically enhanced (D/H) ratio in components O and P cannot be entirely excluded, although the presence of an hydrogen interloper certainly remains the most likely explanation for the apparent (D/H) anomaly.