xxx – xxx
The near-IR luminosity-metallicity relation of dwarf irregular galaxies
Abstract
We report on the recent developments of our long-term investigation of the near-IR luminosity-metallicity relation for dwarf irregular galaxies in nearby groups. A very well-defined relation is emerging from our observational database, and a preliminary discussion of its implications is given.
keywords:
ISM: abundances, (ISM:) HII regions, galaxies: abundances, galaxies: dwarf, galaxies: evolution, galaxies: fundamental parameters, galaxies: ISM, galaxies: irregular, infrared: galaxies1 Introduction
Since a few years, we are carrying out a program to collect near-IR imaging of dwarf irregular (dIrr) galaxies in galaxy groups, and optical spectra of their Hii regions, to test the existence of a luminosity-metallicity (L-Z) relation. The main purpose of the study is to provide a sound starting point to discuss how the relation is created, which gives insight into the interplay between processes like mass loss on galactic scales, and galactic chemical evolution. In turn, this has implications on the identification of the sources of metals in the intergalactic medium (IGM), and on the cosmic chemical evolution. The existence of a L-Z relation is in fact usually explained, at least in the case of spheroids, as the result of mass loss through galactic winds triggered by SN explosions (Larson [1974]). Notwithstanding its importance, the existence of a L-Z relation for dIrr is controversial, with some studies finding very well defined correlations (Skillman et al. [1989]; Richer & McCall [1995]; Pilyugin [2001]), some finding mild relations with substantial scatter (Skillman et al. [2003b]), and some finding no correlation at all (Hidalgo-Gámez & Olofsson [1998]; Hunter & Hoffman [1999]). So we decided to improve the situation by devising an observational campaign to overcome some of the existing limitations. The idea is (a) to put together homogeneous samples of oxygen abundances; to consider only galaxies in (b) well-defined environments, and (c) with reduced distance ranges; and finally (d) to image galaxies in the near-IR. The campaign started as a pilot program at 4-m class telescopes, so it had been restricted to the three nearest groups of galaxies, namely M81, Centaurus A, and Sculptor, whose barycenters lie at similar distances () from the Sun. They also let us probe diverse environments, since members of the Cen A and M81 groups show more interactions than those of the Scl group. A progress report based on data for the Sculptor group has been presented in Saviane et al. ([2004]). More recently we have been able to obtain and reduce data for a few galaxies in the northern M81 group, so here we present an update of the project including data for three more galaxies.
2 The data sets
 |
 |
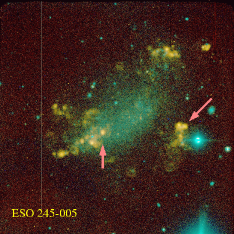 |
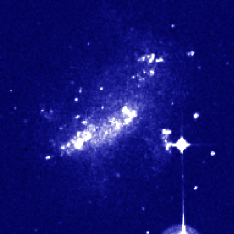
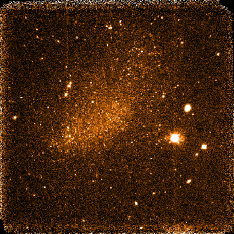
Nine galaxies of the Sculptor group have been observed so far, mostly in the year 2002; ESO 245-005 was re-observed in October 2003, to get a spectrum of a region closer to the optical center of the galaxy (see Fig. 1). All data have been obtained at the La Silla observatory using SOFI at the ESO/NTT and EFOSC at the ESO/3.6m. Typical exposure times were of 1h for spectroscopy and 1 hr on target + 1 hr on sky for the near-IR imaging in the band. For the M81 group, ten galaxies have been observed in the course of the years 2001 to 2003: interestingly, while only one galaxy of the Scl group did not show H emission, in this case of them did not show any emission. For this northern group, the KAST spectrograph at the Lick/3m telescope, and the INGRID camera at the ING/WHT telescope in La Palma were used, with exposure times comparable to those listed above. If the suppressed SF activity (compared to the Scl group) is confirmed, it will be telling us something about the effect of an environment that is more ’risky’ for dwarf galaxies. The reductions and calibrations of the data are thoroughly described in Saviane et al. (2005, in preparation), and it is worth mentioning that, for the galaxies in common, our abundances are consistent with those of Skillman et al. ([2003b]; see also Saviane et al. [2004]).
3 The near-IR luminosity-metallicity relation
To construct our near-IR luminosity-metallicity relation, ideally one would like to include only those galaxies for which abundances based on the direct method could be obtained. This would mean only two galaxies for the M81 group, thus, to improve the situation, we measured oxygen abundances also using the indirect method proposed by Pilyugin ([2000], P00), which allows to include all three galaxies for which reliable spectra could be obtained.
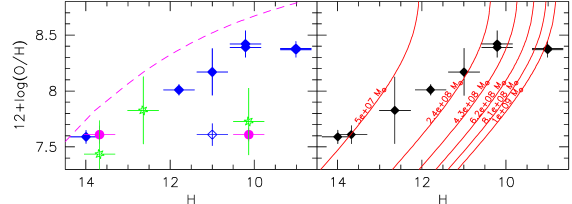
Oxygen abundances vs. apparent magnitudes are presented in Fig. 2: the left panel shows the whole data set, while the right panel shows a fiducial subsample. Since the galaxies are at a similar average distance, we do not need to correct for distance modulus: in any case the horizontal error bars show the variation in luminosity due to a Mpc distance uncertainty at Mpc. The external region of ESO 245-005 (at ) is under-abundant by dex compared to the central one. The region we measured in DDO 42 (near ) is also external, but we cannot make a comparison with a central one. Finally, metallicities estimated with the P00 method differ by at most dex from those measured using the direct method, in agreement with the findings of Skillman et al. ([2003b]). In the right panel of the figure we plot only the central Hii regions, including the one having the abundance estimated with the P00 method, to which we assign a error bar. With this selection, a clear relation emerges, in the usual sense of having higher oxygen abundances for more massive galaxies. Our strategy has allowed to construct a relation that is much better defined than the existing ones. It also seems like the dependence on luminosity ’saturates’ when the brightest galaxy in our sample is reached (NGC 625): excluding this galaxy, a linear regression has a correlation coefficient , and a slope of dex/mag.
The interpretation of the relation is not straightforward, though. As it was recalled in the Introduction, in the case of dE/dSph galaxies the L-Z relation is explained in the scenario of mass-loss through galactic winds. However, dIrrs are still evolving systems, so if we want to maintain the mass-loss scenario, then we have to assume that it leaves behind a L-Z relation very early in the history of galaxies. Recently Skillman et al. ([2003b]) and Pilyugin et al. ([2004]) have found that the chemical evolution of dIrrs can be approximated by a closed-box, provided that a low effective yield ( of the standard) is adopted: this is a typical signature of gas exchange with the environment. Pushing this hypothesis further, we plot such closed-box models111More appropriately, one should perhaps call these models “open-boxes simulating low-yield closed-boxes” in the right panel of Fig. 2, for total masses varying between and . We adopted the proposed low yield , and we assumed , and for both groups. The gas mass fraction decreases monotonically along each track as abundance increases, so if one assumes that all galaxies were born at the same time, then the figure is telling us that more massive galaxies evolve faster along their tracks. This is confirmed by plotting vs. total mass from data published in Skillman et al. ([2003a]): one can see a general trend of increasing with total mass, i.e. larger galaxies being more effective in converting their gas into stars. A similar conclusion was reached by Pilyugin & Ferrini ([2000]), who found that the L-Z relation is a combined effect of smaller gas loss and higher astration level as the mass increases. More detailed modeling is needed to clarify the role of other processes such like infall (e.g. Hidalgo-Gámez et al. [2003]).
It is also interesting to note that, although the closed-box predicts arbitrarily large values of as goes to zero (; Searle & Sargent [1972]), if we assume that the mass of each new generation of stars, which we can call , is roughly constant, then the maximum metallicity we can measure will be . This dependence on the mass of the galaxy is shown by the dashed curve in Fig. 2, where we assumed , a mass of stars that can be created in for a typical SFR .
4 A dwarf vs. giant galaxy dichotomy?

The only study of the L-Z relation of giant galaxies that includes near-IR magnitudes is that of Salzer et al. ([2005]; hereafter S05). They took spectra of emission-line galaxies in fixed apertures of 1.5′′ or 2′′, and computed oxygen abundances with a reduced number of emission lines, due to the limited spectral coverage of their data: using additional spectra, they first obtained metallicities for a subsample of galaxies using both the direct and the methods, and then calibrated them vs. [N II]6583/H and [O III]5007/H. For the method they used the P00 calibration for the lower branch of the vs. relation, and three calibrations for the upper branch: Edmunds & Pagel ([1984]; EP), Kennicutt, Bresolin, & Garnett ([2003]; KBG), and Tremonti et al. ([2004]). Assuming again an average distance modulus , in Fig. 3 we plot our data together with Salzer’s et al. data. The figure shows that the scatter in the L-Z relation for giants is very large, compared to that of dwarfs, perhaps due to fixed-aperture effects and uncertainties intrinsic to the empirical methods (see also the discussion in S05). The straight lines in the left panel are the fits obtained by S05 and by us, and taken at face value, the panel would suggest a well-defined offset between the L-Z relation of giants and dwarfs. The slope of the S05 L-Z relation is in fact close to what we find for dwarfs alone, namely and for abundances obtained with the EP and KBG calibrations, respectively. Now to be consistent with S05, in the right panel we plot our abundances computed with the P00 method (which allows to add AM 106-382). The offset between galaxies in the two mass ranges seems to disappear: it is in fact possible to do a linear fit of the whole sample (solid line), although a change of slope at would seem a better choice. The question of a dwarf-giant dichotomy is then open: moving from the empirical to the direct abundances, the L-Z relation for dwarfs becomes much better defined, parallel to the one for larger galaxies, and with a substantial offset. It remains to be seen what would happen to the L-Z relation of giant galaxies: we plan to measure direct abundances for some of the S05 galaxies, to see if the offset is confirmed or not. If the scenario of the top panel were confirmed, then we should conclude that dwarf galaxies are able to make more metals than giants, which at first sight is puzzling. A possible explanation is the following: if we assumed that the fundamental relation is that of dIrr galaxies, then we could say that the amount of metals produced by a giant galaxy is the same as that produced by a dwarf galaxy ca. times less luminous ( mag). In other words, only of the disk of a giant galaxy would participate in making its metals, or perhaps only if we considered that the yield in giant galaxies could be some 3 times higher than in dwarfs. Metaphorically, one could think that metals in the central regions of star-forming galaxies are made in universal cells, and that large cells make metals faster than small cells. And while small cells are found in isolation (dwarf galaxies), larger cells are found in groups of – in the centers of giant galaxies. This argument is certainly appealing, but it needs confirmation with a follow-up of the S05 study. In fact at the moment we can somewhat reconcile the two L-Z relation only at the price of a degradation of our data. It is finally worth mentioning that, since the S05 sample includes star-forming galaxies, one could suspect that giant galaxies are offset in luminosity due to the presence of a star-burst: however, Lee et al. ([2004]) find that this offset is a few tenths of magnitude in , compared to quiescent galaxies. We expect that the effect in the IR must be even lower, and certainly not comparable to the one we observe.
Acknowledgements.
We thank John Salzer for useful discussions and for providing his data in electronic format, and Jay Gallagher for important remarks in the course of the meeting. I.S. wishes to thank Ana Maria Hidalgo-Gámez for her kind invitation to UNAM, where some issues of this work were discussed.References
- [1998] Hidalgo-Gámez, A. M., & Olofsson, K. 1998, A&A, 334, 45
- [2003] Hidalgo-Gámez, A. M., Sánchez-Salcedo, F. J., & Olofsson, K. 2003, A&A, 399, 63
- [1999] Hunter, D. A., & Hoffman, L. 1999, AJ, 117, 2789
- [1984] Edmunds, M. G., & Pagel, B. E. J. 1984, MNRAS, 211, 507 (EP)
- [2003] Kennicutt, R. C., Jr., Bresolin, F., & Garnett, D. R. 2003, ApJ, 591, 801 (KBG)
- [1974] Larson, R. B. 1974, MNRAS, 169, 229
- [2004] Lee, J. C., Salzer, J. J., & Melbourne, J. 2004, ApJ, 616, 752
- [2000] Pilyugin, L. S. 2000, A&A, 362, 325 (P00)
- [2001] Pilyugin, L. S. 2001, A&A, 374, 412
- [2000] Pilyugin, L. S., & Ferrini, F. 2000, A&A, 358, 72
- [2004] Pilyugin, L. S., Vílchez, J. M., & Contini, T. 2004, A&A, 425, 849
- [1995] Richer, M. G., & McCall, M. L. 1995, ApJ, 445, 642
- [2005] Salzer, J. J., et al. 2005 ApJ, 624, 661 (S05)
- [2004] Saviane, I., et al. 2004, IAUS, 217, 200
- [1972] Searle, L., & Sargent, W. L. W. 1972, ApJ, 173, 25
- [1989] Skillman, E. D., Kennicutt, R. C., & Hodge, P. W. 1989, ApJ, 347, 875
- [2003a] Skillman, Evan D., Côté, S., & Miller, B. W. 2003a, AJ, 125, 593
- [2003b] Skillman, E.D., C t , S., & Miller, B.W. 2003b, AJ, 125, 610
- [2004] Tremonti, C. A., et al. 2004, ApJ, 613, 898