Optical identification of IGR J19140+0951
IGR J19140+0951 was discovered by INTEGRAL in 2003 in the 4-100 keV band. Observations with INTEGRAL and RXTE provide a tentative identification as a high-mass X-ray binary (HMXB) with a neutron star as accretor. However, an optical counterpart was thus far not established, nor was the presence of a pulsar which is commonly observed in HMXBs. We observed IGR J19140+0951 with Chandra and find the source to be active at a similar flux as previous measurements. The lightcurve shows a marginally significant oscillation at 6.5 ks which requires confirmation. We determine a sub-arcsecond position from the Chandra data and identify the heavily reddened optical counterpart 2MASS 19140422+0952577 in the 2MASS catalog. Optical follow-up observations with the William Herschel Telescope at La Palma exhibit a continuum spectrum coming out of extinction above 7000 Å without strong absorption or emission features. and band photometry point to an optical counterpart extincted by . The extinction is consistent with the interstellar value. None of the data reject the suspicion that IGR J19140+0951 is an HMXB with additional circumstellar obscuration around the accretor.
Key Words.:
X-rays: binaries – X-rays: individual: EXO 1912+098, IGR J19140+0951, 2MASS 19140422+09525771 Introduction
IGR J19140+0951 was discovered with INTEGRAL in March 2003 (Hannikainen et al. 2003) during observations of the nearby (11) microquasar GRS 1915+105. In observations that continued until May the source was detected 70% of the time above a threshold of 9 to 10 mCrab (20–40 keV); the brightest flux was measured during a flare peaking at 70 mCrab (Hannikainen et al. 2004). The position is coincident with that of EXO 1912+098 which was discovered in archival EXOSAT data by Lu et al. (1997). RXTE had made pointed observations of the source prior to the report of the discovery. A public target-of-opportunity observation was triggered in April 2002 by a detection of the source in the BeppoSAX Wide Field Cameras (WFCs; In ’t Zand et al. 2004). RXTE observed the source again in 2003 after the INTEGRAL detection, for 2.8 ks. Swank & Markwardt (2003) find the source to vary on time scales longer than 100 s and peak at 10 mCrab (2–10 keV). is fairly high at cm-2, while the continuum can be described by a power law spectrum with an Fe-K line of equivalent width 500 eV.
The persistent nature of the source, as suggested from the EXOSAT and WFC detections, was confirmed with the RXTE All-Sky Monitor. Corbet et al. (2004) discovered a sinusoidal modulation in the flux with a modulation depth of about 75% and a period of 13.5580.004 d present since the start of observations in 1996. The persistence supports its identification with the orbital period of IGR J19140+0951. This orbital period is highly suggestive of a high-mass X-ray binary (HMXB). An HMXB is a binary consisting of a compact object and a normal star heavier than a few solar masses that is transferring mass to the compact object through a wind or Roche lobe overflow resulting in large amounts of X-ray emission.
Rodriguez et al. (2005) made a comprehensive analysis of the March-May 2003 INTEGRAL data (1.3 Msec of exposure at energies above 4 keV) and 2002-2004 RXTE observations (13 ks above 3 keV). They identify 4 states based on the observed 20–40 keV photon flux, and are able to model the spectrum of each state with a Comptonized component of plasma temperature 10 to 20 keV which in all but the brightest state is complemented with a faint blackbody component. Alternatively, the Comptonized component can be replaced by a cutoff power law with a photon index between 1.4 and 2.4. In almost all observations an Fe-K line is required. The data do not allow an accurate measurement of the line width, although the INTEGRAL data for the middle two states suggest a broad line of width 0.4-1.2 keV or more (1). The source is detected up to keV and the unabsorbed flux at maximum is erg cm-2s-1 (1-20 keV) and 1.0 erg cm-2s-1 (20-200 keV). The RXTE data show a variable between 3 and 10 cm-2, bringing IGR J19140+0951 marginally in the range of the ’obscured INTEGRAL sources’ (for a recent review, see Kuulkers 2005). The Galactic measured by Dickey & Lockman (1990) within 1° from the source is between 1.3 and cm-2; the data point closest to the source (at 024) is cm-2. Rodriguez et al. find that the spectroscopic evidence favors a neutron star over a black hole for the nature of the accretor: in the 20–200 keV luminosity versus 1–20 keV luminosity diagram (first presented by Barret et al. 1996), the source is in the X-ray burster domain as long as the distance is below 10 kpc.
Thus, all evidence points to IGR J19140+0951 being an HMXB with strong and variable local absorption and a neutron star as accretor. Prior to the INTEGRAL discovery we had already proposed a Chandra observation of EXO 1912+098, based on the WFC detection, to search for possible long X-ray pulsations in a faint source and determine an accurate position to search for the optical counterpart. The data were obtained in 2004. They now provide an opportunity to make a conclusive identification of IGR J19140+0951 as an HMXB. Here we present the results of this observation and of the optical follow up.


2 Chandra observation
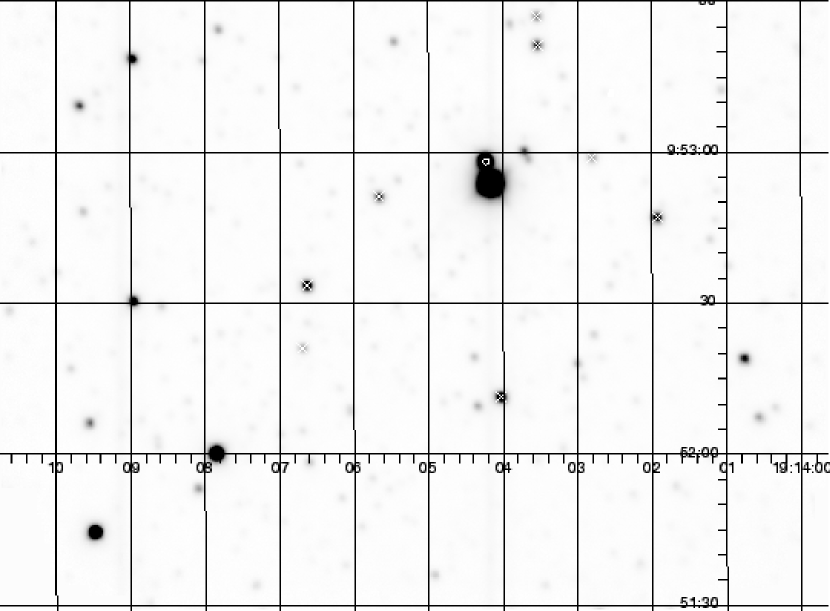
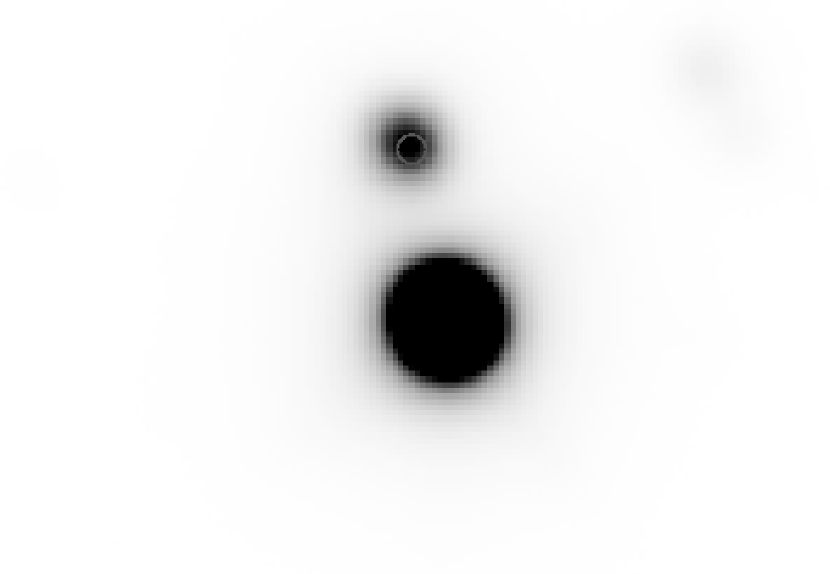
Chandra observed IGR J19140+0951 on May 11th, 2004, starting at 17:53:30 UT, with the ACIS-S CCD array (Garmire et al. 2003) in the focal plane and no grating. The CCD frame time of the data is 3.2 s, the exposure time 20.10 ks. The binary orbital phase coverage is 0.833–0.850 with an uncertainty of 0.055 based on the ephemeris of Corbet et al. (2004). Thus, the observation was well ahead of the maximum orbital modulation. The source is clearly detected. It is the only source brighter than 0.0003 c s-1 inside the INTEGRAL error circle (Hannikainen et al. 2004). The image shows a piled-up source with readout trails but no obvious hole at the center of the point spread function. The average position of all photons within 10″ is , (, ) with a nominal uncertainty of 06. This position is consistent with that of EXO 1912+098, IGR J19140+0951 and the BeppoSAX/WFC position, see Fig. 1.


We reprocessed the level-1 data with CIAO version 3.2.1 to resurrect afterglow events, using among other tools acis_run_hotpix. This procedure adds 6.9% to the number of photons within 20 of the source. We extracted a source spectrum from the photons in this region with the CIAO tool psextract; a background spectrum was extracted from a circular region with a radius of 1′ on the same CCD and centered 70″ from the source centroid. The spectral analysis was performed with XSPEC version 11.3.1 (Arnaud 1996). We employed the pileup model in XSPEC which was specifically designed for the analysis of ACIS data (Davis 2001), leaving free the morphing parameter and the fraction of the point-spread function (PSF) that is piled up. The spectrum was binned so that at least 15 photons are contained per bin, thus allowing the use of the statistic as a goodness of fit estimator. The resulting spectrum can be well fitted with an absorbed power-law ( for 130 degrees of freedom). The photon index is (all errors quoted in this paper are for a 90% confidence level) and cm-2. These values are similar to those found by Rodriguez et al. (2005). The absorption column is considerably larger than the interstellar value. Figure 2 shows the spectrum and model fit. Very few photons are detected below 1 keV and they were not taken into account when fitting models, neither were photons above 10 keV. The unabsorbed 1-10 keV flux is erg cm-2s-1, but this number is susceptible to systematic errors because of the uncertainty of the pileup correction. Therefore, we verified it with the spectrum of the readout trail. This spectrum was extracted with the CIAO tool acisreadcorr. A background spectrum was extracted from a strip on the detector 50″ to the north. The spectral shape is consistent with the above result: , cm-2 ( for 51 degrees of freedom). If we fix the spectral shape to the more accurately determined former shape and fit the flux, we find (1-10 keV) or erg cm-2s-1 (1-20 keV). This is fainter than in all INTEGRAL detections analyzed by Rodriguez et al. (2005) but 50% brighter than in the brightest pointed RXTE observation. We find no evidence for an Fe-K line at 6.4 keV. Adding a Gaussian line at 6.4 keV improves the fit by in the PSF spectrum which is not significant (10% chance probability). The 90%-confidence upper flux limit on a narrow line is phot s-1cm-2; on a Gaussian line with keV it is phot s-1cm-2. The limits on the equivalent widths are 116 eV and 839 eV respectively. These values are consistent with the INTEGRAL and RXTE detections for a broad line, but inconsistent for a narrow line. Thus, a comparison of the Chandra with the INTEGRAL/RXTE observations rules out a narrow line, if the line is present with a similar equivalent width.
We generated light curves from the trailed photons at various time resolutions between 40 and 1000 s. The high-resolution data do not show interesting features. We show in Fig. 3 (top) the time profile at 1000 s resolution. The source is obviously variable. There is even a hint of an oscillation with a period of about 6.5 ks. We also generated a light curve from photons in an annulus around the PSF (Fig. 3 bottom), thus minimizing pile up effects. The modulation is also visible here. We checked RXTE All-Sky Monitor (ASM) data for a confirmation. The ASM data are marginally qualified for that because the detection threshold is about 40% , and the time resolution is high enough (90 s) to resolve a 6.5 ks modulation. We tested the full data set as well as orbital phases at which the flux is highest and the three energy channels separately. The times were corrected for the Earth’s orbit around the Sun, but not for the satellite or binary orbit which are not important for a possible 6.5 ks pulsation. We are unable to obtain an unambiguous confirmation from the ASM data. This negative ASM result implies that the 6.5 ks modulation probably is not related to a neutron star spin. However, additional confirmation may be worthwhile since modulation patterns may change (e.g., Patel et al. 2004).
3 Optical and near-infrared observations
3.1 Identification of counterpart
We cross checked the Chandra position with the USNO B1.0 (Monet et al. 2003) and 2MASS (Skrutskie et al. 1997) catalogs and found a 2MASS object consistent with the Chandra position (2MASS 19140422+0952577). It is fairly close (40) to another bright object to the south. We acquired a near-infrared image of the field in the band under non-photometric conditions using the 3.6 m ESO NTT with SOFI, see Fig. 4. It clearly reveals the two objects near the Chandra position. After calibrating the plate scale through 9 isolated stars that were identified in the 2MASS catalog, the northern object was localized at , which is 006 from the Chandra position of the X-ray source and 06 from the 2MASS position of the optical counterpart. The southern object is present in the USNO B1.0 catalog while the northern is not, testifying to the redness of the optical counterpart. The 2MASS magnitudes are for the northern and for the southern object.
3.2 Spectroscopy
We obtained two spectra of 2MASS 19140422+0952577 on August 12, 2004, each with an exposure time of 1500 seconds, using the ISIS spectrograph mounted on the 4.2 m William Herschel Telescope located at the Roque de Los Muchachos Observatory, La Palma, Spain. We used the R316R grating with the central wavelength set to 7500 Å and a slit width of 1″ in combination with the MARCONI2 CCD. This setup yields a mean dispersion of 0.83 Å per pixel. The source was observed at an airmass of 1.1. It, as well as the southern source in the 2MASS image, is not resolved into multiple sources with a seeing of 12 (FWHM). Due to the high interstellar extinction towards the source we are not able to detect the source spectrum in the blue arm of the ISIS spectrograph. In the red arm of the spectrograph we detect the source redward of Å, see Fig. 5. We find weak evidence for absorption lines from the Paschen series. However, due to the relatively low signal–to–noise ratio, the presence of telluric lines at or close to the wavelength of some of the Paschen lines, and fringing in the red part of the CCD for which no calibration measurements are available, the continuum level is too uncertain to determine. We estimate a conservative upper limit to the equivalent width of any narrow line of 1.6 Å. The spectroscopic data have too narrow a bandpass to confidently determine the spectral type. The presence of Paschen absorption lines, if confirmed, would point to an A, B or late O–type companion star.

3.3 Photometry
The 2MASS magnitudes for the optical counterpart are , and . However, this is based on aperture photometry without taking into account the blending by the southern source. Therefore, the brightnesses are overestimated. This is shown through a measurement of using the new image taken on May 18, 2005, albeit under non-photometric circumstances (Fig. 4). After calibrating the magnitude scale with 4 isolated stars that are also present in the 2MASS catalog and have the same magnitude differences among them, we find which is 1.6 mag fainter than in the 2MASS catalog.
We obtained additional images in the (180 s total exposure) and band (240 s) with the 1 m Henrietta Swope telescope at Las Campanas Observatory on August 7, 2005. The seeing was 13 at an airmass of 1.3. The counterpart was detected in at 13.0 mag, while it was not detected in . A limit of mag was determined from the magnitude of the faintest unambiguous star visible in the field.
We also checked infrared data taken with the Midcourse Space Experiment (MSX; Mill et al. 1994) and find a Jy object in the most sensitive 8.3 m band at , with a 1-sigma uncertainty of 08. This is 25 from the optical counterpart (or 3) and 16 (2) from the nearby southern object. Given the uncertainty we cannot rule out an association with the unrelated southern object.
We sought confirmation on the suspected early spectral type by fitting photometric models for main sequence and supergiant stars (Cox 2000), using extinction laws from Schlegel et al. (1994), to the photometry. The results are ambiguous, see Fig. 6. The best fit models are late-type stars (G3I or V), but the fits are not acceptable. Photometric fits with earlier spectral types are worse. Possibly the non-simultaneity of the measurement with the and measurements plays a role.
The extinction leaves an unambiguous imprint on the photometry, and is fairly independent of spectral type. The values for range between 9 and 12 and are, based on the translations determined by Predehl & Schmitt (1995), consistent with cm-2.


4 Discussion
Our observations result in the secure identification of the optical counterpart to one of the ’obscured INTEGRAL sources’ (e.g., Kuulkers 2005). Like the counterpart of the prototypical IGR J16318-4848 (Filliatre & Chaty 2004), it is a peculiar highly reddened object with bright NIR magnitudes whose spectral type still needs to be resolved.
The most likely scenario is that the optical counterpart is an early-type star in an HMXB. In analogy to other HMXBs, the X-ray persistence, the orbital modulation and the lack of a short pulse period suggests a supergiant donor star. An alternative to an HMXB scenario would be a low-mass X-ray binary (LMXB) where a Roche-lobe filling sub-solar mass star is donating matter to a compact object via an accretion disk. This is unlikely on two grounds. First, the orbital period is much longer than most LMXBs (c.f., Liu et al. 2001). Second, optical counterparts to LMXBs typically have between -2 and 2 (e.g., Wachter et al. 2005). This would imply for IGR J19140+0951 a distance between 30 and 90 pc and a maximum 1-200 keV luminosity of erg s-1. This is inconsistent with its persistently active behavior: accretion disks become unstable at such low luminosities for the orbital period measured for IGR J19140+0951 (e.g., Van Paradijs 1996).
Support for the HMXB scenario also comes from the position: IGR J19140+0951 is in the direction of the tangent to the Sagittarius arm. HMXBs are expected to be coincident with spiral arms because that is where young systems reside. If the association with the Sagittarius arm is true, the distance is of the order of 2 to 6 kpc. The implied 1–20 keV luminosity during the Chandra observation is roughly 1035 erg s-1, a common value for an HMXB.
There is no evidence for obscuration of the optical counterpart beyond the interstellar values provided by Dickey & Lockman (1990), while there is such evidence for the accretor through X-ray observations. The orbital modulation of the X-ray flux (Corbet et al. 2004) suggests either the presence of an inclined circumstellar disk formed by the donor or an eccentric orbit, or both.
Further understanding of IGR J19140+0951 would benefit from a longer Chandra or XMM-Newton observation, to study the variability (in particular possible pulsations) without data gaps due to earth occultations, and from a calibrated infrared spectrum in the I to L bands, in order to measure spectral lines and achieve a reliable spectral classification.
Acknowledgements.
We thank Mariano Méndez for useful discussions and the anonymous referee for useful suggestions. JZ acknowledges support from the Netherlands Organization for Scientific Research (NWO). DS acknowledges a Smithsonian Astrophysical Observatory Clay fellowship. We thank the Observatories of the Carnegie Institution of Washington for providing access to the Swope telescope at Las Campanas Observatory in Chile. This research has made use of the NASA/IPAC Infrared Science Archive, which is operated by the Jet Propulsion Laboratory, California Institute of Technology, under contract with NASA, and of the RXTE/ASM archive provided by ASM teams at MIT and at the RXTE SOF and GOF at NASA/GSFC.References
- (1) Arnaud, K.A. 1996, in ’Astronomical Data Analysis Software and Systems V’, eds. G. Jacoby & J. Barnes, ASP Conf. Ser., 101, p. 17
- (2) Barret, D., McClintock, J.E., & Grindlay, J.E. 1996, ApJ, 473, 963
- (3) Cabanac, C., Rodriguez, J., Hannikainen, D., et al. 2004, ATel 272
- (4) Corbet, R.H.D., Hannikainen, D.C., & Remillard, R. 2004, ATel 269
- (5) Cox, A. 2000, “Allen’s Astrophysical Quantities”, 4th edition, Athlone Press (London)
- (6) Davis, J.E. 2001, ApJ, 562, 575
- (7) Dickey, J.M., & Lockman, F.J. 1990, ARAA, 28, 215
- (8) Filliatre, P., & Chaty, S. 2004, ApJ, 616, 469
- (9) Garmire, G.P., Bautz, M.W., Fort, P.G., Nousek, J.A., & Ricker, G.R. 2003, Proc. SPIE, 4851, 28
- (10) Hannikainen, D.C., Rodriguez, J., & Potschmitt, K. 2003, IAUC 8088
- (11) Hannikainen, D.C., Rodriguez, J., Cabanac, C., et al. 2004, A&A, 423, L17
- (12) In ’t Zand, J.J.M., Heise, J., Ubertini, P., Bazzano, A., Markwardt, C.B. 2004, in ’The INTEGRAL Universe’, Proc. 5th INTEGRAL workshop, eds. Schönfelder, G. Lichti & C. Winkler, ESA SP-552, 427
- (13) Kuulkers, E. 2005, in ”Interacting Binaries: Accretion, Evolution and Outcomes”, Eds. L.A. Antonelli, et al., Proc. of the Interacting Binaries Meeting of Cefalu, Italy, July 2004, AIP, in press (astro-ph/0504625)
- (14) Liu, Q.Z., van Paradijs, J., van den Heuvel, E.P.J. 2001, A&A, 368, 1021
- (15) Lu, F.-J., Li, T.-B., Wu, M., & Sun, X.-J. 1997, Acta Astron. Sinica, 38, 56
- (16) Mill, J., O’Neil, R.R., Price, S.D., et al. 1994, AIAA J., 31, 900
- (17) Monet, D., Levine, S.E., Canzian, B., et al. 2003, AJ, 125, 984
- (18) Rodriguez, J., Cabanac, C., Hannikainen, D.C., Beckmann, V., Shaw, S.E., & Schultz, J. 2005, A&A, 432, 235
- (19) Patel, S.K., Kouveliotou, C., Tennant, A., et al. 2004, ApJ, 602, L45
- (20) Predehl, P., & Schmitt, J.H.M.M. 1995, A&A, 293, 889
- (21) Schlegel, D.J., Finkbeiner, D.P., & Davis, M. 1994, ApJ, 500, 525
- (22) Skrutskie, M.F., Schneider, S.E., Stiening, R.; et al. 1997, in ’The Impact of Large Scale Near-IR Sky Surveys’, eds. F. Garzon et al., p. 25
- (23) Swank, J.H., & Markwardt, C.B. 2003, ATel 128
- (24) van Paradijs, J. 1996, ApJ, 464, L139
- (25) Wachter, S., Wellhouse, J.W., Patel, S., Smale, A.P., Alves, J.F., & Bouchet, P. 2005, ApJ, 621, 393