Discovery of Rapid X–ray Oscillations in the Tail of the SGR 1806–20 Hyperflare
Abstract
We have discovered rapid Quasi Periodic Oscillations (QPOs) in RXTE/PCA measurements of the pulsating tail of the 27th December 2004 giant flare of SGR 1806–20. QPOs at 92.5 Hz are detected in a 50 s interval starting 170 s after the onset of the giant flare. These QPOs appear to be associated with increased emission by a relatively hard unpulsed component and are seen only over phases of the 7.56 s spin period pulsations away from the main peak. QPOs at 18 and 30 Hz are also detected 200-300 s after the onset of the giant flare. This is the first time that QPOs are unambiguously detected in the flux of a Soft Gamma–ray Repeater, or any other magnetar candidate. We interpret the highest QPOs in terms of the coupling of toroidal seismic modes with Alfvén waves propagating along magnetospheric field lines. The lowest frequency QPO might instead provide indirect evidence on the strength of the internal magnetic field of the neutron star.
Received: 15 March 2005; Accepted: 10 May 2005
1 Introduction
Soft Gamma-ray Repeaters (SGRs) are characterized by short and recurrent bursts ( 1s) of soft rays. Only four confirmed SGRs are known, three in the Galaxy and one in the Large Magellanic Cloud (for a review see e.g. Woods & Thompson 2004). Giant flares from SGRs, with a fluence more than 3 orders of magnitude higher than that of typical bursts, are rare. Energy release in the 1979 March 5th event from SGR 0526–66 was 1044 erg (Mazets et al. 1979), while on 1998 August 27th a giant flare was detected from SGR 1900+14 at a level of 21044 erg (Cline et al. 1998; Hurley et al. 1999; Feroci et al. 1999). The nature of SGRs has remained a mystery for many years. The s periodicity clearly seen in the tail of the 1979 March 5th giant flare of SGR 0526–66 (Mazets et al. 1979) suggested an association of SGRs with neutron stars. Further evidence came with the discovery and study of the persistent counterparts to SGRs in the soft X–ray range (10 keV). These display X-ray coherent pulsations at a period of s, a secular spin-down in the range 10-11–10-10 s s-1, and a quiescent X–ray luminosity orders of magnitude larger than the rotational energy loss.
Several observational properties of SGRs are successfully modelled in terms of “magnetars” (Duncan & Thompson 1992; Thompson & Duncan 1995), isolated neutron stars in which the dominant source of free energy is their intense magnetic field (B1014-1015 G). Within this model the short bursts are produced by the propagation of Alfvén waves in the magnetosphere, driven by magnetic field diffusion across small cracks in the neutron star crust. The much more energetic giant flares likely arise from a sudden reconfiguration of the star’s magnetic field that produces large fractures in the crust and propagates outwards through Alfvén waves of enormous power.
On 2004 December 27th a giant flare from SGR 1806–20 was detected by a number of different satellites (INTEGRAL, RHESSI, Swift, Wind, Mars Odyssey, etc.; Borkowski et al. 2004, Hurley et al. 2005, Palmer et al. 2005, Hurley et al. 2004, Mazets et al. 2004). This “hyperflare” caused a strong perturbation in the Earth ionosphere and saturated the detectors on every high-energy satellite (except GEOTAIL; Yamazaki et al. 2005, Terasawa et al. 2005). A total energy of 1046 erg (isotropic emission at a source distance of 8-15 kpc; Cameron et al. 2005; McClure-Griffiths & Gaensler 2005) was released during the main 0.2-0.5 s long spike at the beginning of the event. Seven days after the event, SGR 1806–20 was observed and detected in the radio band for the first time (VLA; Gaensler et al. 2005a). The radio polarization and flux decay was found to be consistent with synchrotron radiation from an expanding nebula (Gaensler et al. 2005b).
Based on high-time resolution data obtained with the Rossi X–ray Timing Explorer (RXTE) Proportional Counter Array (PCA), we report the first detailed X–ray timing analysis of the 2004 December 27th hyperflare of SGR 1806–20. In particular, we discover fast X–ray Quasi Periodic Oscillations during the pulsating tail of the event. Such QPOs are clearly associated with a relatively hard emission component which dominates the overall energy emission, about 170-220 s after the beginning of the flare. These QPOs are only detected during a given phase interval of the 7.56 s period,
(Fig. 1a). We briefly discuss some implications of these findings for the magnetar model.
2 Observations and Timing Analysis
The giant flare of SGR 1806–20 was recorded by RXTE on 2004 December 27th at 21:31:30.7 UT during the observation of the cluster of galaxies A2163. The PCA was observing in GoodXenon mode, resulting in full timing () and spectral resolution (covering the nominal energy range 2-80 keV). Even though the position of SGR 1806–20 was 30 degrees away from the RXTE pointing direction and well outside the field of view, the giant flare was detected by the PCA at a peak rate of counts/s, not corrected for deadtime effects (note that photons from SGR 1806–20 propagated through the passive material of the proportional counter units and collimators before they were recorded by the instruments, which likely resulted in modification of the incident spectrum). The RXTE telemetry was saturated, gcausing data gaps in the first 13 s of the flare. We restricted our timing analysis to the saturation- and gap-free interval, starting 12.8 s after the onset of the initial spike. A search for anomalous values and/or trends in the housekeeping parameters for the data in this interval gave negative results. A light curve was accumulated from all PCA channels with a resolution of 1/256 s (a 0.5 s binned light curve is shown in Fig. 2). Two spectrograms (also known as dynamical power spectrum, see Nespoli et al. 2003) consisting of power spectra built on interval lengths of 2 and 64 seconds, respectively, each shifted from the other by 2 seconds, were produced.
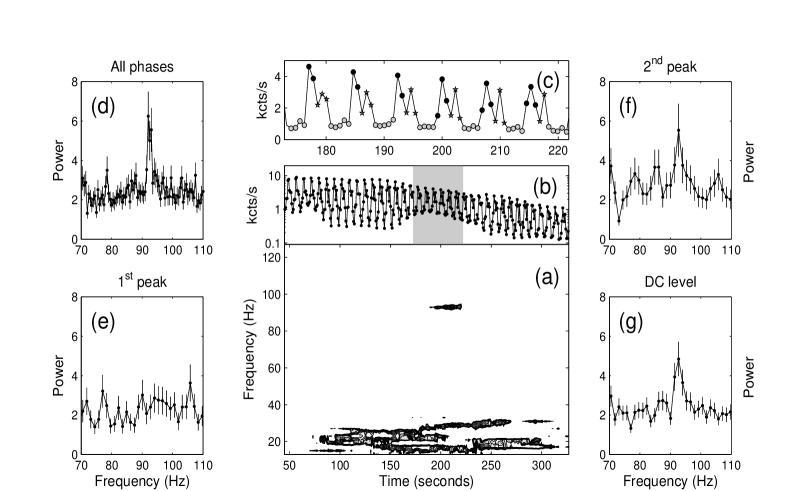
A contour plot of the 64 s spectrogram is shown in Fig. 1a, where time 0 is set to T0+12.8 s, where T0 is the RHESSI time marking the onset of the main peak as given by Hurley et al. (2005), that is 774026.64 s of TJD 13366. In addition to complex signals below 30 Hz (see below), a peak in the power spectra around 90 Hz was detected during the interval 170-220 s from T0. A Lorentzian fit to the peak in Fig. 1d (limited to the frequency range 70–110 Hz) yields a centroid frequency of 92.50.2 Hz, a FWHM of 1.7 Hz (uncertainties are at 1 confidence level), corresponding to a signal coherence of Q50. The integrated fractional rms of the peak is 7.30.7%. The single trial chance probability of the 92.5 Hz QPO peak, calculated by using the prescription of Israel & Stella (1996), is 1.310-7 which reduces to 1.510-5 – 1.310-4 after normalization for the number of periods (128 – 1024) over which the search was carried out. We thus consider the 92.5 Hz QPO detection to be quite robust.
In order to investigate a possible dependence of the QPOs on the pulsations in the tail of the hyperflare, we adopted a reference period of 7.5605(6) s (Woods et al. 2005) and divided the individual pulsation cycles into different phase intervals (see insets in Fig. 2) We selected intervals centered around the main peak at phase 0.4, the second peak at phase 0.7, and the minimum around phase 0 (including also the third low peak at phase 0.15; see insets of Fig 2). The results of pulse–phase timing analysis are summarized in panels e, f and g of Fig. 1, which show power spectra for the main peak, the second peak and the minima, respectively. It is evident that the 92.5 Hz oscillations are absent in the main peak (3 upper limit of % rms), clearly detected in the minima (rms amplitude of %), and still present, though at a lower significance, in the second peak (rms amplitude of %; no dependence with energy was detected). The data thus rule out the assumptions that QPO fraction and flux level are independent of pulsation phase. The observed pulse phase dependence of the QPO amplitude makes us confident that the oscillations are intrinsic to SGR 1806–20111A search for QPOs in the light curve of the on-axis source (A2163) just before and after the SGR 1806–20 hyperflare also gave negative results..
Since the 92.5 Hz QPO is detected during the minima of the pulsation cycle and is absent during the main peak, we checked whether the signal is more coherent, but smeared out by the peak intervals. The check was carried out by producing a single power spectrum of the data in the gray area of Fig. 1b with pulse peaks replaced with the average level of the out-of-peak intervals and, therefore, minimizing the aliasing due to the pulse oscillation. The analysis indicates that the 92.5 Hz peak is indeed intrinsically broad and not consistent with a coherent signal.
From Fig. 1a, one can see also a significant amount of power in the 20-30 Hz interval. The structure of this signal is complex and the accumulation of all power spectra leads only to a broad excess. We subdivided the light curve into smaller intervals and checked for significant signal below 40 Hz. Power spectra obtained from data in the time range 200-300 s (right after the gray area in Fig. 1b), showed two peaks at 18 and 30 Hz (see Fig. 3). A fit to the continuum (constant plus a power–law) yields two QPOs at 18.10.3 Hz and 30.40.3 Hz with a single trial significance of 3.6 and 4.7, respectively. A weak excess is also visible at 95 Hz, indicating a possible time evolution of the 92.5 Hz QPO frequency. The relatively low statistics in the time intervals 200-300 s prevented us from checking whether these additional QPOs show a 7.56 s pulse phase dependence like that displayed by the 92.5 Hz QPO. Finally, we note that the contours in Fig. 1a indicate a lower level of low-frequency power before t70. Although a detailed analysis of the shape of the signal is difficult because of low statistics, it is evident from the data that before that time the low-frequency noise is steeper and contributes substantially only below 10 Hz.
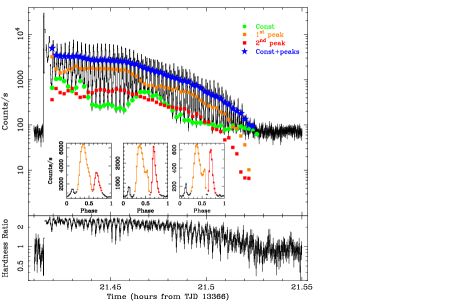
In the following, we study the 92.5 Hz QPOs with respect to the other parameters of the hyperflare light curve, looking for correlations which might provide clues to the origin of the oscillations. To this end we further analyzed the individual 7.56 s pulses. Given the highly non-sinusoidal shape of the pulses we accumulated 50 light curves each containing one pulse divided into 50 phasebins, and used a multi-Gaussian fitting model produced acceptable fits to all the 50 pulses (we have ignored the first 2 pulses after the initial spike). The number of degree of freedom in each fit was 33 (for 50 phasebins). Figure 2 shows the result of this analysis where the fitted parameters are shown together with the PCA light curve: the DC level (green circles), the count rates of the main peak (orange squares), of the second peak (red squares), and of all components together (blue stars). From the comparison between Fig. 1 and Fig. 2 it is evident that the time interval over which the 92.5 Hz QPOs are significantly detected coincides with a bell-shape enhancement in the DC level about 200s after the beginning of the flare. Moreover, it is apparent that the intensity of the DC level and that of the main peak of the pulse are anti-correlated (i.e., the first peak component shows a marked decrease corresponding to the rise of the bell–shaped intensity bump of the DC), possibly implying two competing emission components. We also note that the ratio between the nominal 1-9 keV (effectively, 8-9 keV, due to the steep photoelectric absorption by the PCA copper collimators) and 9-25 keV energy band light curves shows that the pulse minima are always softer than the peaks (this behavior is similar to that of the SGR 1900+14 giant flare; Feroci et al. 1999), except during the bell–shaped bump where minima are nearly as hard as the maxima (see lowest panel of Fig. 2). These findings clearly suggest that the bell–shaped bump in the decaying pulsating tail of the giant flare represents an additional unpulsed component underlying the main pulse component.
3 Discussion
We discovered rapid quasi periodic X–ray oscillations in the evolving X–ray flux of the 2004 Dec 27th hyperflare of SGR 1806–20, the first ever for a magnetar candidate. The higher frequency QPOs at 92.5 Hz were detected between 170 and 220 s after the onset of the hyperflare, in association with an emission bump that occurred in the DC component (and a reduction of the amplitude of the 7.56 s pulsations). These QPOs were detected only in the spin phase intervals away from the main peak and reached maximum amplitude corresponding to the DC component phase intervals. Evidence for 18 and 30 Hz QPOs was found between 200 and 300 s from the onset of the hyperflare, and not obviously related to any specific interval of pulse phases.
In the context of the magnetar scenario, the main spike of the giant flare
arises from a fireball of pair-dominated plasma that expands at relativistic
speeds, while the energy deposited in the magnetosphere can give rise to a
"trapped fireball" that remains confined to the star’s closed magnetic field
lines. The long pulsating tail of giant flares probably arises from the cooling
of plasma that remains confined in such a trapped fireball. The bump in the DC
component of the decay some 200 s after the
main spike during which the 92.5 Hz QPOs were seen, might be due to a
temporary enhancement of the Alfvén wave emission due to dissipation of the
seismic energy. This may lead to the formation of a hot pair-dominated corona
which partially enshrouds the trapped fireball, thereby reducing the amplitude
of main peak
![[Uncaptioned image]](/html/astro-ph/0505255/assets/x3.png) Figure 3: Power spectrum accumulated from data in the time interval 200–300 s
(see Fig. 1). Two low–frequency peaks at 18 Hz and
30 Hz are visible, together with a small excess at 95 Hz (see text
for details).
Figure 3: Power spectrum accumulated from data in the time interval 200–300 s
(see Fig. 1). Two low–frequency peaks at 18 Hz and
30 Hz are visible, together with a small excess at 95 Hz (see text
for details).
of the 7.56 s modulation. A similar interpretation was originally proposed by Feroci et al. (2001; see also Thompson & Duncan 2001) to explain the smooth flux decay in the first tens of seconds of the 1998 giant flare from SGR 1900+14. Indeed, a variety of seismic modes are expected to be excited as consequence of the magnetically-induced large scale fracturing of the crust which gives rise to giant SGR flares. After the main event, the shaking of the neutron star crust by these seismic modes gives rise to a coupling with sheared Alfvén waves on field lines in the neutron star’s magnetosphere, in turn causing electromotive pair heating (Thompson & Blaes 1998). A modulation of this heating at the seismic frequencies would easily generate a flux modulation, as long as the frequencies are sufficiently low that phase coherence can be maintained across the photosphere of the trapped fireball.
Out of the variety of non-radial neutron star modes studied by McDermott et al (1988), there are several classes that have characteristic frequencies in the 10-100 Hz range. Toroidal modes appear to be especially promising because they should be easily excited by the large crustal fracturing. Moreover, these torsional modes couple more easily with the external magnetic field lines than modes originating deeper in the stellar interior (Blaes et al. 1989; Duncan 1998). The fundamental toroidal mode of a rigid neutron star’s crust is the () mode whose frequency corresponds to a period of 33.6 ms, somewhat dependent on the mass, radius and crustal magnetic field (McDermott et al. 1988, Duncan 1998). The 30.4 Hz (32.8 ms) oscillation could very well be identified with the mode and the 92.5 Hz (10.8 ms) QPO would thus correspond to a higher harmonic: indeed, it matches well the expected frequency of the =7 mode, suggesting a relatively small-scale structure in the seismic wave pattern (and thus the magnetic multipole structure). This could be due, for example, to the principal mode inducing further fractures at various sites in the crust. The shortest duration of the higher frequency QPO is qualitatively in accord with the expectation that the damping rate of the oscillations strongly increases with frequency (Duncan 1998). Recently, a large ( 5km) crustal fracturing on the surface of SGR 1806–20 was inferred from a 5 ms rise timescale observed during the onset of the hyperflare (Schwartz et al. 2005). We note that such fracturing can easily excite the toroidal modes with characteristic frequencies at which QPOs have been detected.
The 18 Hz oscillation, on the other hand, might be associated with a different mode which must couple to the magnetosphere as well. A poloidal component of the core magnetic field supports a torsional mode with a frequency Hz (Thompson & Duncan 2001) with 10 km and a core density g cm-3, being the core poloidal field in units of G: a strong would be required to match the observed 18 Hz. Although extremely strong, such a field is fully plausible given that a (mainly toroidal) field in excess of G is required to power repeated giant flares of this magnitude over the yr lifetime of an SGR (Stella, Dall’Osso, & Israel 2005).
In summary, the discovery of rapid QPOs in the tail of the 2004 giant flare of SGR 1806–20 could constitute the first direct information on the neutron star crust and magnetic field, thought to be of magnetar strength, and provides a new perspective in the study of neutron star oscillations.
References
- (1) Blaes, O., Blandford, R.D., Goldreich, P., & Madau, P. 1989, ApJ, 343, 839
- (2) Borkowski, J. et al. 2004, GCN #2920
- (3) Cameron, P.B. et al. 2005, Nature, 434, 1112
- (4) Cline, T., Mazets, E., & Golenetskii, S.V. 1998, IAU Circ.7002
- (5) Duncan, R.C. 1998, ApJ, 498, L45
- (6) Duncan, R.C., & Thompson, C. 1992, ApJ, 392, L9
- (7) Feroci, M., Frontera, F., Costa, E., Amati, L., Tavani, M., Rapisarda, M., & Orlandini, M. 1999, ApJ, 515, L9
- (8) Feroci, M., Hurley, K., Duncan, R. C. & Thompson, C. 2001, ApJ, 549, 1021
- (9) Gaensler, B.M. et al. 2005a, GCN #2929
- (10) Gaensler, B.M. et al. 2005b, Nature, 434, 1104
- (11) Hurley, K., et al. 1999, Nature, 397, 41
- (12) Hurley, K. et al. 2004, GCN Circ. #2921
- (13) Hurley, K. et al. 2005, Nature, submitted, astro–ph/0502329
- (14) Israel, G.L., & Stella, L. 1996, ApJ, 468, 369
- (15) McClure-Griffiths, N. M., & Gaensler, B. M., 2005, ApJ, submitted, astro–ph/0503171
- (16) McDermott, P. N., Van Horn, H. M., & Hansen, C. J. 1988, ApJ, 325, 725
- (17) Mazets, E. P., Golentskii, S. V., Ilinskii, V. N., Aptekar, R. L., & Guryan, I. A. 1979, Nature, 282, 587
- (18) Mazets, E. P., et al. 2004, GCN Circ. #2922
- (19) Nespoli, E., Belloni, T., Homan, J., Miller, J. M., Lewin, W. H. G., Mendez, M., van der Klis, M., 2003, A&A, 412, 235
- (20) Palmer, D.M. et al. 2005, Nature, 434, 1107
- (21) Schwartz, S.J., et al. 2005, ApJ, submitted, astro–ph/0504056
- (22) Stella, L., Dall’Osso, S. & Israel, G.L. 2005, ApJ, submitted
- (23) Terasawa, T. et al. 2005, Nature, 434, 1110
- (24) Thompson, C., & Duncan, R.C. 1995, MNRAS, 275, 255
- (25) Thompson, C., & Blaes, O. 1998, Phys. Rev. D, 57, 3219
- (26) Thompson, C., & Duncan, R.C. 2001 ApJ, 561, 980
- (27) Woods, P. M. & Thompson, C. 2004, ApJ, submitted, astro-ph/0406133
- (28) Woods, P. M., et al 1005, GCN #2950
- (29) Yamazaki, R. et al. 2005, Nature, submitted, astro–ph/0502320