The Distribution of Bar and Spiral Arm Strengths in Disk Galaxies
Abstract
The distribution of bar strengths in disk galaxies is a fundamental property of the galaxy population that has only begun to be explored. We have applied the bar/spiral separation method of Buta, Block, and Knapen to derive the distribution of maximum relative gravitational bar torques, , for 147 spiral galaxies in the statistically well-defined Ohio State University Bright Galaxy Survey (OSUBGS) sample. Our goal is to examine the properties of bars as independently as possible of their associated spirals. We find that the distribution of bar strength declines smoothly with increasing , with more than 40% of the sample having 0.1. In the context of recurrent bar formation, this suggests that strongly-barred states are relatively short-lived compared to weakly-barred or non-barred states. We do not find compelling evidence for a bimodal distribution of bar strengths. Instead, the distribution is fairly smooth in the range 0.0 0.8.
Our analysis also provides a first look at spiral strengths in the OSU sample, based on the same torque indicator. We are able to verify a possible weak correlation between and , in the sense that galaxies with the strongest bars tend also to have strong spirals.
1 Introduction
Bars and spirals are an important part of the morphology of disk galaxies. These “showy disk morphological features which characterize the (Hubble) tuning fork” (Firmani & Avila-Reese 2003) play a role in general classification schemes (e.g., Hubble 1926; Sandage 1961; de Vaucouleurs 1959; Sandage & Bedke 1994), and also can be tied to disk galaxy evolution (e.g., Kormendy & Kennicutt 2004). Over the past two decades, there has been a great deal of interest in the properties of bars, including quantification of bar strength (e.g., Elmegreen & Elmegreen 1985; Martin 1995; Wozniak et al. 1995; Martinet & Friedli 1997; Rozas et al. 1998; Aguerri et al. 1998; Seigar & James 1998; Aguerri 1999; Chapelon et al. 1999; Abraham & Merrifield 2000; Shlosman et al. 2000; Buta & Block 2001; Laurikainen & Salo 2002; Knapen et al. 2002), bar pattern speeds (Elmegreen et al. 1996; Corsini et al. 2003, 2004; Debattista and Williams 2004; Aguerri et al. 2003; Debattista et al. 2002; Gerssen et al. 1999; Merrifield and Kuijken 1995), mass inflow rates (Quillen et al. 1995), and studies of the distribution of bar strengths (Block et al. 2002; Whyte et al. 2002; Buta, Laurikainen, & Salo 2004). The most recent studies have indicated, on one hand, that bar and spiral strength can be quantified in a reasonable manner from near-infrared images and, on another hand, that such quantifications are useful for probing both bar and spiral evolution.
The distribution of bar strengths is a particularly important issue. It is well known that as much as 70% of normal bright galaxies are barred at some level (e.g., Eskridge et al. 2002), which suggests that bars might be long-lived features. However, in the presence of gas, bars are not expected to be permanent features of galaxies, but should dissolve in much less than a Hubble time owing to mass inflow into the nuclear region which can build up a central mass concentration and destroy a bar (Pfenniger and Norman 1990). The high frequency of bars has thus led to the idea that bars dissolve and reform many times during a Hubble time (Combes 2004). If this is the case, the distribution of bar strengths will tell us the relative amount of time a galaxy stays in a given bar state (strong, weak, or non-barred; Bournaud & Combes 2002; Block et al. 2002).
Block et al. (2002) and Buta, Laurikainen, & Salo (2004=BLS04) used the gravitational torque method (GTM; Buta & Block 2001; Laurikainen & Salo 2002) to derive maximum relative nonaxisymmetric torque strengths for the Ohio State University Bright Galaxy Survey (OSUBGS, Eskridge et al. 2002), a statistically well-defined sample of nearby bright galaxies. Block et al. (2001, 2004), BLS04, and Laurikainen, Salo, & Rautiainen (2002) showed that correlates with deprojected bar ellipticity, a popular parameter suggested by Athanassoula (1992) to be a useful (although incomplete) measure of bar strength (e.g., Martin 1995; Whyte et al. 2002). The correlation was found by Laurikainen, Salo, & Rautiainen (2002) to be much better when objectively-measured near-IR ellipticities are used as opposed to the optical ellipticities estimated by Martin (1995) from blue light photographs. The good correlation is very important, because the shape of the bar relates to the shape of the orbits which build up the bar, which should depend on the global force field. Also, BLS04 found that correlates well with the bar ellipticity parameter measured by Whyte et al. (2002). is a bar strength indicator that is sensitive to the mass of the bar, and as such should be a better measure of bar strength than bar ellipticity. However, is affected also by spiral arm torques which can dominate over the torques due to weak bars. Thus, alone cannot tell us the actual distribution of bar strengths, but only the distribution for stronger bars.
One way to derive the distribution of real bar strengths is to remove the spiral contribution to . Buta, Block, and Knapen (2003=BBK03) developed a Fourier-based method of separating bars from spirals that utilizes a symmetry assumption (section 3). Block et al. (2004) applied this method to deep near-IR images of 17 bright galaxies to derive true bar strengths and spiral strengths . This analysis detected a possible correlation between and in the sense that among bars having 0.3, spiral strength increases with increasing bar strength. Block et al. suggested that the apparent correlation implies that for stronger bars, the bar and the spiral grow together and have the same pattern speed.
Our goal with the present paper is to apply the BBK03 method to nearly 150 spiral galaxies in the OSUBGS, a database of -band (1.65m) images that have enough depth of exposure to allow reliable Fourier analyses. In the -band, the extinction is only 19% that in the -band (Cardelli, Clayton, & Mathis 1989), and such images are suitable for the derivation of gravitational potentials using fast-Fourier transform techniques (Quillen, Frogel, and González 1994; Salo et al. 1999; Laurikainen & Salo 2002). From the separated images, we derive the distributions of bar and spiral strengths and investigate what these tell us about disk galaxies. We also further investigate the correlation between and .
2 Galaxy Sample
Our sample consists of 147 bright galaxies drawn from the same sample as used by BLS04, Laurikainen, Salo, and Buta (2004a=LSB04), and Laurikainen et al. (2004b=LSBV04). These previous studies used 180 galaxies, including 158 OSUBGS galaxies having total magnitudes 12.0, 6.′5, 0 9, inclination 65∘, and 80∘ +50∘. In addition, this sample included 22 galaxies from the Two Micron All-Sky Survey (2MASS, Skrutskie et al. 1997) which satisfy similar criteria as the OSUBGS but are larger than the 6.′5 diameter limit. However, the 2MASS images are sufficiently underexposed that they proved inadequate for bar/spiral separation. Whereas bars are detected fairly well in such images, the spirals and background disks are often too faint to characterize reliably, and we do not use these images further in this paper.
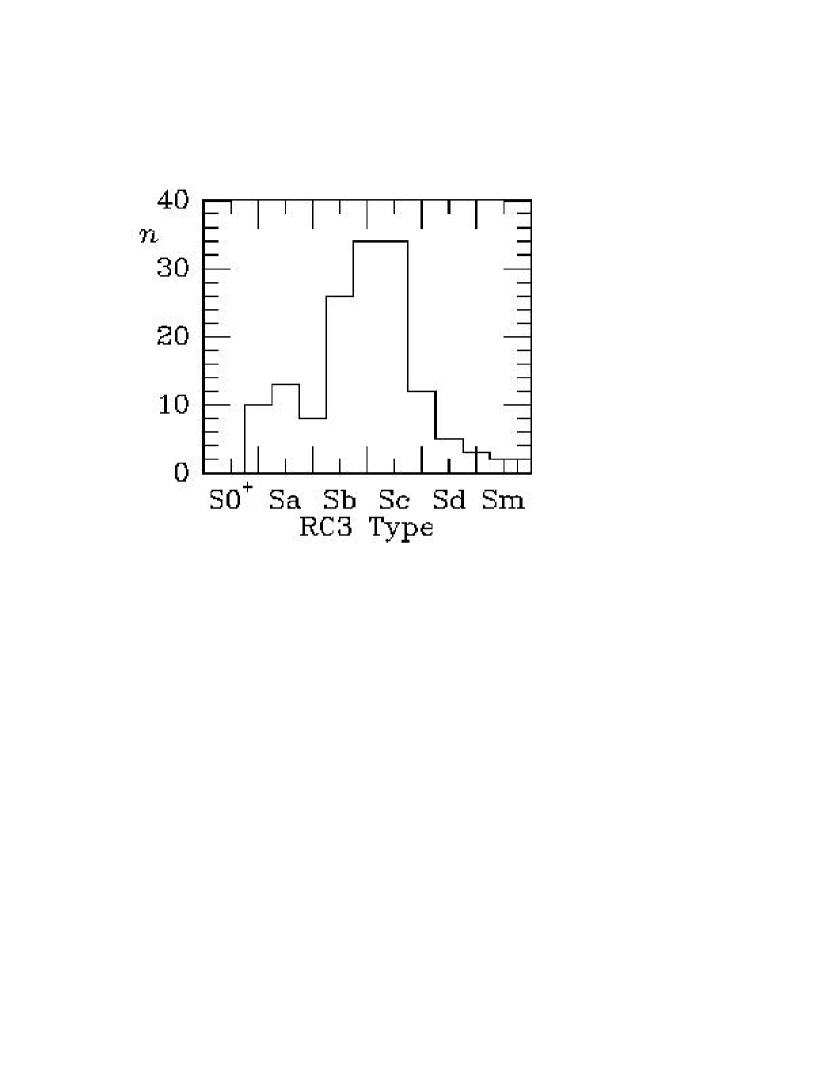
Figure 1 shows that our subset of 147 OSUBGS galaxies is dominated mainly by Sbc and Sc galaxies. The base OSU sample is typical of the bright galaxy population, as shown by Eskridge et al. (2002) and Whyte et al. (2002). BLS04 and LSB04 showed that their OSUBGS/2MASS sample is biased mainly against inclusion of very late-type, low luminosity barred spirals and low surface brightness galaxies. Our subset of 147 galaxies has a similar bias.
3 The BBK03 Technique
The bar/spiral separation method of BBK03 depends on a simple assumption concerning the behavior of the relative Fourier intensity amplitudes as a function of radius in a bar: the relative intensities decline past a maximum in the same or a similar manner as they rose to that maximum. This is known as the symmetry assumption. In a complicated bar and spiral system, only the rising portion of the symmetric curve is seen, as in BBK03’s example of NGC 6951, and the symmetry assumption allows the extrapolation of the bar into the spiral region. The assumption is justified from studies of barred galaxies lacking strong spiral structure. BBK03 used the study of 6 barred galaxies from Ohta et al. (1990) and the case of NGC 4394 from the OSUBGS to justify the assumption. The assumption has found further support in studies of SB0 and SB0/a galaxies from the Near-Infrared S0 Survey (Buta et al. 2005; see Buta 2004 for a preliminary summary of these results). In these cases, the bars in the near-infrared are observed against only bulge and disk components, so that the bar is the only significant nonaxisymmetric contribution. Since we cannot know apriori the form of any particular bar, we judge the effectiveness of a given bar/spiral separation by examining bar plus disk and spiral plus disk intensity maps (see BBK03). If the bar length is underestimated or overestimated, we can detect the failure as positive or negative residuals in the spiral plus disk image.
4 Application of the BBK03 technique to the OSUBGS Sample
The application of the BBK03 technique to the OSUBGS sample required a number of modifications. First, the method was developed using deep images with pixel sizes of 0.′′24 (Block et al. 2004). In contrast, the OSUBGS -band images have pixel sizes ranging from 1.′′11 to 1.′′50 and are noisier at large radii than the images used by Block et al. (2004). These two factors complicate separation, but the pixel size problem could be handled effectively by resampling the images into pixels one-quarter as large using IRAF routine IMLINTRAN.
In our analysis of the OSUBGS sample, we encountered a greater range of complications in the relative Fourier intensity curves, such as multiple bars and the effects of decomposition errors on central isophotes. Thus, it was necessary to adapt the BBK03 method to deal with the new complications. The effects of decomposition errors were particularly serious. For all separations, we used deprojected images based on bulge/disk/bar decompositions from LSBV04. In each case, the bulge was assumed to be spherical, but in those cases where the assumption may be wrong, the decomposition led to symmetric regions of lower intensity on each side of the center where too much bulge light was subtracted. In about a dozen cases, the problem was sufficiently serious that bar/spiral separation could not be carried out. In most cases, the problem could be treated in a two-step separation process, which also proved very effective for cases with multiple bars or ovals.
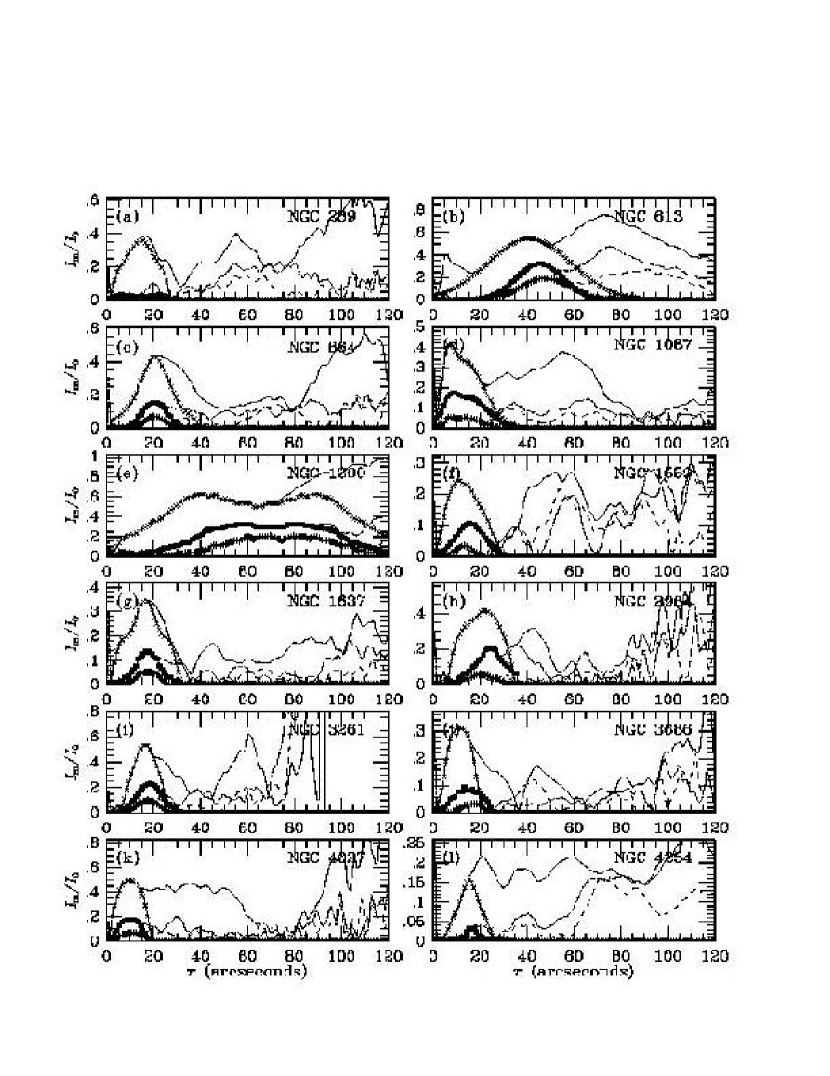
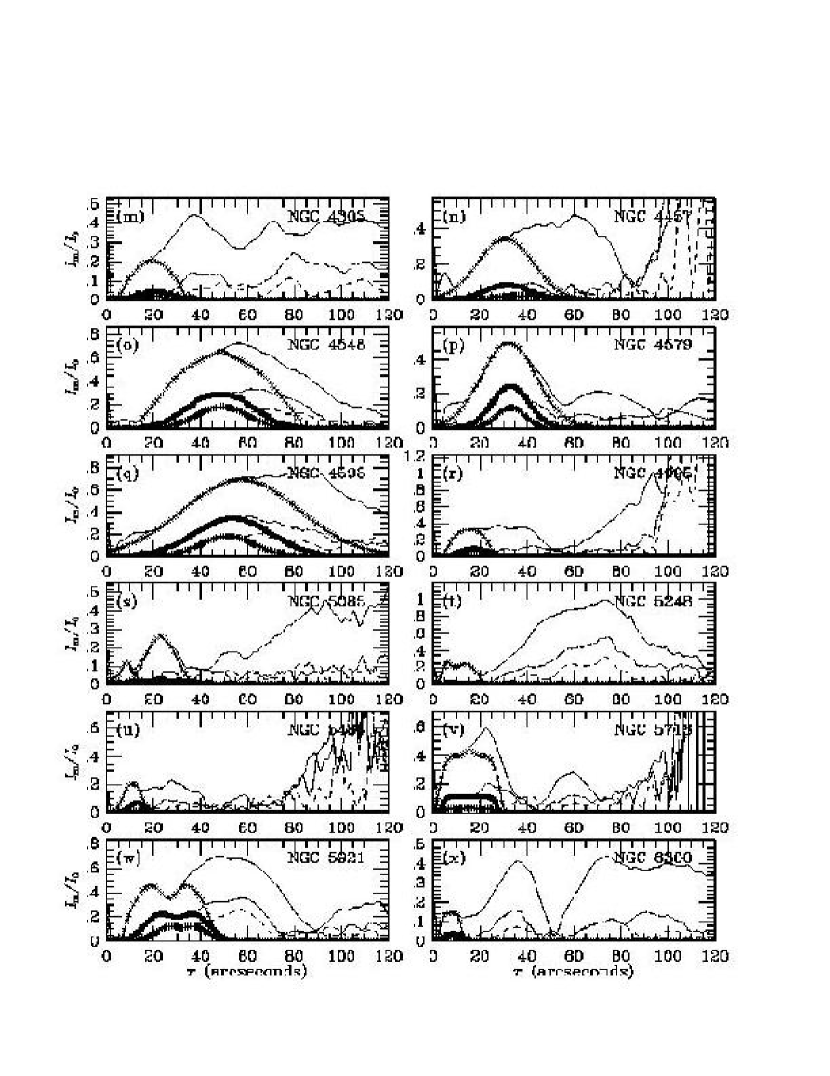
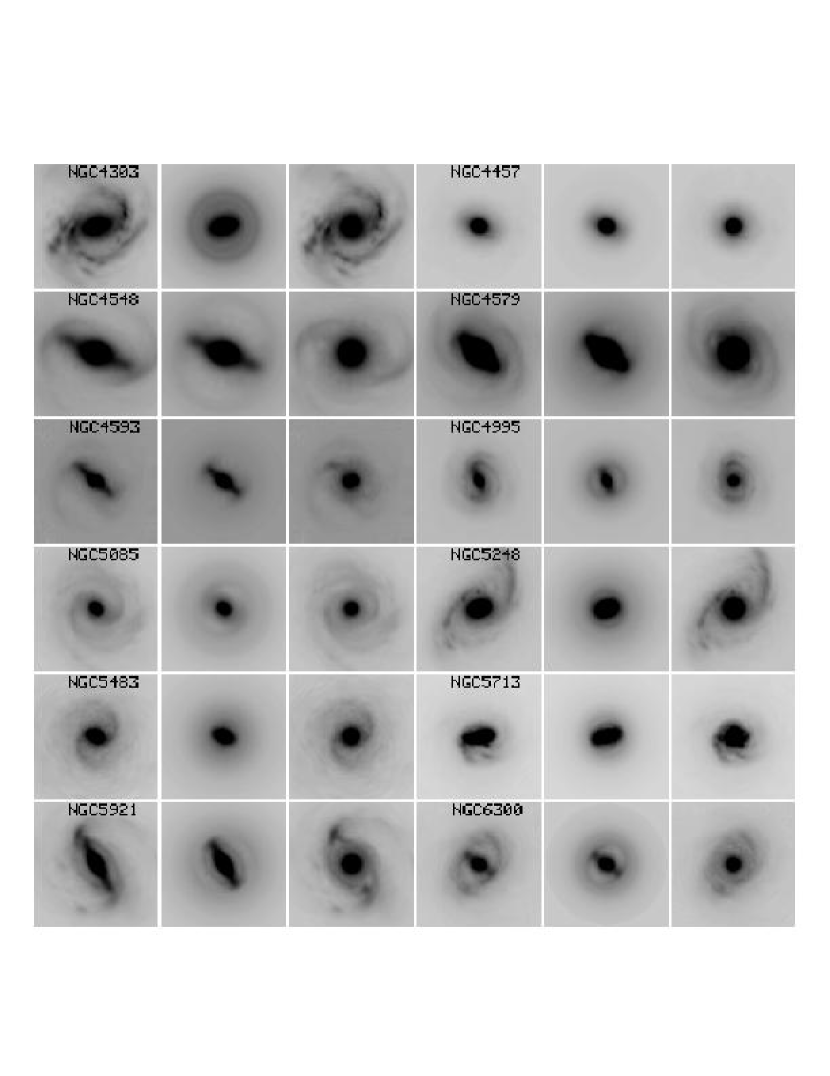
Figure 2 shows the lower-order Fourier representations used to separate the bars and spirals in 24 OSUBGS galaxies. These objects illustrate well the types of extrapolations needed to deal with the wide range of bar types found in the sample. While for many (e.g., NGC 289, 864, 1637, 3261, 3686, 4027, 4254, 4303, 4548, 4995, 5085, 5483, 5921, and 6300) the symmetry assumption appears to work well, for others (e.g., NGC 613, 1087, 4457, 4579, 4593, and the higher order terms for NGC 3261 and 4548) we found it effective to fit a single gaussian to the rising relative intensities (or even a double gaussian, as in NGC 1087). We also followed the procedure of BBK03 to extrapolate the bars as little as possible, so that if the observed relative Fourier amplitudes due to the bar could be detected beyond the maximum, as much as possible of the decline is used as observed. Two cases shown in Figure 2 are NGC 1559 and NGC 2964.
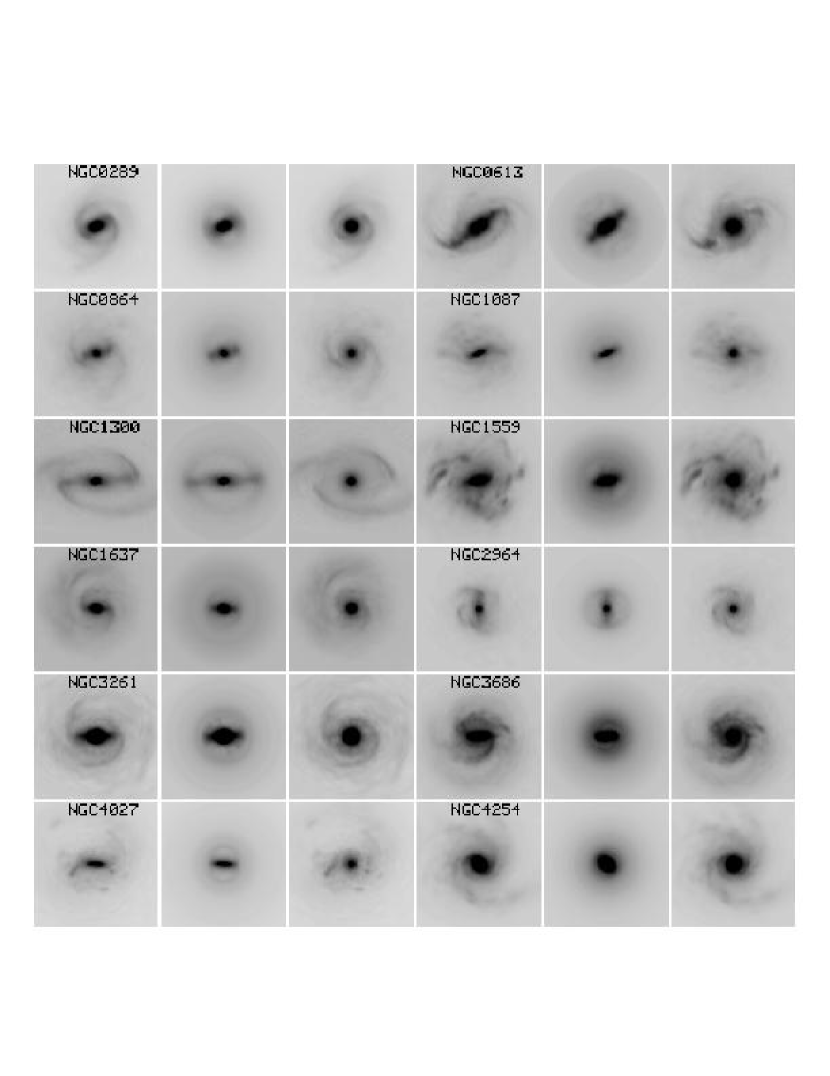
It is likely that some bar profiles are indeed gaussian in nature, although the physical implication of such a representation is not explored here. Some profiles are symmetric but not necessarily gaussian (e.g., NGC 1637) or are clearly asymmetric (as in NGC 1087, 1559, and 2964). The effectiveness of the separations of the 24 galaxies are shown in Figure 3. In general, very good separations are possible by the BBK03 procedure. The partly gaussian-fitted bar representation for NGC 4548 has cleanly removed the bar with little residual bar light remaining. In NGC 4579, gaussian fits to all the main bar Fourier terms allows the inner part of the spiral to be more clearly seen. The complex bar in NGC 1087, represented by two non-coincident gaussians, is well-separated from the complex spiral which itself appears to be affected by considerable star formation. This bar does not follow the symmetry assumption, except for the individual gaussian components.
In many of the bar images, ring-like structures, sometimes slightly oval and sometimes weakly spiral, are seen. These rings in large part represent the axisymmetric component of the associated spirals. Also, some failure of the bar extrapolations can cause these weak structures. In the spiral images also, one often sees a filling in of the inner part of the pattern. This is due to the axisymmetric part of the bar. Maximum relative gravitational torques must be calculated against the total axisymmetric background, including whatever contributions the spirals and bars themselves make to this background.
BBK03 noted that in some bars where the spiral is weak or absent, the maxima of the higher order bar terms shift towards larger radii (e.g., Ohta et al. 1990). These shifts are sometimes seen in our bar representations, but in many cases there is little or no shift detectable. Also, Figure 1 shows that our bar representation for NGC 4593 has fitted peaks in =4 and 6 at smaller radii than for =2.
The symmetry assumption leads to double-humped bar profiles in the strong bars of NGC 1300 and NGC 5921. In both of these cases, the bar image includes a weak elongated ring pattern that contributes little to the torques. In both cases also, the spiral plus disk image looks reasonably bar-free, but a slight asymmetry in the bar leaves a small residual bar spot on the lower right end of the bar in NGC 5921.
Separation was especially effective for inner ovals. Small ovals in NGC 4254, 5085, 5247, 5248, and 5483 were easily mapped and removed with just a few terms. In the case of NGC 5085, we used the symmetry assumption twice, one for the inner oval and one for an outer oval (Figure 2s). The bar mapping for NGC 5248 shows a double-humped profile that could in principle be represented as a double-gaussian. In a few cases (e.g., NGC 613, 4457, 4579, 4593), the separation successfully removed the primary bar but left a small oval in the center. These ovals tend to be weak compared to the primary bar, and were sometimes left in the spiral plus disk image. In other cases, a two-step process could be used to remove them from the spiral plus disk image, if necessary.
5 Quantitative Bar and Spiral Strengths
We were able to carry out reasonably successful bar/spiral separations for 147 OSUBGS galaxies. The 33 missing objects from the LSBV04 sample include the original 22 2MASS galaxies in their sample and 11 other cases where the decompositions left complex residual structure in the bulge region that prevented a reliable Fourier extrapolation of the bar light.
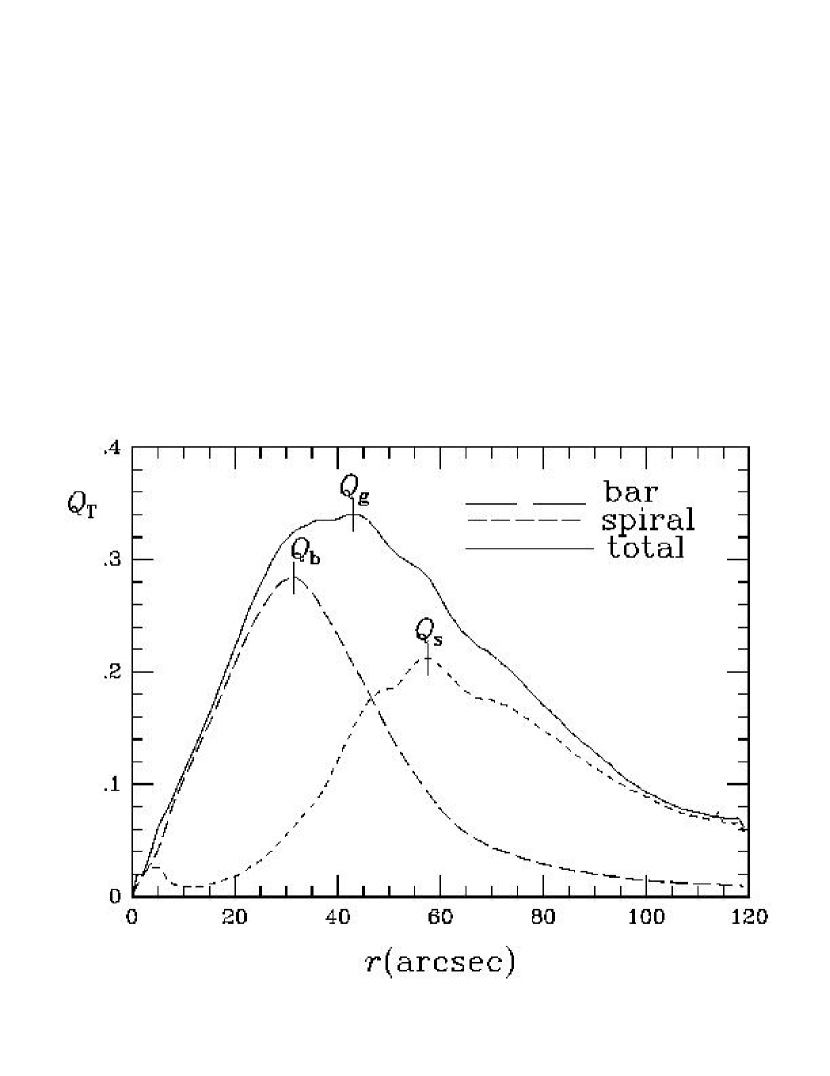
For the 147 separated galaxies, we computed bar and spiral strengths following LSBV04. Gravitational potentials are inferred from the bar and spiral images assuming a constant mass-to-light ratio. The potentials are derived from Poisson’s equation using a fast-Fourier transform technique. A polar grid approach is used to minimize the effects of noise at large radii (e.g., Laurikainen and Salo 2002). Vertical thickness is taken into account using an exponential density function having a scaleheight scaled from the radial scalelength using a type-dependent formulation (de Grijs 1998). For each image, the radial variation, , of the maximum tangential force relative to the mean background radial force is computed. Then the maximum ratio from the bar image defines and the radius and the maximum ratio from the spiral image defines and . Figure 4 shows a schematic of these definitions, based on NGC 6951 (from BBK03). Since bar/spiral separation uses mainly even Fourier terms for the bar, the procedure leaves the odd Fourier terms and much of the image noise in the spiral plus disk image. Thus, it was necessary to inspect the plots for the spirals to eliminate spurious maxima due to noise at large radii.
The BBK03 definition of , shown in Figure 4, differs slightly from that actually used in BLS04, LSB04, and LSBV04, where was taken to be the maximum in the bar/oval region when such features were present, and the general maximum for mostly non-barred spirals. In general, the differences between the formal defined by BBK03 and that used in the previously cited papers will not be large, but were necessitated by the higher noise level in the OSUBGS images compared to those used by BBK03 and Block et al. (2004).
Table 1 lists the derived parameters for the 147 galaxies. The typical uncertainties in maximum relative gravitational torques are discussed by BBK03, BLS04, and LSBV04. In the present paper, we note that the uncertainty in the constant mass-to-light ratio assumption, as well as the effects of disk truncation, will likely affect and differently, because can significantly exceed , as shown for many cases in Table 1. In BLS04, we showed that the typical dark halo correction to is about 5% for the galaxies that define the OSUBGS sample, based on a “universal rotation curve” analysis (Persic, Salucci, & Stel 1996). Since will generally be intermediate between and , we expect the dark halo contribution affects more than . To minimize the effects of disk truncation, we chose a maximum radius (RADMAX) for all calculations of 127 pixels, which is the maximum circle contained in each image. RADMAX is the radius of the zone for which and from which forces are calculated. Laurikainen & Salo (2002) showed that as long as RADMAX/ 2, disk truncation should not significantly affect the force ratio. In almost all cases, satisfies this condition, but may or may not satisfy it. Thus, our derived values cannot be taken as definitive, but as indicative of the approximate spiral strength. Some values are also affected by star formation, and in general is probably overestimated on average in our analysis.
6 Bar/Spiral Strength Correlations
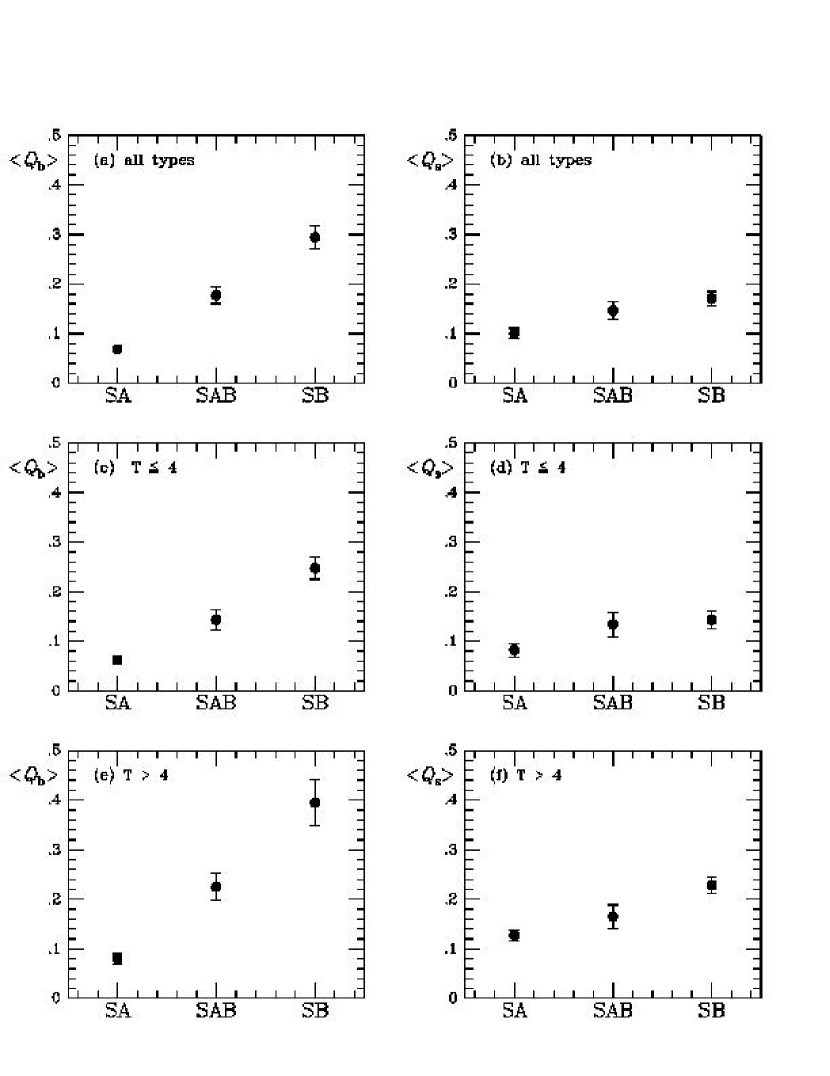
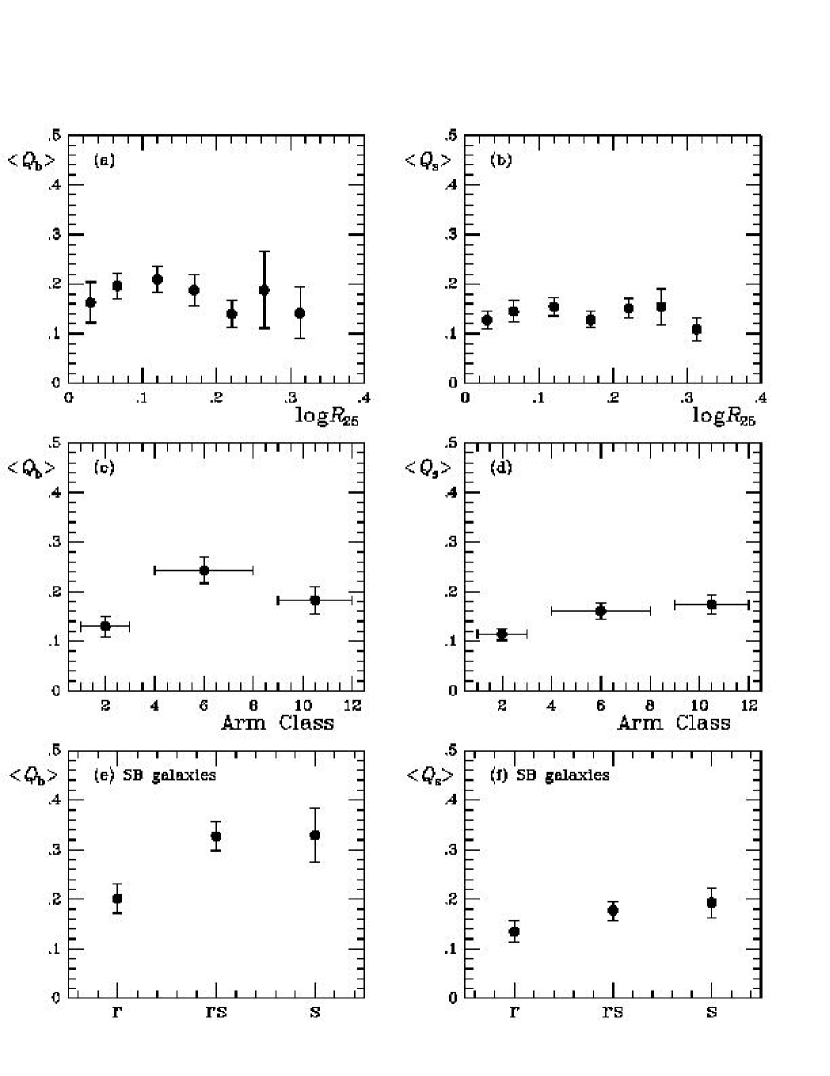
We examine correlations between our measured and values and other parameters. Figure 5 shows plots of and versus RC3 family classification. Figure 5a shows a virtually linear correlation between and RC3 family over all types, verifying that the intermediate de Vaucouleurs family class SAB is justified (see also Block et al. 2001). This is the case even when the sample is divided into types (Figure 5c) and (Figure 5e). The right panels of Figure 5 show only weaker correlations of with bar family. In all three panels, is higher for SB galaxies than for SA galaxies. Table 2 summarizes the mean values displayed.
Table 1 also lists the “OSU ” and “OSU ” family classifications from Eskridge et al. (2002), based on visual inspection of the OSUBGS -band and -band images. Eskridge et al. noted that many galaxies classified as non-barred or weakly barred in RC3 appear more strongly barred in the near-IR. We have computed a “ family” to compare with these estimates (see Table 3). We define an SA galaxy to be one which has 0.05, while an SB galaxy is defined to have 0.25. Between these extremes we define classes SB, SAB, and SA using the notation of de Vaucouleurs (1963), designed to illustrate the continuity aspect of bar strength. The different families do not involve equal steps in : the SB category involves a much broader range of bar strengths than does SA, and we give a broader range to SAB compared to SB and SA. Comparison between the family and the OSU family shows the two often disagree. Many OSU SB galaxies end up as family SAB because the bars are really not that strong. Table 4 summarizes 6 galaxies from Eskridge et al. (2000) noted to have changed classification from SA to SB in going from the to the band. However, the family indicates the bars are still weak, even in the near-IR. Some disagreements occur for cases where the spiral comes off the ends of the bar with a large pitch angle, an example being NGC 1042. In this case, there is an oval that we have interpreted as all or some of the bar for bar/spiral separation.
In other cases, the family gives an SAB or SA family for cases which are clearly SB in blue light. Some notable examples are NGC 4643, 5101, and 5701, all early-type spirals. In these cases, the bars are simply not as strong as they appear to be because of the presence of a strong bulge component, which contributes significantly to the axisymmetric background.
Table 5 summarizes a general comparison between the family and the other sources of bar family classification, including the classification of LSBV04 whereby a “Fourier bar” is defined to be one where the phases of the main =2 and =4 Fourier components are maintained nearly constant in the bar region. The most striking aspect of the RC3 comparison is the number of objects classified as SA in RC3 which have a family of SB, meaning some bar or oval was detected in the near-IR. A similar comparison is found for the OSU classifications, which is not surprising since RC3 families are also based on -band images. The comparison with the OSU classifications shows that, as highlighted before, many OSU SB galaxies have bars that are not that strong, and come out with a family of SAB. The Fourier bar comparison gives very similar results but requires mainly that the low order Fourier phases be constant, not that the bar should be especially strong.
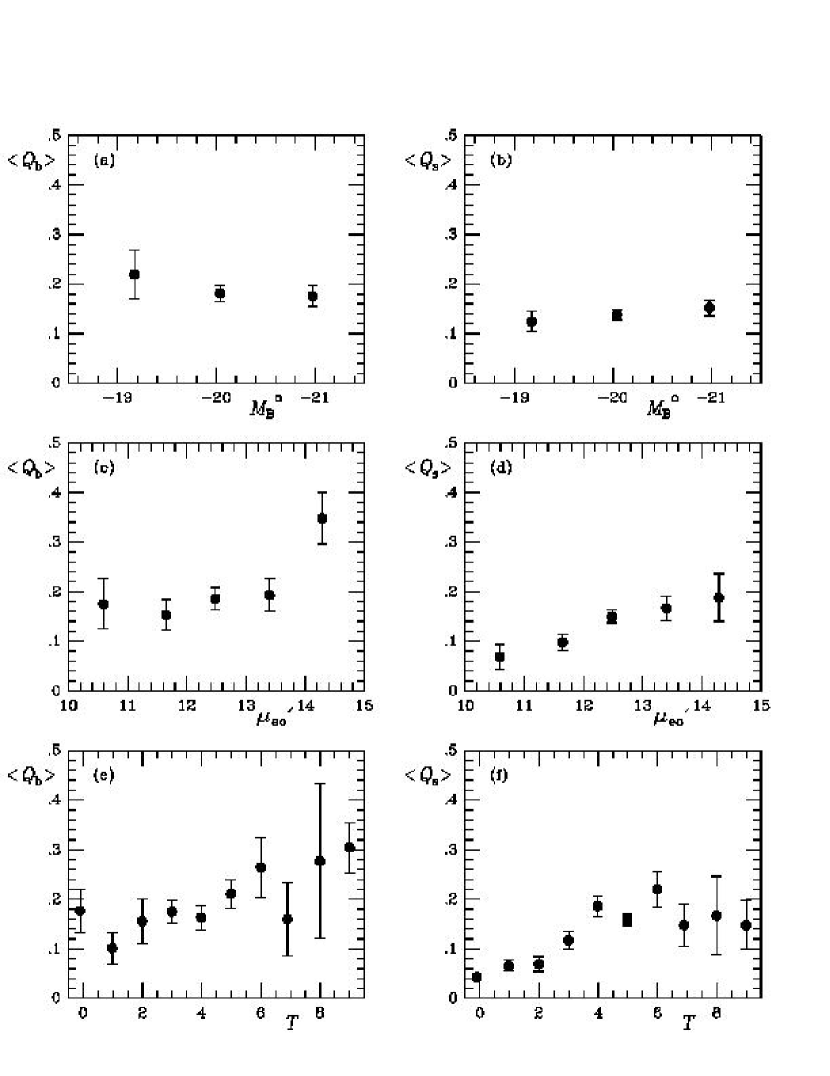
Figure 6 shows plots of and versus: (a,b) the extinction- and tilt-corrected absolute blue magnitude based on parameters from RC3 and distances from Tully (1988); (c,d) the extinction and tilt-corrected mean effective blue light surface brightness (mag arcmin-2; see equation 71 of RC3); and (e,f) de Vaucouleurs revised Hubble-Sandage type, coded on the RC3 numerical scale. Little correlation with absolute magnitude is found, although this is partly due to the fact that the sample is biased against late-type, low luminosity barred spirals (BLS04). Except for the lowest surface brightness bin, there is little correlation between and , while some correlation between and is found. The mean spiral strength appears to increase with increasingly fainter surface brightness, changing by more than a factor of two, an effect that may be partly due to star formation and partly due to increased image noise for the lower surface brightness objects. Figure 6e shows the same kind of correlation between and type discussed by BLS04 and LSB04 for , in the sense that maximum relative gravitational torques are larger for later types. Figure 6f shows the same may be true for spiral strengths as well.
BLS04 and LSB04 attributed the type dependence in as due to the increased prominence of the bulge in early-type spirals. This rather counterintuitive result, that significant-looking bars in early-types actually have weaker relative torques than those in later types, is due to the fact that what the eye recognizes in photographs as a “bar strength”’ is the LOCAL SURFACE DENSITY contrast, which is different from the tangential to radial force ratio or its maximum value . The latter is a global quantity, measuring FORCES from all parts of the galaxy, and should be a more reliable indicator of actual bar strength. This highlights the advantage of the GTM in quantifying bar strength beyond the visual appearance of bars (LSB04). Early-type bars may in fact be more massive and intrinsically stronger than those in later types, but relative to the axisymmetric disks they are imbedded within, late-type bars can be stronger.
Figure 7 shows correlations between and and , the RC3 logarithmic standard isophotal axis ratio (used as an indicator of inclination), and visually estimated Arm Class (Elmegreen and Elmegreen 1987). Arm Classes (ACs) emphasize the symmetry and continuity of spiral arms, and it is worth investigating whether these might correlate with . No significant trend of either nonaxisymmetric strength parameter is found with , confirming that there is no systematic bias introduced to the torques due to deprojection corrections. However, we detect a weak correlation between and AC in the sense that is higher for ACs of 9 and 12 (there are no ACs of types 10 and 11), which include the most symmetric, longest arms, compared to ACs of 1–3, which include the chaotic, fragmented arms seen in flocculent spirals. In spite of the apparent correlation, is not necessarily a suitable replacement for the AC because there is considerable overlap among the classes and the two parameters measure different aspects of spiral structure.
Finally, Figures 7e,f show and for SB galaxies as functions of RC3 variety classification: ringed (r), pseuodringed (rs), and spiral-shaped (s). With our direct estimates of bar strength, we can investigate the claim made by Kormendy & Kennicutt (2004) that SB(r) galaxies have stronger bars than SB(s) galaxies, based on the hydrodynamic simulations of Sanders & Tubbs (1980). Table 2 summarizes and for the three varieties separated by family. Figure 7e shows that, on average, SB(r) galaxies have weaker bars than SB(s) galaxies, contrary to the conclusion of Kormendy & Kennicutt. In our sample also, SB(rs) galaxies have bars as strong on average as those in SB galaxies. The differences are not that significant owing to the large scatter at each variety. Table 2 shows that the statistics are more uncertain for SA galaxies, which strongly emphasize the (s)-variety, and SAB galaxies, which strongly emphasize the (rs) variety.
7 Distribution of Bar and Spiral Arm Strengths
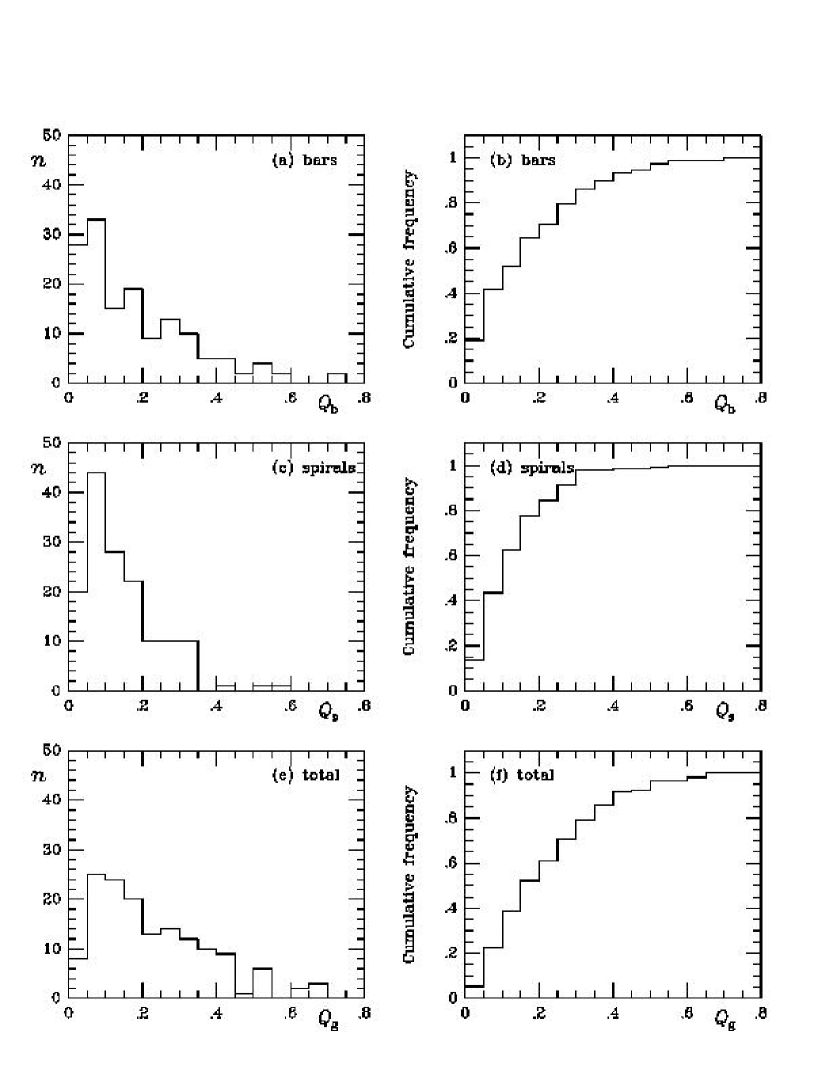
Figures 8a and b show both differential and cumulative distributions of , while Figures 8c and d show the same for , for 147 OSUBGS galaxies. For comparison, the distributions of values (from LSBV04) for the same galaxies are shown in Figures 8e and f. Figures 8a and b show that when bars are isolated from spirals in galaxy images, the lowest bar strength bins, 0.0-0.05 and 0.05-0.10, fill up considerably over the bins. More than 40% of the galaxies have bars with 0.10, while only 22% have 0.10. It is clear that weak bars or ovals are often masked by spirals and not detected via the parameter; these bars are visible in profiles but have force maxima much lower than those induced by spiral arms in the outer parts of the disks. Thus, does not give a reliable indication of the relative frequency of weak bars.
For the spirals, the lowest bin is deficient in galaxies compared to the next highest bin, which is not unexpected given that the sample excludes S0 galaxies. Most spirals are nevertheless fairly weak, with more than 75% having 0.20.
These parameters allow us to assign all the sample galaxies to bar and spiral strength classes (see Table 1). We follow Buta & Block (2001) to make these assignments. For bar class 0 we include any galaxy having 0.05, while for spiral class 0 we include any galaxy having 0.05. For bar class 1 we include galaxies having 0.05 0.15, while for spiral class 1 we include galaxies having 0.05 0.15, etc. Thus, the 0 class for bars and spirals involves a narrower range since and cannot be negative as defined. These spiral and bar classes define a quantitative near-infrared classification of bars and spirals and can be incorporated into the dust-penetrated classification scheme of Block & Puerari (1999; see Buta & Block 2001). While bar class may represent a suitable replacement for de Vaucouleurs family classifications, spiral class only distinguishes early and late-type spirals and does not discriminate well between individual -types (Figure 6f).
8 Correlation Between and
Elmegreen & Elmegreen (1985) used bar/interbar and arm/interarm contrasts to show that strong spirals are associated with strong bars. Although the bulk of their correlation is based on only a few galaxies, the implication was that the bars might be driving the spirals. However, Sellwood & Sparke (1988) used numerical simulations to show that bars and spirals might be independent features, with different pattern speeds. Block et al. (2004) applied the BBK03 technique to 17 intermediate to late-type spirals and found some correlation between bar and spiral arm torques, but only for the strongest bars. These authors suggested that in strongly-barred galaxies, the bar and the spiral may be growing together and have the same pattern speed.
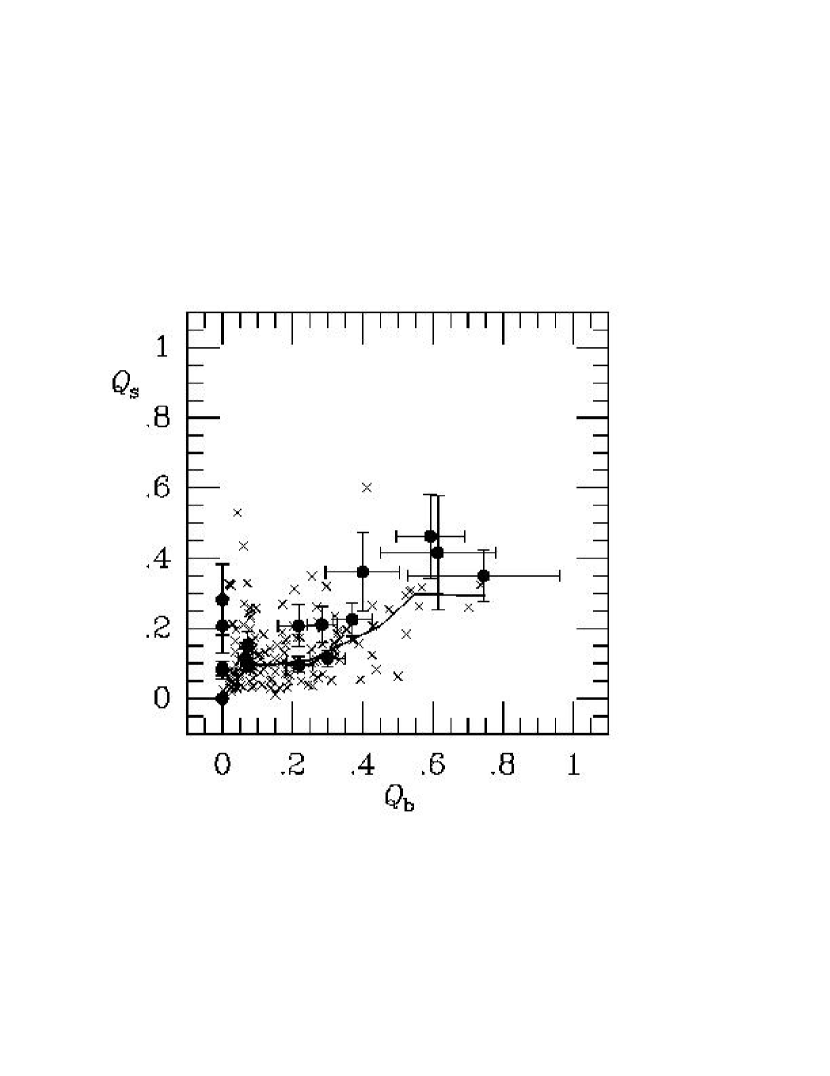
Figure 9 shows the correlation between and (crosses) for the OSUBGS sample. For comparison, the values from Block et al. (2004) for 17 bright spirals are plotted also. The solid curve shows the medians in for successive bins of 0.1 in . The plot shows that the median increases from 0.1 to 0.30 as increases from 0.05 to 0.75. The rise agrees with that found by Block et al. (2004) within the uncertainties, and again suggests that at lower bar strengths, spiral and bar strengths are largely uncorrelated, while at stronger bar strengths some correlation may be present. The result is difficult to interpret because the numbers of galaxies decrease significantly with increasing . Also, and have correlated uncertainties, in the sense that if is overestimated by the separation procedure, then will be underestimated and vice versa. These uncertainties could be reduced with better quality images as used by Block et al. (2004). Our results largely support the idea of Sellwood & Sparke (1988) that spirals and bars are independent features, with likely different pattern speeds, at least for 0.3. This is not definitive, however, because as noted by Block et al. (2004), the frequent alignment of bars and rings, which are often parts of the spiral pattern, implies similar pattern speeds in some cases. For higher bar strengths, some correlation between and may be present that can only be confirmed with a larger sample of strongly barred spirals.
9 Discussion
9.1 What Determines Bar Strength?
Bar strength in isolated disk galaxies is thought to be determined largely by the effectiveness with which a bar can transfer angular momentum to other galactic components, such as spiral structure, resonances, live halos, and outer bulge stars (Athanassoula 2003). A bar can get very strong if there is nothing to negate this effect. However, a bar can affect its own evolution by driving gas into the center. This builds up the central mass concentration and can lead to an inner Lindblad resonance (ILR), which will feed angular momentum to the bar. When this happens, the bar’s orbital structure can be destroyed and the bar itself fades away (Norman, Sellwood, & Hasan 1996).
Bar strength in non-isolated galaxies can be affected by tidal interactions (Noguchi 1996; Miwa & Noguchi 1998 and also accretion of gas-rich dwarfs or infalling external gas (Sellwood & Moore 1999; Bournaud & Combes 2002; Combes 2004). Miwa and Noguchi (1998) have argued that which bar-forming mechanism (spontaneous or tidal) dominates depends on the relative importance of the disk and halo. They suggest that spontaneous bars will be important if disks are massive relative to their halo, while tidally-induced bars will dominate if the disks are stable against spontaneous bar formation. Noguchi (1987) suggested that the “exponential” and “flat” bars of Elmegreen & Elmegreen (1985) are distinguished by these same two mechanisms, with the former being spontaneous and the latter being tidally triggered. If gas flow helps to dissolve a bar, an interaction may regenerate a bar if there is little disk gas remaining (Berentzen et al. 2004). If a galaxy accretes substantial external gas, it may be susceptible to multiple or recurring bar episodes (Bournaud & Combes 2002, 2004). Several simulation studies (Athanassoula 2003; Athanassoula & Misiriotis 2002; Miwa & Noguchi 1998; Berentzen et al. 2004) have found a correlation between bar strength and bar pattern speed, in the sense that stronger bars have lower pattern speeds.
These results suggest that bar strength is not a permanent feature of galaxies, but can be highly variable over a Hubble time. Evidence in support of this idea comes from the inverse correlation between central mass concentration and bar ellipticity in a sample of spiral galaxies (Das et al. 2003). Thus, the distribution of bar strengths in galaxies may be influenced by a complex variety of effects: environment, mass distribution, the interstellar medium, and the properties of dark matter halos.
9.2 The Distribution of Bar Strengths: Observations versus Theory
We have shown in this paper that a straightforward Fourier technique can be used to separate bars from spirals, allowing us to examine the distribution of bar strengths in galaxies unaffected by the torques due to spirals. We find a preponderance of low bar strengths that was masked in previous studies partly because of the effects of spiral arm torques. is only reliable as a bar strength indicator if the bar is the dominant nonaxisymmetric feature in a galactic disk. In cases where the spiral dominates, or where the bar and spiral have comparable strengths, will be an overestimate of bar strength.
The reason for wanting to look at the distribution of bar strengths alone is Sellwood’s (2000) assertion that “most real bars are not made by the bar instability.” This global dynamical instability was first identified in -body models that showed that a disk-shaped galaxy having sufficient kinetic energy in ordered rotational motion would be unstable to the formation of a bar (Sellwood 1996 and references therein). The way to avoid the linear instability would be a high central concentration, guaranteeing the existence of an ILR inside the bar. Sellwood (2000) noted that many strong bars, such as those found in galaxies like NGC 1300 and 1433, include small circumnuclear rings whose presence has been tied to the existence of an ILR region (although the exact locations of the rings may not be coincident with ILR; Regan and Teuben 2003). Sellwood noted that enough barred galaxies showed these features to cast considerable doubt on the bar instability as being the explanation of most bars. Other features of the strong bars that suggest the influence of ILRs are the shapes of offset dust lanes (Athanassoula 1992) and observed gas velocity fields.
Sellwood also brought attention to the results of early high redshift studies (e.g., Abraham et al. 1999) that indicated bars are less frequent for 0.5, suggesting that bars develop long after the disk formed. However, this conclusion has been refuted by more recent studies (Sheth et al. 2003; Elmegreen, Elmegreen, & Hirst 2004; Jogee et al. 2004), which indicate no significant drop in the bar fraction out to 1. Jogee et al. (2004) present the most comprehensive study of bar fraction as a function of redshift, and found that this fraction is virtually constant at 30%6% to =1. The implications of their result are thought to be that cold, unstable disks were already in place by =1, and that bars must survive at least 2 Gyr.
In looking for an alternative to the bar instability, Sellwood (2000) suggested bar growth occurs through an episodic process, where the interaction between a bar and a spiral can add particles to the bar and make it longer, while at the same time reducing the bar’s pattern speed. He suggested that it would be useful to be able to predict the distribution of bar strengths for various bar formation scenarios. Of course, it is also useful to know the observed distribution of bar strengths. The BBK03 method and the OSUBGS have allowed us to consider this for the first time.
The only theoretical predictions of an expected distribution of bar strengths have been made for recurrent bar formation models (Bournaud & Combes 2002). Block et al. (2002) used a preliminary analysis of the OSUBGS sample to derive an observed distribution, and then used the Bournaud & Combes simulation database to derive a theoretical distribution using as much as possible the same assumptions: constant mass-to-light ratio; exponential vertical density distribution having ; inclusion of spiral torques; bulges assumed as flat as the disks; and dark matter ignored. These authors noted that the observed distribution shows a deficiency of low galaxies and an extended “tail” of high galaxies. The comparison showed that both characteristics were best explained if galaxies are open systems, accreting enough external gas to double their mass in a Hubble time. The distribution of bar strengths would then mainly tell us the relative amount of time galaxies spend in different bar states (strong, weak, or non-barred). The deficiency of low galaxies was interpreted as due to the “duty cycle” between bar episodes. That is, accretion prevented most galaxies from spending much time in a perfectly axisymmetric state. Some of the nonaxisymmetric torques could be due to spirals which would also be maintained by accretion.
The refined GTM analysis carried out by BLS04, LSB04, and LSBV04 provided a more reliable distribution of . BLS04 showed that even with refinements that account properly for bulge shapes, and using improved estimates of that allow for the type dependence of as well as values of derived from two-dimensional bar/bulge/disk decompositions, the observed distribution of still shows a deficiency of objects having 0.05 and an extended tail of high objects. However, the refined distribution shows more low values than did the Block et al. (2002) analysis, due to a variety of effects discussed by BLS04.
We find that when spiral torques are removed, the distribution of bar strengths is a relatively smoothly declining function with increasing . It appears that galaxies spend more time in a relatively weakly-barred or non-barred state than they do in a strongly-barred state. Even in these weakly-barred states, they can have significant spiral torques. The question now is whether gas accretion models can account for the actual distribution of bar strengths rather than simply the distribution of total nonaxisymmetry strengths. In principle, a separation analysis could be made for simulations as for images.
Whyte et al. (2002) analyzed the blue and near-infrared images in the OSUBGS, and derived a quantitative bar strength parameter, , which is a rescaled measure of bar ellipticity (Abraham & Merrifield 2000). For the large and well-defined OSUBGS sample, they derived a distribution of which they claim shows evidence for bimodality, and argue that the bimodality is likely due to rapid evolution from the SB phase to SA and SAB phases. However, the distribution of suggests a continuous distribution of bar strengths, with no evidence of bimodality. The two results are not really in disagreement because the evidence for bimodality in is very weak, especially in the plot of versus concentration shown by Whyte et al. (2002). The original evidence was found in this same kind of plot by Abraham & Merrifield (2000). In agreement with our results, Whyte et al. (2002) found that SAB galaxies have values of intermediate between SA and SB galaxies.
10 Conclusions
Using a simple Fourier technique, we have separated the bars and spirals in 147 OSUBGS galaxies, and for the first time derived the distribution of actual bar strengths in disk galaxies. We find that the relative frequency of bars is a declining function of bar strength, with more than 40% of the sample being very weakly-barred or non-barred with 0.1. The higher frequency of weak bars compared to strong ones suggests that strong bars are either very transient or may require more special conditions, such as an interaction. If, in fact, bars are long-lived, as suggested by the results of high redshift studies (e.g., Jogee et al. 2004), then the observed distribution of bar strengths is telling us that cold, unstable disks preferentially form weak bars.
An important piece of the whole picture of barred galaxies is still missing: SB0 galaxies. Block et al. (2002) suggested that in the absence of gas, bars are very robust and can last a Hubble time. What is the distribution of bar strengths in such galaxies? Our SB0 survey (Buta et al. 2005; Buta 2004) should be able to answer this question.
We thank an anonymous referee for helpful comments on the manuscript. RB and SV acknowledge the support of NSF Grant AST-0205143 to the University of Alabama. EL and HS acknowledge the support of the Academy of Finland, and EL also from the Magnus Ehrnrooth Foundation. SV acknowledges the support of the Academy of Finland during two summer visits to Oulu in 2002 and 2003. Funding for the OSU Bright Galaxy Survey was provided by grants from the National Science Foundation (grants AST-9217716 and AST-9617006), with additional funding from the Ohio State University.
REFERENCES
Abraham, R. G. & Merrifield, M. R. 2000, AJ, 120, 2835
Abraham, R. G., Merrifield, M. R., Ellis, R. S., Tanvir, N. R., & Brinchmann, J. 1999, MNRAS, 308, 569
Aguerri, J. A. L. 1999, A&A, 351, 43
Aguerri, J. A. L., Beckman, J. E., & Prieto, M. 1998, AJ, 116, 2136
Aguerri, J. A. L., Debattista, V., and Corsini, E. M. 2003, MNRAS, 338, 465
Athanassoula, E. 1992, MNRAS, 259, 328
Athanassoula, E. 2003, MNRAS, 341, 1179
Athanassoula, E. & Misiriotis, A. 2002, MNRAS, 330, 35
Berentzen, I., Athanassoula, E., Heller, C. H., & Fricke, K.J. 2004, MNRAS, 347, 220
Block, D. L. & Puerari, I. 1999, A&A, 342, 627
Block, D. L., Puerari, I., Knapen, J. H., Elmegreen, B. G., Buta, R., Stedman, S., & Elmegreen, D. M. 2001, A&A, 375, 761
Block, D. L., Bournaud, F., Combes, F., Puerari, I., & Buta, R. 2002, A&A, 394, L35
Block, D. L., Buta, R., Knapen, J. H., Elmegreen, D. M., Elmegreen, B. G., & Puerari, I. 2004, AJ, 128, 183
Bournaud, F. & Combes, F., 2002 A&A, 392, 83
Bournaud, F. & Combes, F., 2004, in SF2A-2004, Semaine de l’Astrophysique, F. Combes, D. Barret, T. Contini, F. Meynadier, & L. Pagani, eds., Ed-P Sciences, Conference series
Buta, R. 2004, in Penetrating Bars Through Masks of Cosmic Dust, The Hubble Tuning Fork Strikes a New Note, D. L. Block, I. Puerari, K. C. Freeman, R. Groess, & E. K. Block, eds., Springer, Dordrecht, 101
Buta, R. & Block, D. L. 2001, ApJ, 550, 243
Buta, R., Block, D. L., & Knapen, J. H. 2003, AJ, 126, 1148 (BBK03)
Buta, R., Laurikainen, E., & Salo, H. 2004, AJ, 127, 279 (BLS04)
Buta, R., Laurikainen, E., Salo, H., Block, D. L., & Knapen, J. H. 2005, in preparation
Cardelli, J. A., Clayton, G. C., & Mathis, J. S. 1989, ApJ, 345, 245
Chapelon, S., Contini, T., & Davoust, E. 1999, A&A, 345, 81
Combes, F. 2004, in Penetrating Bars Through Masks of Cosmic Dust, The Hubble Tuning Fork Strikes a New Note, D. L. Block, I. Puerari, K. C. Freeman, R. Groess, & E. K. Block, eds., Springer, Dordrecht, 57
Corsini, E. M., et al. 2004, IAU Symp. 220, S. Ryder, D. J. Pisano, M. A. Walker, & K. C. Freeman, eds., p. 271
Corsini, E. M., Debattista, V., & Aguerri, J. A. L. 2003, ApJ, 599, 29
Das, M, et al. 2003, ApJ, 582, 190
Debattista, V., Corsini, E. M., and Aguerri, J. A. L. 2002, MNRAS, 332, 65
Debattista, V. and Williams, T. 2004, ApJ, 605, 714
de Grijs, R. 1998, MNRAS, 299, 595
de Vaucouleurs, G. 1959, Handbuch der Physik, 53, 275
de Vaucouleurs, G. 1963, ApJS, 8, 31
de Vaucouleurs, G. et al. 1991, Third Reference Catalog of Bright Galaxies (New York: Springer) (RC3)
Elmegreen, B. G. & Elmegreen, D. M. 1985, ApJ, 288, 438
Elmegreen, B. G., Elmegreen, D. M., & Hirst, A. C. 2004, ApJ, 612, 191
Elmegreen, B. G., Elmegreen, D. M., Chromey, F. R., Hasselbacher, D. A., & Bissell, B. A. 1996, AJ, 111, 2233
Elmegreen, D. M. & Elmegreen, B. G. 1987, ApJ, 314, 3
Eskridge, P., Frogel, J. A., Pogge, R. W., et al. 2000, AJ, 119, 536
Eskridge, P., Frogel, J. A., Pogge, R. W., et al. 2002, ApJS, 143, 73
Firmani, C. & Avila-Reese, V. 2003, RMxAC, 17, 107
Gerssen, J., Kuijken, K., and Merrifield, M. R. 1999, MNRAS, 306, 926
Hubble, E. 1926, ApJ, 64, 321
Jogee, S. et al. 2004, ApJ, 615, L105
Knapen, J., Pérez-Ramírez, D. & Laine, S. 2002, MNRAS, 337, 808
Kormendy, J. and Kennicutt, R. 2004, ARAA, 42, 603
Laurikainen, E., Salo, H., & Buta, R. 2004a, ApJ, 607, 103 (LSB04)
Laurikainen, E., Salo, H., & Rautiainen, P. 2002, MNRAS, 331, 880
Laurikainen, E. & Salo, H. 2002, MNRAS, 337, 1118
Laurikainen, E., Salo, H., Buta, R., & Vasylyev, S. 2004b, MNRAS, 355, 1251 (LSBV04)
Martin, P. 1995, AJ, 109, 2428
Martinet, L. & Friedli, D. 1997, A&A, 323, 363
Merrifield, M. R. & Kuijken, K. 1995, MNRAS, 274, 933
Miwa, T. and Noguchi, M. 1998, ApJ, 499, 149
Noguchi, M. 1987, MNRAS, 228, 635
Noguchi, M. 1996, in Barred Galaxies, IAU Coll. No. 157, R. Buta, D. Crocker, and B. G. Elmegreen, eds., ASP Conf. Ser. 91, p. 339
Norman, C., Sellwood, J. A., & Hasan, H. 1996, ApJ, 462, 114
Ohta, K., Hamabe, M., & Wakamatsu, K. 1990, ApJ, 357, 71
Persic, M., Salucci, P., & Stel, F. 1996, MNRAS, 281, 27
Pfenniger, D. & Norman, C. A. 1990, ApJ, 363, 391
Quillen, A. C., Frogel, J. A., & González, R. A. 1994, ApJ, 437, 162
Quillen, A. C., Frogel, J. A., Kenney, J. D., Pogge, R. W., & Depoy, D. L., 1995, ApJ, 441, 549
Regan, M. & Elmegreen, D. M. 1997, AJ, 114, 965
Regan, M. & Teuben, P. 2003, ApJ, 582, 723
Rozas, M., Knapen, J. H., & Beckman, J. E. 1998, MNRAS, 301, 631
Salo, H., Rautiainen, P., Buta, R., Purcell, G. B., Cobb, M. L., Crock er, D. A., & Laurikainen, E. 1999, AJ, 117, 792
Sandage, A. R. 1961, The Hubble Atlas of Galaxies, Carnegie Inst. of Wash. Publ. No. 618
Sandage, A. & Bedke, J. S. 1994, The Carnegie Atlas of Galaxies, Carnegie Inst. of Wash. Publ. No. 638
Sanders, R. H. & Tubbs, A. D. 1980, ApJ, 235, 803
Seigar, M. S. & James, P. S. 1998, MNRAS, 299, 672
Sellwood, J. 1996, in Barred Galaxies, IAU Coll. No. 157, R. Buta, D. Crocker, and B. G. Elmegreen, eds., ASP Conf. Ser. 91, p. 259
Sellwood, J. A. 2000, in Dynamics of Galaxies: From the Early Universe to the Present, F. Combes, G. A. Mamon, & V. Charmandaris, eds., San Francisco, ASP Conf. Ser. 197, p. 3.
Sellwood, J. A. & Moore, E. M. 1999, ApJ, 510, 125
Sellwood, J. A. & Sparke, L. S. 1988, MNRAS, 231, 25P
Sheth, K., Regan, M. W., Scoville, N. Z., & Strubbe, L. E. 2003, ApJ, 592, 13
Shlosman, I., Peletier, R. F., & Knapen, J. H. 2000, ApJ, 535, L83
Skrutskie, M. F. et al. 1997, in The Impact of Large-Scale Near-IR Surveys, F. Grazon et al., eds., Dordrecht, Kluwer, p.25
Tully, R. B. 1988, Nearby Galaxies Catalogue, Cambridge, Cambridge University Press
Whyte, L., Abraham, R. G., Merrifield, M. R., Eskridge, P. B., Frogel, J. A., & Pogge, R. W. 2002, MNRAS, 336, 1281
Wozniak, H., Friedli, D., Martinet, L., Martin, P., & Bratschi, P. 1995, A&AS, 111, 115
| Galaxy | RC3 | OSU | OSU | bar | spiral | |||||
|---|---|---|---|---|---|---|---|---|---|---|
| family | family | family | (arcsec) | (arcsec) | class | class | family | |||
| 1 | 2 | 3 | 4 | 5 | 6 | 7 | 8 | 9 | 10 | 11 |
| NGC 150 | SB | SAB | SB | 0.475 | 0.254 | 23 | 33 | 5 | 3 | SB |
| NGC 157 | SAB | SB | SA | 0.024 | 0.323 | 3 | 21 | 0 | 3 | SA |
| NGC 210 | SAB | SA | SB | 0.052 | 0.037 | 29 | 63 | 1 | 0 | SB |
| NGC 278 | SAB | SA | SA | 0.046 | 0.064 | 5 | 19 | 0 | 1 | SA |
| NGC 289 | SB | SB | SB | 0.212 | 0.089 | 11 | 49 | 2 | 1 | SA |
| NGC 428 | SAB | SAB | SB | 0.254 | 0.100 | 19 | 50 | 3 | 1 | SB |
| NGC 488 | SA | SA | SA | 0.028 | 0.020 | 11 | 40 | 0 | 0 | SA |
| NGC 578 | SAB | SAB | SB | 0.180 | 0.168 | 9 | 37 | 2 | 2 | SAB |
| NGC 613 | SB | SB | SB | 0.298 | 0.319 | 39 | 65 | 3 | 3 | SB |
| NGC 685 | SAB | SB | SB | 0.389 | 0.157 | 9 | 23 | 4 | 2 | SB |
| NGC 864 | SAB | SAB | SB | 0.321 | 0.134 | 13 | 19 | 3 | 1 | SB |
| NGC 1042 | SAB | SAB | SAB | 0.044 | 0.530 | 5 | 21 | 0 | 5 | SA |
| NGC 1058 | SA | SA | SA | 0.129 | 0.097: | 15 | … | 1 | 1 | SAB |
| NGC 1073 | SB | SB | SB | 0.561 | 0.264 | 15 | 29 | 6 | 3 | SB |
| NGC 1084 | SA | SA | SA | 0.038 | 0.197 | 5 | 23 | 0 | 2 | SA |
| NGC 1087 | SAB | SB | SB | 0.428 | 0.265 | 5 | 25 | 4 | 3 | SB |
| NGC 1187 | SB | SB | SB | 0.117 | 0.183 | 17 | 31 | 1 | 2 | SAB |
| NGC 1241 | SB | SAB | SB | 0.181 | 0.153 | 11 | 19 | 2 | 2 | SAB |
| NGC 1300 | SB | SB | SB | 0.524 | 0.184 | 57 | 111 | 5 | 2 | SB |
| NGC 1302 | SB | SAB | SB | 0.061 | 0.033 | 17 | 89 | 1 | 0 | SB |
| NGC 1309 | SA | SA | SAB | 0.091 | 0.132 | 9 | 15 | 1 | 1 | SB |
| NGC 1317 | SAB | SB | SB | 0.085 | 0.031 | 35 | 83 | 1 | 0 | SB |
| NGC 1371 | SAB | SAB | SAB | 0.049 | 0.109 | 7 | 19 | 0 | 1 | SA |
| NGC 1385 | SB | SB | SB | 0.269 | 0.262 | 3 | 31 | 3 | 3 | SB |
| NGC 1493 | SB | SAB | SB | 0.319 | 0.159 | 9 | 19 | 3 | 2 | SB |
| NGC 1559 | SB | SB | SB | 0.328 | 0.185 | 5 | 45 | 3 | 2 | SB |
| NGC 1617 | SB | SA | SAB | 0.034 | 0.078 | 7 | 35 | 0 | 1 | SA |
| NGC 1637 | SAB | SA | SB | 0.193 | 0.066 | 11 | 17 | 2 | 1 | SAB |
| NGC 1703 | SB | SA | SAB | 0.073 | 0.097 | 9 | 23 | 1 | 1 | SB |
| NGC 1792 | SA | SA | SA | 0.060 | 0.150 | 5 | 31 | 1 | 2 | SB |
| NGC 1832 | SB | SAB | SB | 0.176 | 0.131 | 11 | 39 | 2 | 1 | SAB |
| NGC 2090 | SA | SAB | SA | 0.087 | 0.090 | 9 | 17 | 1 | 1 | SB |
| NGC 2139 | SAB | SB | SB | 0.356 | 0.198 | 3 | 21 | 4 | 2 | SB |
| NGC 2196 | SA | SA | SA | 0.069 | 0.094 | 7 | 107 | 1 | 1 | SB |
| NGC 2442 | SAB | SB | SB | 0.412 | 0.600: | 45 | 71 | 4 | 6 | SB |
| NGC 2559 | SB | SAB | SB | 0.334 | 0.169 | 25 | 43 | 3 | 2 | SB |
| NGC 2566 | SB | SB | SB | 0.270 | 0.220 | 45 | 79 | 3 | 2 | SB |
| NGC 2775 | SA | SA | SA | 0.037 | 0.043 | 11 | 33 | 0 | 0 | SA |
| NGC 2964 | SAB | SA | SAB | 0.270 | 0.110 | 13 | 24 | 3 | 1 | SB |
| NGC 3059 | SB | SB | SB | 0.533 | 0.305 | 8 | 113: | 5 | 3 | SB |
| NGC 3166 | SAB | SA | SB | 0.108 | 0.073 | 21 | 77 | 1 | 1 | SAB |
| NGC 3169 | SA | SA | SA | 0.089 | 0.036 | 11 | 113: | 1 | 0 | SB |
| NGC 3223 | SA | SA | SA | 0.025 | 0.047 | 7 | 81 | 0 | 0 | SA |
| NGC 3227 | SAB | SAB | SB | 0.151 | 0.078 | 21 | 43 | 2 | 1 | SAB |
| NGC 3261 | SB | SAB | SB | 0.166 | 0.100 | 15 | 30 | 2 | 1 | SAB |
| NGC 3275 | SB | SB | SB | 0.183 | 0.166 | 19 | 102 | 2 | 2 | SAB |
| NGC 3319 | SB | SB | SB | 0.537 | 0.309 | 9 | 75 | 5 | 3 | SB |
| NGC 3338 | SA | SAB | SAB | 0.049 | 0.076 | 5 | 33 | 0 | 1 | SA |
| NGC 3423 | SA | SA | SA | 0.037 | 0.163 | 7 | 63 | 0 | 2 | SA |
| NGC 3504 | SAB | SB | SB | 0.286 | 0.069 | 19 | 33 | 3 | 1 | SB |
| NGC 3507 | SB | SB | SB | 0.188 | 0.098 | 13 | 19 | 2 | 1 | SAB |
| NGC 3513 | SB | SB | SB | 0.521 | 0.293 | 13 | 47 | 5 | 3 | SB |
| NGC 3583 | SB | SAB | SB | 0.170 | 0.189 | 9 | 17 | 2 | 2 | SAB |
| NGC 3593 | SA | SA | SA | 0.151 | 0.010 | 7 | 60 | 2 | 0 | SAB |
| NGC 3596 | SAB | SA | SAB | 0.080 | 0.200 | 7 | 30 | 1 | 2 | SB |
| NGC 3646 | SI | SA | SAB | 0.081 | 0.260 | 5 | 42 | 1 | 3 | SB |
| NGC 3675 | SA | SAB | SB | 0.078 | 0.083 | 11 | 49 | 1 | 1 | SB |
| NGC 3681 | SAB | SAB | SB | 0.187 | 0.070 | 5 | 19 | 2 | 1 | SAB |
| NGC 3684 | SA | SAB | SAB | 0.086 | 0.163 | 3 | 113 | 1 | 2 | SB |
| NGC 3686 | SB | SAB | SB | 0.225 | 0.082 | 7 | 15 | 2 | 1 | SA |
| NGC 3726 | SAB | SAB | SB | 0.212 | 0.174 | 17 | 41 | 2 | 2 | SA |
| NGC 3810 | SA | SA | SAB | 0.049 | 0.110 | 7 | 11 | 0 | 1 | SA |
| NGC 3887 | SB | SAB | SB | 0.093 | 0.175 | 9 | 23 | 1 | 2 | SB |
| NGC 3893 | SAB | SA | SAB | 0.122 | 0.132 | 9 | 47 | 1 | 1 | SAB |
| NGC 3938 | SA | SA | SA | 0.022 | 0.052 | 11 | 37 | 0 | 1 | SA |
| NGC 3949 | SA | SAB | SAB | 0.171 | 0.269 | 3 | 17 | 2 | 3 | SAB |
| NGC 4027 | SB | SB | SB | 0.569 | 0.316 | 3 | 19 | 6 | 3 | SB |
| NGC 4030 | SA | SA | SA | 0.020 | 0.059 | 5 | 53 | 0 | 1 | SA |
| NGC 4051 | SAB | SB | SB | 0.097 | 0.257 | 23 | 45 | 1 | 3 | SB |
| NGC 4123 | SB | SB | SB | 0.331 | 0.195 | 21 | 31 | 3 | 2 | SB |
| NGC 4136 | SAB | SAB | SB | 0.150 | 0.114 | 7 | 17 | 2 | 1 | SAB |
| NGC 4138 | SA | S | S | 0.039 | 0.035 | 5 | 17 | 0 | 0 | SA |
| NGC 4145 | SAB | SAB | SB | 0.427 | 0.124 | 3 | 25 | 4 | 1 | SB |
| NGC 4151 | SAB | SB | SB | 0.114 | 0.039 | 43 | 87 | 1 | 0 | SAB |
| NGC 4212 | SA | SA | SAB | 0.060 | 0.210 | 5 | 19 | 1 | 2 | SB |
| NGC 4242 | SAB | SB | SB | 0.225 | 0.050 | 29 | 60 | 2 | 1 | SA |
| NGC 4254 | SA | SA | SAB | 0.098 | 0.101 | 9 | 51 | 1 | 1 | SB |
| NGC 4303 | SAB | SB | SB | 0.075 | 0.243 | 13 | 27 | 1 | 2 | SB |
| NGC 4314 | SB | SB | SB | 0.439 | 0.084 | 35 | 61 | 4 | 1 | SB |
| NGC 4394 | SB | SB | SB | 0.259 | 0.070 | 21 | 41 | 3 | 1 | SB |
| NGC 4414 | SA | SA | SA | 0.088 | 0.143 | 7 | 21 | 1 | 1 | SB |
| NGC 4450 | SA | SA | SB | 0.116 | 0.085 | 25 | 63 | 1 | 1 | SAB |
| NGC 4457 | SAB | SA | SB | 0.078 | 0.050 | 19 | 41 | 1 | 1 | SB |
| NGC 4487 | SAB | SAB | SB | 0.178 | 0.070 | 7 | 34 | 2 | 1 | SAB |
| NGC 4504 | SA | SA | SB | 0.075 | 0.138 | 7 | 23 | 1 | 1 | SB |
| NGC 4548 | SB | SB | SB | 0.285 | 0.155 | 33 | 51 | 3 | 2 | SB |
| NGC 4571 | SA | SA | SA | 0.022 | 0.080 | 3 | 30 | 0 | 1 | SA |
| NGC 4579 | SAB | SB | SB | 0.188 | 0.050 | 21 | 49 | 2 | 1 | SAB |
| NGC 4580 | SAB | SA | SA | 0.077 | 0.088 | 7 | 13 | 1 | 1 | SB |
| NGC 4593 | SB | SB | SB | 0.263 | 0.104 | 37 | 53 | 3 | 1 | SB |
| NGC 4618 | SB | SB | SB | 0.354 | 0.197 | 7 | 67 | 4 | 2 | SB |
| NGC 4643 | SB | SB | SB | 0.245 | 0.039 | 27 | 45 | 2 | 0 | SA |
| NGC 4647 | SAB | SB | SB | 0.108 | 0.112 | 7 | 57 | 1 | 1 | SAB |
| NGC 4651 | SA | SA | SAB | 0.061 | 0.095 | 7 | 13 | 1 | 1 | SB |
| NGC 4654 | SAB | SAB | SB | 0.136 | 0.144 | 5 | 45 | 1 | 1 | SAB |
| NGC 4665 | SB | SB | SB | 0.257 | 0.037 | 25 | 73 | 3 | 0 | SB |
| NGC 4689 | SA | SA | SA | 0.050 | 0.067 | 13 | 39 | 1 | 1 | SB |
| NGC 4691 | SB | SB | SB | 0.499 | 0.063 | 9 | 87 | 5 | 1 | SB |
| NGC 4698 | SA | SA | SA | 0.088 | 0.059 | 45 | 105 | 1 | 1 | SB |
| NGC 4699 | SAB | SB | SB | 0.138 | 0.030 | 9 | 19 | 1 | 0 | SAB |
| NGC 4772 | SA | SA | SB | 0.042 | 0.030 | 45 | 63 | 0 | 0 | SA |
| NGC 4775 | SA | SA | SA | 0.105 | 0.125 | 3 | 27 | 1 | 1 | SAB |
| NGC 4781 | SB | SAB | SB | 0.205 | 0.312 | 7 | 17 | 2 | 3 | SA |
| NGC 4900 | SB | SB | SB | 0.372 | 0.167 | 5 | 19 | 4 | 2 | SB |
| NGC 4902 | SB | SB | SB | 0.272 | 0.060 | 15 | 67 | 3 | 1 | SB |
| NGC 4930 | SB | SB | SB | 0.210 | 0.110 | 31 | 109 | 2 | 1 | SA |
| NGC 4939 | SA | SAB | SAB | 0.119 | 0.084 | 11 | 97 | 1 | 1 | SAB |
| NGC 4995 | SAB | SAB | SB | 0.203 | 0.207 | 11 | 19 | 2 | 2 | SA |
| NGC 5054 | SA | SA | SAB | 0.065 | 0.088 | 13 | 69 | 1 | 1 | SB |
| NGC 5085 | SA | SA | SAB | 0.155 | 0.109 | 19 | 43 | 2 | 1 | SAB |
| NGC 5101 | SB | SB | SB | 0.186 | 0.033 | 39 | 109 | 2 | 0 | SAB |
| NGC 5121 | SA | SA | SA | 0.024 | 0.030 | 25 | 57 | 0 | 0 | SA |
| NGC 5248 | SAB | SA | SA | 0.061 | 0.270 | 7 | 51 | 1 | 3 | SB |
| NGC 5247 | SA | SA | SA | 0.020 | 0.327 | 3 | 65 | 0 | 3 | SA |
| NGC 5334 | SB | SB | SB | 0.322 | 0.145 | 5 | 11 | 3 | 1 | SB |
| NGC 5427 | SA | SA | SA | 0.083 | 0.235 | 7 | 33 | 1 | 2 | SB |
| NGC 5483 | SA | SAB | SB | 0.174 | 0.109 | 7 | 19 | 2 | 1 | SAB |
| NGC 5643 | SAB | SAB | SB | 0.321 | 0.236 | 27 | 45 | 3 | 2 | SB |
| NGC 5676 | SA | SA | SAB | 0.087 | 0.080 | 11 | 23 | 1 | 1 | SB |
| NGC 5701 | SB | SB | SB | 0.139 | 0.053 | 27 | 105 | 1 | 1 | SAB |
| NGC 5713 | SAB | SAB | SB | 0.335 | 0.111 | 7 | 15 | 3 | 1 | SB |
| NGC 5850 | SB | SB | SB | 0.311 | 0.053 | 39 | 65 | 3 | 1 | SB |
| NGC 5921 | SB | SB | SB | 0.255 | 0.349 | 21 | 37 | 3 | 3 | SB |
| NGC 5962 | SA | SAB | SB | 0.141 | 0.055 | 9 | 15 | 1 | 1 | SAB |
| NGC 6215 | SA | SA | SAB | 0.079 | 0.230 | 3 | 24 | 1 | 2 | SB |
| NGC 6221 | SB | SAB | SB | 0.430 | 0.207 | 25 | 43 | 4 | 2 | SB |
| NGC 6300 | SB | SAB | SB | 0.222 | 0.175 | 29 | 63 | 2 | 2 | SA |
| NGC 6384 | SAB | SB | SB | 0.135 | 0.050 | 11 | 35 | 1 | 1 | SAB |
| NGC 6753 | SA | SA | SA | 0.029 | 0.032 | 5 | 15 | 0 | 0 | SA |
| NGC 6782 | SAB | SAB | SB | 0.163 | 0.030 | 21 | 44 | 2 | 0 | SAB |
| NGC 6902 | SA | SA | SB | 0.034 | 0.080 | 11 | 30 | 0 | 1 | SA |
| NGC 6907 | SB | SB | SB | 0.071 | 0.329 | 3 | 25 | 1 | 3 | SB |
| NGC 7083 | SA | SA | SA | 0.033 | 0.071 | 5 | 23 | 0 | 1 | SA |
| NGC 7217 | SA | SA | SA | 0.033 | 0.036 | 9 | 109 | 0 | 0 | SA |
| NGC 7205 | SA | SA | SAB | 0.048 | 0.061 | 7 | 55 | 0 | 1 | SA |
| NGC 7213 | SA | SA | SA | 0.004 | 0.024 | 11 | 93 | 0 | 0 | SA |
| NGC 7412 | SB | SAB | SAB | 0.060 | 0.434 | 11 | 45 | 1 | 4 | SB |
| NGC 7418 | SAB | SAB | SB | 0.158 | 0.153 | 11 | 35 | 2 | 2 | SAB |
| NGC 7479 | SB | SB | SB | 0.702 | 0.260 | 27 | 41 | 7 | 3 | SB |
| NGC 7552 | SB | SB | SB | 0.393 | 0.055 | 39 | 65 | 4 | 1 | SB |
| NGC 7713 | SB | SA | SA | 0.040 | 0.097 | 5 | 23 | 0 | 1 | SA |
| NGC 7723 | SB | SB | SB | 0.319 | 0.120 | 11 | 22 | 3 | 1 | SB |
| NGC 7727 | SAB | SAB | SA | 0.087 | 0.145 | 7 | 99 | 1 | 1 | SB |
| NGC 7741 | SB | SB | SB | 0.736 | 0.324 | 11 | 27 | 7 | 3 | SB |
| IC 4444 | SAB | SA | SB | 0.254 | 0.140 | 5 | 16 | 3 | 1 | SB |
| IC 5325 | SAB | SA | SAB | 0.030 | 0.213 | 5 | 11 | 0 | 2 | SA |
| ESO 138- 10 | SA | SA | SA | 0.038 | 0.134 | 7 | 67 | 0 | 1 | SA |
| RC3 | standard | mean | standard | mean | |||
|---|---|---|---|---|---|---|---|
| classification | deviation | error | deviation | error | |||
| Full sample | |||||||
| SA | 0.069 | 0.043 | 0.006 | 0.101 | 0.069 | 0.010 | 48 |
| SAB | 0.177 | 0.114 | 0.017 | 0.147 | 0.118 | 0.018 | 45 |
| SB | 0.294 | 0.166 | 0.023 | 0.171 | 0.100 | 0.014 | 53 |
| 4 | |||||||
| SA | 0.062 | 0.041 | 0.008 | 0.082 | 0.072 | 0.014 | 28 |
| SAB | 0.143 | 0.100 | 0.020 | 0.134 | 0.127 | 0.025 | 26 |
| SB | 0.247 | 0.131 | 0.022 | 0.143 | 0.101 | 0.017 | 36 |
| 4 | |||||||
| SA | 0.080 | 0.044 | 0.010 | 0.127 | 0.054 | 0.012 | 20 |
| SAB | 0.225 | 0.117 | 0.027 | 0.165 | 0.105 | 0.024 | 19 |
| SB | 0.395 | 0.191 | 0.046 | 0.228 | 0.069 | 0.017 | 17 |
| SA Galaxies | |||||||
| r | 0.047 | 0.037 | 0.012 | 0.066 | 0.058 | 0.019 | 9 |
| rs | 0.077 | 0.025 | 0.008 | 0.111 | 0.034 | 0.011 | 9 |
| s | 0.074 | 0.047 | 0.009 | 0.109 | 0.077 | 0.014 | 30 |
| SAB Galaxies | |||||||
| r | 0.199 | 0.094 | 0.033 | 0.092 | 0.056 | 0.020 | 8 |
| rs | 0.167 | 0.119 | 0.022 | 0.164 | 0.105 | 0.020 | 29 |
| s | 0.193 | 0.124 | 0.044 | 0.141 | 0.189 | 0.067 | 8 |
| SB Galaxies | |||||||
| r | 0.201 | 0.107 | 0.029 | 0.135 | 0.081 | 0.022 | 14 |
| rs | 0.327 | 0.139 | 0.029 | 0.177 | 0.093 | 0.019 | 23 |
| s | 0.329 | 0.215 | 0.054 | 0.193 | 0.119 | 0.030 | 16 |
| Family | Range |
|---|---|
| SA | 0.05 |
| SB | 0.05 0.10 |
| SAB | 0.10 0.20 |
| SA | 0.20 0.25 |
| SB | 0.25 |
| Name | RC3 Family | OSU Family | Family |
|---|---|---|---|
| NGC 3675 | SA | SB | SB |
| NGC 4450 | SA | SB | SAB |
| NGC 4504 | SA | SB | SB |
| NGC 5483 | SA | SB | SAB |
| NGC 5962 | SA | SB | SAB |
| NGC 6902 | SA | SB | SA |
| SA | SB | SAB | SA | SB | |
|---|---|---|---|---|---|
| RC3 SA | 21 | 18 | 9 | 0 | 0 |
| RC3 SAB | 5 | 9 | 16 | 3 | 12 |
| RC3 SB | 2 | 6 | 9 | 6 | 31 |
| OSU SA | 23 | 23 | 8 | 0 | 2 |
| OSU SAB | 3 | 6 | 16 | 5 | 9 |
| OSU SB | 1 | 4 | 10 | 4 | 32 |
| OSU SA | 20 | 12 | 3 | 0 | 1 |
| OSU SAB | 5 | 12 | 4 | 0 | 1 |
| OSU SB | 2 | 9 | 27 | 9 | 41 |
| without Fourier bar | 26 | 23 | 6 | 1 | 2 |
| with Fourier bar | 2 | 10 | 28 | 8 | 41 |