The 1 – 50 keV spectral and timing analysis of IGR J18027-2016: an eclipsing, high mass X-ray binary.
We report the association of the INTEGRAL source IGR J18027-2016 with the BeppoSAX source SAX J1802.7-2017. IGR J18027-2016 is seen to be a weak, persistent source by the IBIS/ISGRI instrument on board INTEGRAL with an average source count rate of 0.55 counts s-1 (6.1 mCrab) in the 20-40 keV band. Timing analysis performed on the ISGRI data identifies an orbital period of 4.5696 0.0009 days and gives an ephemeris of mid-eclipse as, = 52931.37 0.04 MJD. Re-analysis of archival BeppoSAX data has provided a mass function for the donor star, and a projected semimajor axis of lt-s. We conclude that the donor is an OB-supergiant with a mass of 18.8–29.3 M☉ and a radius of 15.0–23.4 R☉. Spectra obtained by XMM-Newton and ISGRI indicate a high hydrogen column density of NH = 6.8 1022 cm-2, which suggests intrinsic absorption. The source appears to be a high mass X-ray binary with the neutron star emitting X-rays through wind-fed accretion while in an eclipsing orbit around an OB-supergiant.
Key Words.:
X-rays: individuals: IGR J18027-2016, SAX J1802.7-2017 – X-rays: binaries – pulsars: general – Gamma-rays: observations1 Introduction
High mass X-ray binaries (HMXBs) were discovered as bright X-ray sources in the 1970s. The systems comprise a compact object orbiting a massive OB class star. The compact object can be either a neutron star or black hole and is a strong X-ray emitter via the accretion of matter from the OB companion. HMXBs can be split into two individual classes: (i) Be/X-ray binaries; (ii) Supergiant X-ray binaries (Corbet, 1986). The majority of HMXBs belong to the first class (80) (Kaper et al., 2004). In Be systems, the compact object is a neutron star and is typically in a wide, moderately eccentric orbit and spends little time in close proximity to the dense circumstellar disk surrounding the Be companion, (Negueruela & Coe, 2002; Liu et al., 2000). As a result, they are often X-ray transients as the accretion principally occurs when the compact object passes through the Be-star disk.
In the supergiant systems, the compact object is in orbit around an OB-supergiant. Accretion can be powered solely by the stellar wind from the supergiant and/or can be through Roche-lobe overflow. Accretion from the stellar wind results in an X-ray luminosity of 1035–1036 erg s-1. When the star fills its Roche lobe a much higher X-ray luminosity is achieved, 1038 erg s-1 (Kaper et al., 2004). The orbital periods of the supergiant systems are typically shorter (1.4 – 41.5 days) than the Be-star systems (12.7 – 262 days) and the orbits typically more circular.
HMXBs are young systems, and the compact object is often a highly magnetized neutron star. Hence, many systems are seen to host an X-ray pulsar. The spin period of the pulsar and the orbital period of the system correlate well allowing the differentiation between OB-supergiant and Be-star systems and between underfilled and filled Roche-lobe supergiant systems (Corbet, 1986).
Since its launch in 2002, INTEGRAL (the INTErnational Gamma-Ray Astrophysics Laboratory) has been performing a regular survey of the Galactic plane and a deep exposure of the Galactic Centre as part of its Core Programme (Winkler et al., 2003). In the course of these observations a number of new unidentified sources emitting in the soft -ray region have been discovered. The first IBIS/ISGRI soft -ray galactic plane survey catalogue (Bird et al., 2004) reports the discovery of 28 objects of unknown classification exhibiting persistent hard X-ray emission. One of the new unidentified sources observed in the first year of operations of INTEGRAL was IGR J18027-2016. This new source has been independently reported in both core programme GCDE (Galactic Centre Deep Exposure) observations (Bird et al., 2004) and guest observer data (Revnivtsev et al., 2004).
IGR J18027-2016 is spatially associated with a recently identified X-ray pulsar SAX J1802.7-2017 (Augello et al., 2003). Lutovinov et al. (2005) report that the 18–60 keV spectrum of IGR J18027-2016 can be described by a power law with an exponential cut-off at high energies of Ecut = 18 keV. We report here the results of the timing analysis of IGR J18027-2016 using INTEGRAL data, a re-analysis of archival BeppoSAX data, and the spectral analysis of XMM-Newton data.
2 Observations
2.1 BeppoSAX data
Augello et al. (2003), hereafter Au03, reported the discovery of the serendipitous source SAX J1802.7-2017, identified as an X-ray pulsar. This result was from BeppoSAX archival observations of the GX 9+1 field performed from September 16 2001 (02:01:30.0 UTC) to September 20 2001 (03:00:08.5 UTC). The position of SAX J1802.7-2017 was given as R.A. (2000.0) = 18h02m39.9s and Dec. = -20∘1713.5 with a positional uncertainty of 2. A pulse period of 139.612 s and an orbital period of 4.6 days was reported. Table 1 shows all of their measured system parameters. The total duration of the observation 4.0 days, was such that the data did not cover a complete orbit. As a result the measurement of the orbital period through the delays in pulse arrival times was assocated with a 9% error which contributed to other system parameters having errors of 30%. The possibility that this was an eclipsing system was also proposed.
| Parameter | Value |
|---|---|
| 0.04 | |
| 0.02 0.03 days-1 | |
| 0.50 | |
| 4.6 days | |
| 70 lt-s | |
| 52168.22 MJD | |
| 139.612 s | |
| 17 5 | |
| 0.64 0.14 rad | |
| 11 | |
| 14 |
2.2 INTEGRAL data
IGR J18027-2016 has been observed on multiple occasions during the core programme by the IBIS detector ISGRI [INTEGRAL Soft Gamma-Ray Imager, (Lebrun et al., 2003)]. IBIS generates images of the sky with 30∘ field of view in the energy range 15-1000 keV (Ubertini et al., 2003). IBIS observed IGR J18027-2016 over three epochs: 28 Feb. – 28 Apr. 2003; 27 Sep. – 12 Oct. 2003; 17 Feb. – 20 Apr. 2004. ISGRI images were generated for each selected pointing in 10 narrow energy bands with the ISDC Offline Scientific Analysis (OSA) software version 4.1. The individual images were combined to produce mosaics of the region in broader energy bands using the system described in Bird et al. (2004).
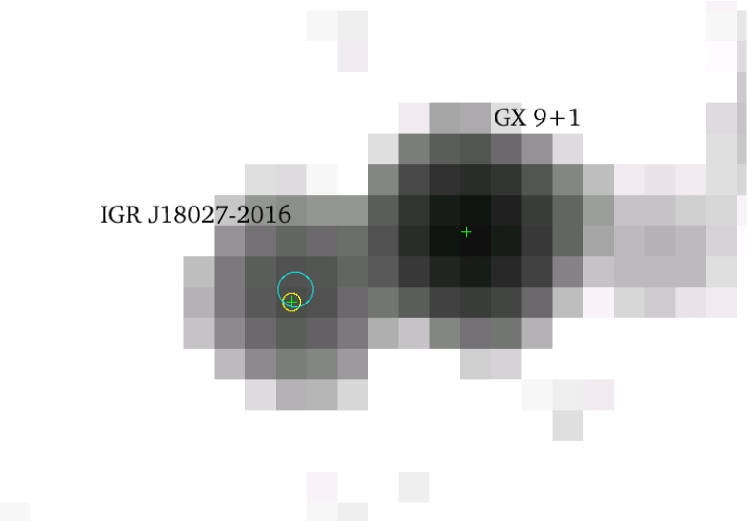
Fig. 1 shows the IBIS/ISGRI 20-40 keV image of the region around IGR J18027-2016. The atoll source, GX 9+1 is also clearly visible 22 from IGR J18027-2016. IGR J18027-2016 appears as a 30.5 detection in the 20-40 keV band at R.A. (2000.0) = 18h02m46.1s and Dec. = -20∘1737.1 with a positional uncertainty of 1 (Gros et al., 2003). This position is consistent with the reported position of SAX J1802.7-2017 (Au03). The source flux in the 20-40 keV energy band is F20-40keV = 0.58 0.02 counts sec-1 which corresponds to 6.4 mCrab.
2.3 XMM data
IGR J18027-2016 was observed by XMM-Newton for 12 ksec, from 06:54:40.0 – 09:44:38.0 UTC, 2004 April 06. A single X-ray source was found within the ISGRI error circle in the EPIC PN and MOS cameras (Strüder et al., 2001; Turner et al., 2001). The XMM Science Analysis System (SAS), software version 6.0, was used to extract light curves and spectra for IGR J18027-2016. Standard SAS tools were used to calculate the instrumental response and the effective area for the extracted spectra.
3 Temporal Analysis
3.1 ISGRI

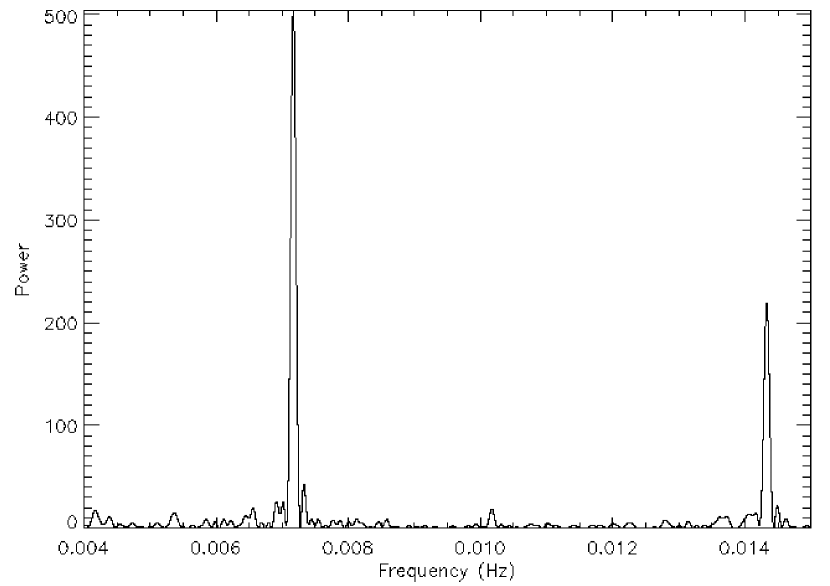
The flux of IGR J18027-2016 was extracted from each ISGRI pointing image to generate light curves in different energy bands, the rebinned 20–80 keV light curve spanning 417 days is seen in Fig. 2. The source is not especially strong above 40–50 keV and to minimize systematic effects we searched the 20–40 keV light curve for periodicities using the Lomb-Scargle periodogram method by means of the fast implementation of Press & Rybicki (1989). The resulting power spectrum is shown in Fig. 3. The peak power of 52.58 corresponds to a frequency of 0.2188 days-1. The error on the angular frequency (Horne & Baliunas, 1986) is:
| (1) |
where N2 is the variance of the noise, N is the number of data points, T is the total length of the data set and A is the amplitude of the signal given by:
| (2) |
where z0 is the Lomb-Scargle power and s2 is the variance of the light curve.
This frequency corresponds to a period of 4.570 0.003 days which is consistent with the orbital period indirectly measured by Au03.
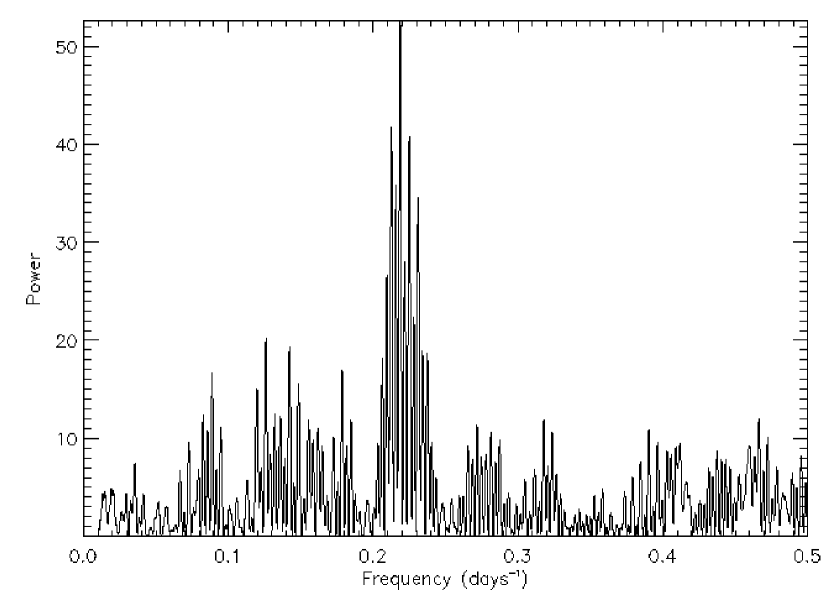
The significance of this peak was confirmed by applying a randomization test. The time stamps for each flux measurement were randomly reordered and the periodogram of the resulting light curve generated. We simulated 5000 light curves in this fashion. The mean maximum power found in the randomized data sets was 10.6 and highest power recorded was a single instance of 19.5. It is immediatley obvious that a peak of power 53 is extremely unlikely to occur by chance and hence our detection is highly significant.
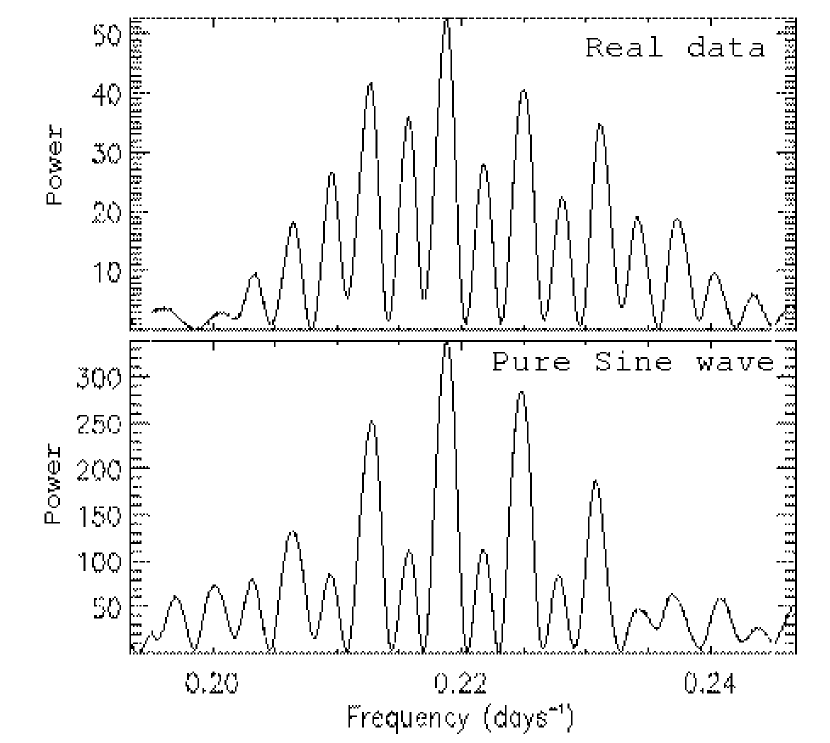
Upon close examination of the periodogram it can be seen that there is some aliasing around the frequency of the detected period. This raises the question of whether we have selected the correct peak and hence the correct frequency/period. The much higher power of our selected frequency is sufficient that we can be confident that this is the true frequency of the system. To investigate the orgin of the aliasing pattern a pure sine wave of our chosen frequency was sampled in an identical fashion to that of the original data set. The corresponding periodogram (Fig. 4) can be seen to exhibit broadly the same aliasing pattern as observed in the data. The peak of maximum power corresponds to the frequency of the input sine wave and the aliases are spaced in an identical fashion to that of the original data set. Also, as discussed in section 3.2, folding the ISGRI light curve on a period of 4.570 days indicates an eclipse of the system exactly when we would expect it to be observed. Hence, we are confident that the peak of maximum power in our data corresponds to the true frequency of the system.
3.2 BeppoSAX
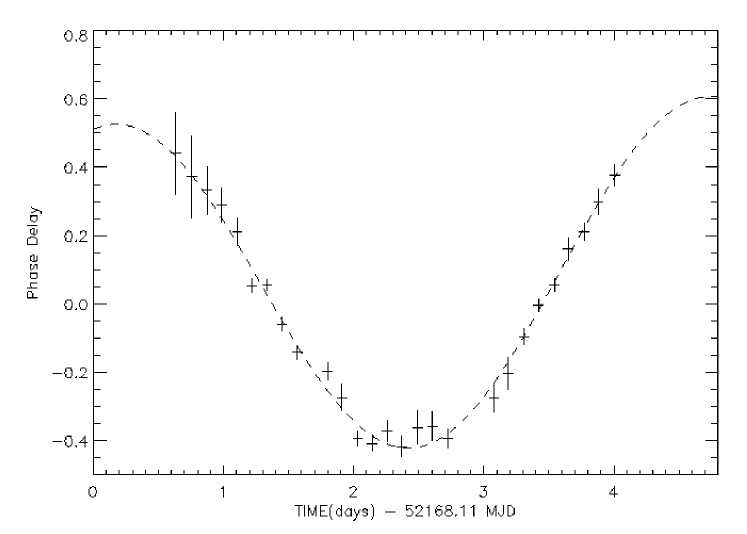
We used the orbital period as measured by ISGRI to re-analyse the BeppoSAX data presented by Au03. Originally, phase delays in the pulse period of the pulsar measured by SAX were fitted without any prior knowledge of the orbital period. We performed an identical analysis of the phase delays assuming an orbital period of 4.570 days.
The modulation of the phase delays can be explained by the propagation delays resulting from the orbital motion of the neutron star around its companion star. The phases were fit with
| (3) |
where is the arrival time of the nth pulse, is the epoch of NS superior conjunction of the NS, the linear term = and = 4.570 0.003 days. The of the fit was 1.3, the fit parameters are listed in Table 2 and the fit is shown in Fig. 5. As i = , then i 68 1 lt-s; 139.612 s (Au03). All of the fit parameters are consistent with those originally measured by Au03, however they are considerably better constrained due to the independent and precise measurement of by IBIS/ISGRI.
| Parameter | Value |
|---|---|
| 0.03 0.07 | |
| 0.02 0.03 days-1 | |
| 0.49 0.003 | |
| 52168.26 0.04 MJD |
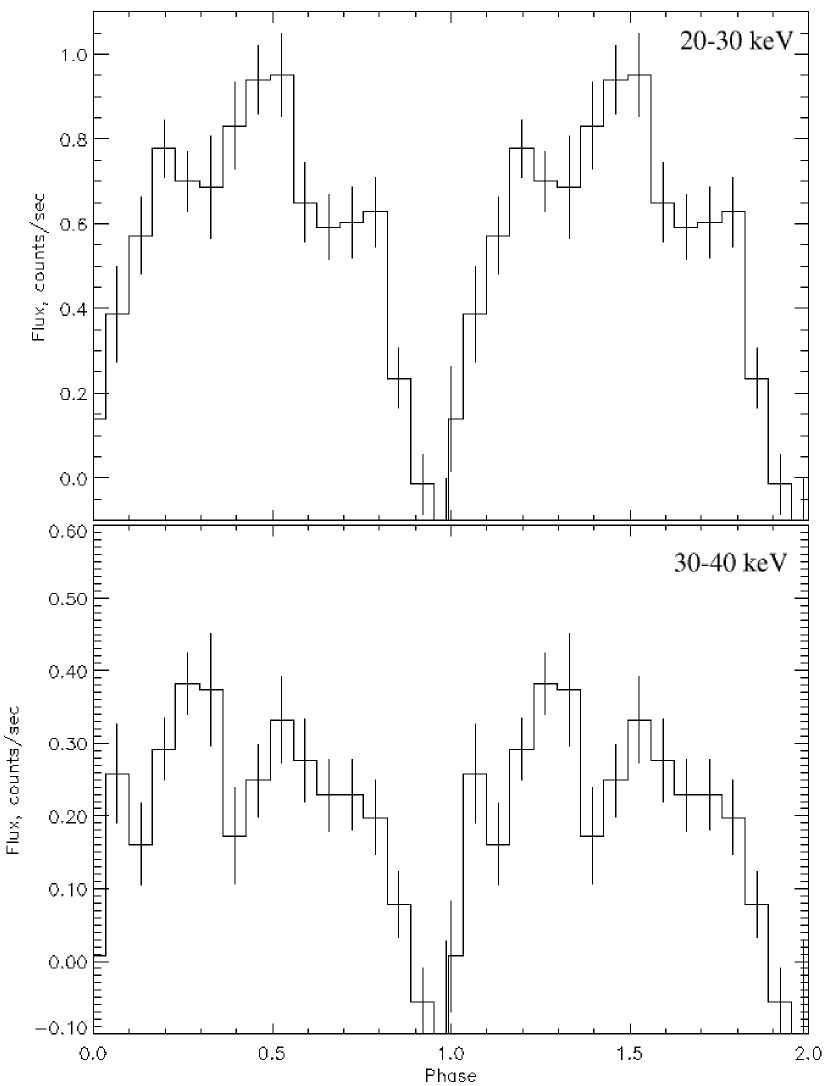
Using the measured orbital period and the epoch of superior conjunction of the NS, , obtained in the fit, the IBIS/ISGRI light curves were phase-folded in the 20-30 keV and 30-40 keV energy bands. These are shown in Fig. 6 and clearly show a sharp eclipse as suggested by Au03. However, the eclipse evident in Fig. 6 appears assymmetic and indicates that we may be partially resolving the eclipse suggesting that the hard X-ray emission may not exclusively originate from a point source. The fuller phase coverage of the IBIS/ISGRI data unambiguously confirms the orbital period and the presence of an eclipse in the system. The time of mid-eclipse occurs at the time of superior conjunction of the NS, .
3.3 Refining the orbital period & an accurate ephemeris
Taking the zero epoch as the time of superior conjunction of the NS, = 52168.26 0.04 MJD and the orbital period, = 4.570 0.003 days the number of orbital cycles which have occured by the time of the last ISGRI observation is E = 207.2 0.1. Hence, over this timescale, we can confidently identify which cycle we observe. This is borne out by Fig. 6, as the eclipse is evident very near zero phase when the ISGRI data is folded with the BeppoSAX zero epoch. From the folded ISGRI light curves the time of an eclipse around the mid point of the ISGRI observation is calculated, = 52931.4 0.2 MJD. This would correspond to the beginning of the 167th orbital cycle. Linearly fitting between these two times of eclipse measurements yields a refined orbital period estimate of = 4.5696 0.0009 days. This allows the calculation of an accurate mid-eclipse ephemeris from:
| (4) |
where T0 is the time of the 1st eclipse seen by BeppoSAX and E is the cycle number. This gives an ephemeris of, = 52931.37 0.04 MJD.
3.4 XMM
The timing mode of the PN camera allows the collection of timing data with a resolution of 30 s (Strüder et al., 2001). The arrival time of all events were corrected to the solar system barycentre, using the SAS task “barycen”. A 2–10 keV band light curve consisting of 1 second bins was generated for the duration of the observation. The Lomb-Scargle periodogram method performed on the ISGRI data was applied to search for periodicites. The resulting power spectrum is shown in Fig. 7. A peak of power 504 is clear at a frequency of 7.17 mHz, the second harmonic of this frequency is also clearly visible with a power of 220. This corresponds to a pulse period of, 139.47 0.04 seconds. This is consistent with the range of pulse periods (139.44 – 139.86 s) detected by Au03. At the time of the XMM observation we expect the system to be at a phase of 0.2 in its orbital cycle. Hence, the pulse period should be doppler shifted by the orbital motion. Correcting the measured pulse period to the rest frame of the pulsar yields, 139.61 0.04 seconds. The XMM measurement is consistent with the pulse period, 139.612 0.006 seconds, measured by BeppoSAX.
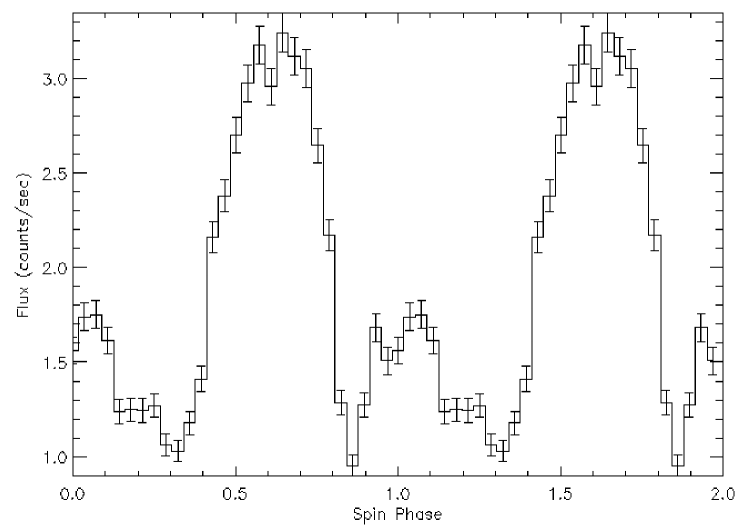
Folding the XMM data on this pulse period yields the pulse period phase folded light curve seen in Fig. 8. The main pulse occurs around phase 0.63. A secondary peak is visible around phase 0.05. The pulse fraction, , where and are the maximum and minimum count rates, is 68% 10%. The pulse period phase folded light curve matches well with the folded light curves of Au03, the pulse fractions are consistent and the locations of the primary and secondary peaks also agree.
4 Spectral Analysis
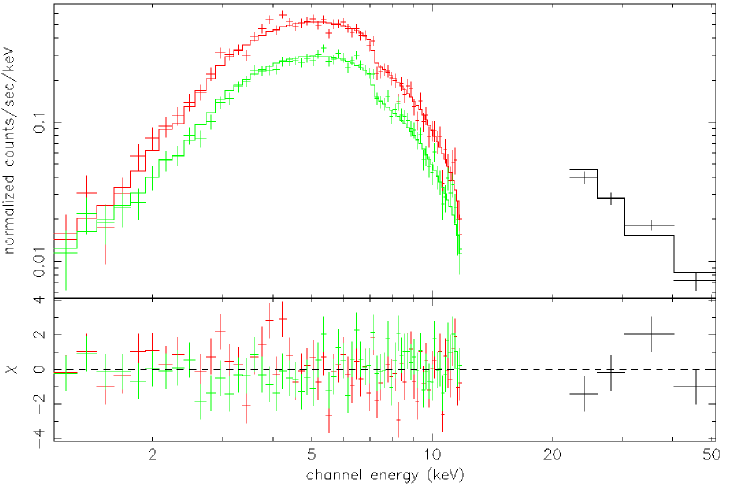
The ISGRI spectrum was extracted from narrow energy band mosaics and hence represent the long term average spectrum of the source. Phase resolved spectra were extracted from the XMM-EPIC data set. Using the pulse profile (Fig. 8) a spectrum of the source during the primary pulse and a spectrum outside of the primary pulse were generated. Au03 reported that the low statistics of the BeppoSAX data did not allow for an accurate spectral analysis. Additionally, the BeppoSAX PDS data is difficult to analyse as the data is contaminated by the bright atoll source, GX 9+1 which also appears in the field of view.
The EPIC PN and ISGRI average spectra were simultaneously fit, in XSPEC v11.3, by a photoelectric absorbed, broken power law model with a single Gaussian emission line (gauss + zvphabs*bknpower). A broad Gaussian line is used to account for soft X-ray residuals that mostly concentrate at low energy. This soft excess contributes 7 ergs cm-2 s-1 below 3 keV. Elemental abundances of the spectral model, excluding Fe, are frozen to solar quantities and the redshift is frozen to 0, all other parameters are free. The fit has = 1.29. The best fit parameters are listed in Table 3. The broken power law indices were found to be = 0.79 0.08 and = 3.1 0.1, with a break at = 11.3 0.6 keV. A column density of = 6.8 1.0 cm-2 is found compared to the expected galactic column density of 1.0 cm-2. The Fe edge is 3 times that of solar abundances, this may indicate that large amounts of Fe are present or that the is underestimated. The shape of the spectrum is typical of X-ray pulsars which are characterized by a flat power law with a slope of between 0 and 1 up to a high energy cut-off at 10-20 keV after which the slope becomes much steeper (White et al., 1995). Fitting Fe lines at 6.45 and 7.1 keV improves the overall fit, however the F test indicates that they are significant at only the 95% confidence level. The ISGRI spectrum flux is, F20-100keV = 5.9 ergs cm-2 s-1, the XMM unabsorbed fluxes are, F2-10keV = 8.9 ergs cm-2 s-1 within the primary pulse, and F2-10keV = 5.1 ergs cm-2 s-1 outside the primary pulse.
| Parameter | Value |
|---|---|
| 164.57/128 | |
| 6.8 1.0 1022 cm-2 | |
| 0.79 0.08 | |
| 11.3 0.6 keV | |
| 3.1 0.1 | |
| Bkn power law | 4.9 1.0 10-3 ph keV-1 cm-2 s-1 |
| Fe abundance | 3.1 0.8 (of solar) |
The shapes of the phase resolved XMM spectra are consistent with each other. The hydrogen column density and continuum parameters of the model, excluding the normalization, do not vary with pulse phase indicating that the absorption is not associated with the neutron star accretion column.
It is possible to fit the data with a Comptonization model or a cut-off power law, however to do so requires the introduction of a particularly small normalization constant to the spectral model, CISGRI0.2, to account for cross-calibration uncertainties of the ISGRI and EPIC observations. This would indicate that XMM had observed IGR J18027-2016 while it was in a high state when compared to the average ISGRI flux. However, the ISGRI light curve (Fig. 2) at the time of the XMM observation show no indication of a large change in flux of the source. The fitting of system is highly dependent upon the spectral shape of the continnum assumed in the spectral model, a softer spectrum (e.g. the comptt model describing Comptonization of soft photons in a hot plasma) results in an twice as large as listed in Table 3.
5 Discussion
We have directly and precisely measured the orbital period for IGR J18027-2016 of 4.5696 0.0009 days. This is consistent with the implied orbital period of SAX J1802.7-2017, and as it is the only known X-ray source within 10 according to the SIMBAD/NED database the two sources are confirmed as the same source. Additionally, we have observed that this is an eclipsing system confirming the hypothesis of Au03. The ephemeris of the mid-eclipse time is measured as, = 52931.37 0.04 MJD. The 139 s pulse period measured by BeppoSAX and XMM combined with the 4.5696 day orbital period, situates IGR J18027-2016 in the region of the Corbet diagram (Corbet, 1986) occupied by underfilling Roche lobe supergiant systems . Hence, the system appears to be a neutron star that is accreting material through the stellar wind of the companion supergiant star.
The ISGRI 20-80 keV light curve, shown in Fig. 2, indicates that this is a weak, persistent source with no evidence of flaring in any of our observations. Lutovinov et al. (2005) also reported that the 18–60 keV fluxes observed by IBIS in September 2003 and March 2004 of IGR J18027-2016 were nearly constant and equal. The absence of strong hard X-ray variability contrasts with what has been observed in other HMXBs in which flares by a factor of 10 have been observed. This may indicate that the stellar wind is rather homegenous at least on time scales longer than a few days. The persistent nature of the source suggests that the NS is continuously accreting, and, combined with the sinusoidal modulation of the pulse arrival times this implies that the NS is in an approximately circular orbit about its companion. This is consistent with the eccentricity upper limit of e 0.2 given by Au03. The absence of apparent transient behaviour and circular orbit further suggests that this is a supergiant system and not a Be X-ray binary (Liu et al., 2000). However, the fact that IGR J18027-2016 has not been reported by previous X-ray telescopes may indicate some level of transient behaviour. Notably there was no detection by the ROSAT mission. Transient behaviour would indicate the absence of Roche lobe overflow but would suggest that this was an atypical Be X-ray binary as its orbital and pulse period do not locate it in the expected region of the Corbet diagram and it has a very low eccentricity orbit.
During the XMM observation the X-ray flux increased by 50% with constant pulse fraction. Spectra derived for both periods do not show any significant variation in the spectral parameters. This is notable as one could expect to see a significant increase in for large flux differences. The observed properties of IGR J18027-2016 appear to be very stable on timeescales of a few days, as seen by ISGRI, and 12 ksec, as seen by XMM.
The mass function of the system donor is:
| (5) |
where is the supergiant companion star mass, , is the ratio of the NS mass to the supergiant companion mass and is the gravitational constant.
Fig. 6 clearly shows an eclipse occuring in the 20–30 and 30–40 keV energy bands. Future observations of the ingress and egress of the NS eclipse may provide information regarding the donor star’s atmosphere and indicate any evidence of extended high energy emission in the region around the NS. There are two methods to determine the half angle of eclipse, , which we define as the half width half height of the eclipse. Firstly, if we assume a cicular orbit, the measured duration of the eclipse corresponds to a half angle of eclipse of = 0.66 0.2 radians in both energy bands. Additionally, the mid-eclipse time corresponds to the epoch of NS superior conjunction of the NS, , derived from our fit. This corresponds to the period in the BeppoSAX data when the count rate was consistent with the background count rate. Taking the time at which the eclipse ends as 52,168.69 MJD (Au03), then the half-angle of the eclipse corresponds to = 0.591 0.09 radians. Taking a weighted mean of the half angle of eclipse gives = 0.61 0.08 radians. Assuming we have a point source and spherical geometry the duration of the eclipse is related to , the companion star radius, the inclination of the system and , the separation of the stars by (Nagase, 1989):
| (6) |
Assuming that the NS has the canonical mass of 1.4 M☉ then for any mass of the companion star the inclination of the orbit can be dervied from the mass function (eq. 5). Assuming that we have a perfectly circular orbit then , the phase delay modulation yields and hence from eq. 6 there is an empirical relationship between the companion star mass and radius. An analytic approximation for the companion star Roche lobe is:
| (7) |
(Bowers & Deeming, 1984) (accurate 1)
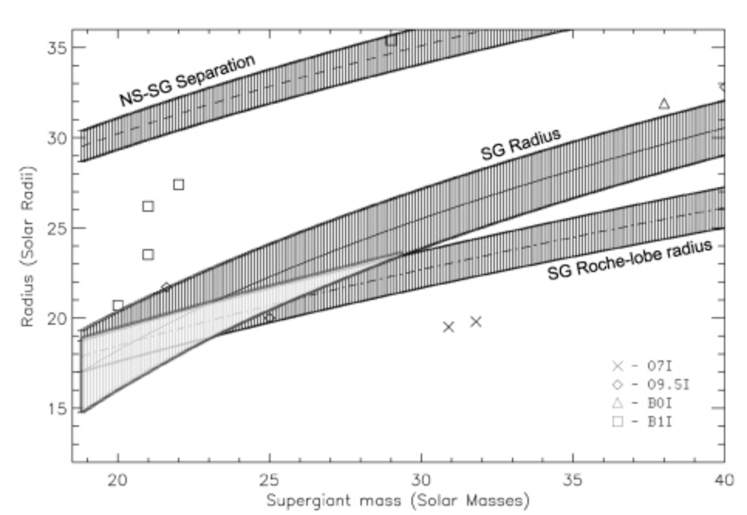
From its low luminosity and its position in the Corbet diagram, we expect the supergiant companion star to be underfilling its Roche lobe hence the Roche lobe radius gives an upper limit to the allowed companion star radius, mass and system inclination. The empirical – relation and the associated are plotted in Fig. 10 along with the neutron star – supergiant separation. The lighter shaded region towards the lower left of Fig. 10 indicates the allowed system parameters such that our measurements represent an underfilling Roche lobe supergiant. Also plotted are the masses and radii of a number of known OB supergiants (Wilson & Dopita, 1985; Herrero et al., 1992).
From Fig. 10 we can see that the properties of the companion star are: 21; 19. The complete range of these values is given in Table 4 with the other parameters of the system. These mass and radius values are consistent with late O9 – early B1 supergiant stars.
| Parameter | Value |
|---|---|
| 4.5696 0.0009 days | |
| (BeppoSAX) | 139.612 0.006 s |
| (XMM) | 139.61 0.04 s |
| 68 1 lt-s | |
| 52168.26 0.04 MJD | |
| 52931.37 0.04 MJD | |
| 16 1 | |
| 0.61 0.08 rad | |
| 18.8 29.3 | |
| 14.7 23.4 | |
| 28.4 35.8 | |
| 59∘ 88∘ |
| Luminosity, (ergs cm-2 s-1) | 1035 | 1036 | 1037 | 1038 |
|---|---|---|---|---|
| , (s yr-1) | 0.02 | 0.2 | 1.4 | 9.7 |
| Distance, (kpc) | 3.1 | 9.7 | 31 | 421 |
Measurement of changes in the NS pulse period is an independent indicator of the accretion mechanism operating in the system. If the NS is accreting matter from the donor star via Roche lobe overflow the NS should show evidence of spinning up. The BeppoSAX and XMM measurements of the spin period as 139.612 0.006 s and 139.61 0.04 s respectively, are separated by 2.5 years and indicate no evidence of a change in spin period. Taking the 1 limits of these measurements we find an upper limit to the spin-up rate of, 0.02 s yr-1. The theoretical spin-up rate is given by (Frank et al., 1992):
| (8) |
where M1 is the NS mass in M, R6 is the NS radius in cm, L37 is the NS accretion luminosity in units 1037 ergs cm-2 s-1, is the magnetic moment in units 1030 G cm3 and I45 is the moment of inertia (MR2) of the NS in units 1045 g cm2. For a typical neutron star with a magnetic field strength, B1012 G, I45 R6 1. The theoretical spin-up of a neutron star accreting via Roche lobe overflow with a luminosity in the range 1035–1038 ergs cm-2 s-1 is shown in Table 5 with the associated source distance for each luminosity. If Roche lobe overflow is the source of accretion then a luminosity of 1038 ergs cm-2 s-1, close to the Eddington luminosity, is expected (Kaper et al., 2004). Table 5 illustrates that this would locate the source outside of the galaxy and would result in a clear spin-up of the pulsar of 24 seconds between the BeppoSAX and XMM observations, which is not seen. The limit of 0.02 s yr-1, would imply that the source has a luminosity of 1035 ergs cm-2 s-1 which is very much lower than expected from a Roche lobe overflow system but would be typical of a wind accretion system. Hence, this is another indication that the donor star has not filled its Roche lobe and that the pulsar is powered entirely by wind fed accretion and thus lending further credence to the constraints on the donor star given by the shaded region of Figure 10.
The soft excess ( 3keV) evident in the XMM-EPIC data is identical in the on and off pulse spectra implying that the soft excess may not be pulsed. Performing timing analysis on the events below 3 keV does not show any period, however, the event rate is not high enough to reach a definitive conclusion. Soft X-ray excess have been found in other HMXB sources, e.g. Vela X-1, and have been explained by scattering or partial ionisation of the stellar wind.
The equivalent width of the 6.4 keV Fe line has a 3 sigma upper limit of 40 eV and 25 eV for the off pulse and on pulse spectra respectively. Such values are consistent with 5.0 cm-2 for a spherical geometry. The non-detection of the Fe line is therefore consistent with the absorbing column density which is oberserved.
The spectral fit of the EPIC and ISGRI spectra indicate a column density of 6.8 1.0 cm-2. This is much greater than the expected line of sight column density, 1.0 cm-2, and suggests that the absorption is intrinsic to the source and not the line of sight. This could be explained by the stellar wind from the OB supergiant accreting onto the neutron star forming a dense spherical shell. The low statistics of the BeppoSAX data used by Au03 did not allow an accurate spectral analysis. They inferred a luminosity of 5.6 1035 ergs s-1 over the 1.8-10 keV range by fitting their data to a power law with = -0.1 0.1 and NH = 1.7 cm-2, and assumed a source distance of 10 kpc. The XMM spectral fit indicates that the column density is much higher and hence the source luminosity was previously underestimated.
Assuming that IGR J18027-2016 is 10 kpc away the 2-10 keV flux during the primary pulse of F2-10keV = 8.9 ergs cm-2 s-1 gives an estimate of the source luminosity of 1.1 ergs s-1, a typical luminosity for a non-Roche lobe filling Supergiant HMXB (Negueruela, 2004). A useful comparison is provided by 4U 1538-52, which is a typical HMXB accreting from a stellar wind and shows similarities to IGR J18027-2016. 4U 1538-52 has a long spin period of 529 s, an orbital period of 3.75 days and undergoes a well defined X-ray eclipse. The companion is a 19.9 B0 star (Reynolds et al., 1992) and the X-ray flux has been estimated as 2 1036 ergs s-1 for a distance of 6.4 kpc (Robba et al., 2001). Hence the luminosity of IGR J18027-2016 appears to be typical of wind accreting HMXBs assuming it has a distance which approximates to the far side of the Galactic Centre.
6 Summary
We presented an analysis of INTEGRAL, BeppoSAX and XMM-Newton observations of IGR J18027-2016. We conclude that the source is an eclipsing HMXB system comprising an X-ray pulsar accreting matter from the stellar wind of a late O – early B supergiant. The source is persistent and has a high intrinsic photoelectric absorption and is similar in this nature to a number of other new INTEGRAL sources (Walter et al., 2003). IGR J18027-2016 has the properties of a typical wind accreting HMXB system.
Acknowledgements.
This work is based on observations obtained with INTEGRAL and XMM-Newton, two ESA science missions with instruments, science data centre and contributions funded by the ESA member states with the participation of the Czeck Republic, Poland, Russia and the USA. We thank R. Cornelisse, S. Laycock and J. Zurita for their input and discussions. A. B. Hill acknowledges funding support from a PPARC PhD studentship. We thank the anonymous referee for their useful comments.References
- Augello et al. (2003) Augello, G., et al., 2003, ApJ, 596, L63
- Bird et al. (2004) Bird, A. J., Barlow, E. J., Bassani, L., et al., 2004, ApJ, 607L, 33B
- Bowers & Deeming (1984) Bowers, R. & Deeming, T., 1984, Astrophysics I: Stars, Jones & Bartlett, 319
- Corbet (1986) Corbet, R. H. D., 1986, MNRAS, 220, 1047
- Frank et al. (1992) Frank, J., King, A. R., & Raine, D. J., 1992, in Accretion Power in Astrophysics, (Cambridge University Press), p. 125
- Gros et al. (2003) Gros, A., Goldwurm, A., Cadolle-Bel, M., Goldoni, P., Rodriguez, J., Foschini, L., Del Santo, M., & Blay, P., 2003, A&A, 411, L179
- Herrero et al. (1992) Herrero, A., Kudritzki, R. P., Vilchez, J. M., et al., 1992, A&A, 261, 209
- Horne & Baliunas (1986) Horne, J. H., & Baliunas, S. L., 1986, ApJ, 302, 757
- Kawano & Higuchi (1995) Kawano, H., & Higuchi, T., 1995, GeoRL, 22, 307K
- Kaper et al. (2004) Kaper, L., Van der Meer, A., & Tijani, A. H., 2004, RMxAC, 21, 128K
- Lebrun et al. (2003) Lebrun, F., et al., 2003, A&A, 411, L141
- Liu et al. (2000) Liu, Q. Z., Paradijs, J. van, & Heuvel, E. P. J. van den, 2000, A&As, 147, 25
- Lutovinov et al. (2005) Lutovinov, A., et al., 2005, A&A, 430, 997
- Nagase (1989) Nagase, F., 1989, PASJ, 41, 1
- Negueruela & Coe (2002) Negueruela, I. & Coe, M. J., 2002, A&A, 385, 517
- Negueruela (2004) Negueruela, I., 2004, The Many Scales of the Universe - JENAM 2004 Astrophysics Reviews, Kluwer Academic Publishers. (astro-ph/0411759)
- Press & Rybicki (1989) Press, W. H. & Rybicki, G. B., 1989, ApJ, 338, 277P
- Revnivtsev et al. (2004) Revnivtsev, M., et al., 2004, AstL, 30, 382R
- Reynolds et al. (1992) Reynolds, A. P., Bell, S. A., & Hilditch, R. W., 1992, MNRAS, 256, 631
- Robba et al. (2001) Robba, N. R., Burderi, L., Di Salvo, T., Iaria, R., Cusumno, G., 2001, ApJ, 562, 950
- Scargle (1982) Scargle, J. D., 1982, ApJ, 263, 835
- Strüder et al. (2001) Strüder, L., Briel, U., Dennerl, K., et al., 2001, A&A, 365, L18
- Turner et al. (2001) Turner, M. J. L., Abbey, A., Arnaud, M., et al., 2001, A&A, 365, L27
- Ubertini et al. (2003) Ubertini, P., et al., 2003, A&A, 411, L427
- Walter et al. (2003) Walter, R., Courvoisier, T. J. -L., Foschini, L., et al., 2004, ESA SP 552: Proceedings of the 5th INTEGRAL workshop - The INTEGRAL Universe, Editors: V. Schönfelder, G. Lichti & C. Winkler, p417
- White et al. (1995) White, N. E., Nagase, F., & Parmar, A. N., 1995, in X-Ray Binaries, eds W. H. G. Lewin, J. van Paradijs & E. P. J. Van den Heuvel (Cambridge University Press), p. 32
- Wilson & Dopita (1985) Wilson, I. R. G. & Dopita, M. A., 1985, A&A, 149, 295
- Winkler et al. (2003) Winkler, C., et al., 2003, A&A, 411, L1