The giant H/X-ray filament in the cluster of galaxies A 1795
Abstract
The cluster of galaxies A 1795 hosts a 46 kpc-long filament at its core, which is clearly visible in the light of H and X-ray emission. We present optical slit spectroscopy and deeper Chandra X-ray data of the filament. The optical spectra reveal that the the bulk of the filament is quiescent (with 130), although considerable velocity structure is apparent around the powerful radio source in the central cluster galaxy, where a direct interaction is occurring between the radio plasma and the surrounding intracluster medium. The filament contains a clump of UV/blue continuum halfway along its length, which we resolve into a chain of at least 5 distinct knots using archival HST images; the optical spectrum of this clump confirm it to be mostly comprised of O stars. It is well-removed from the central galaxy and radio source, and is most likely an example of a group of young star clusters condensing directly from the cooling gas in the filament. The observed spatial offset between these knots of star formation and the peak in the optical line emission confirms that the massive star formation is most unlikely to be responsible for the bulk of the observed emission-line luminosity in the filament. Some other (as yet undetermined) source of energy is required to power and maintain the optical line-emission, yet it must not completely impede the cooling of the X-ray gas within the filament to form the star clusters.
keywords:
galaxies: clusters: individual: A 1795 X-rays: galaxies: clusters1 Introduction
A 1795 is a well-studied rich cluster of galaxies lying at a redshift of . The dominant central galaxy is of particular interest, as it has long been known to possess a luminous, extended emission-line nebula (Cowie et al. 1983; van Breugel, Heckman & Miley 1984; Hu, Cowie & Wang 1985; Heckman et al. 1989) as well as localized regions of excess blue continuum indicative of massive recent star formation (McNamara & O’Connell 1992, 1993; Johnstone, Fabian & Nulsen 1987; Cardiel, Gorgas & Salamanca 1998; McNamara et al. 1996; Pinkney et al. 1996). The nebula is in two major parts: one is about 10 kpc in size, located within the central galaxy, and around its radio source; the other is in the form of a giant filament extending beyond the galaxy. The central galaxy hosts the powerful FR I radio source 4C 26.42 (1346+268), which shows high Faraday rotation measures (Ge & Owen 1993). The radio emission is confined to within arcsec of the active nucleus, and is distorted into a Z-shaped morphology with both lobes bent through 90 degrees within 2 arcsec of the nucleus. A bright hotspot is located less than one arcsecond to the NW of the nucleus, before the bent ‘knee’ of the northern radio lobe (Ge & Owen 1993; this is apparent only as a slight extension to the radio nucleus in the radio morphology contours shown as part of Fig 1).
The spatial distribution of the excess blue continuum and the optical emission-line gas close to the galaxy is clearly related to that of the radio source and its depolarization, suggesting a close physical relationship. The brightest off-nuclear knot of line emission lies along the outer boundary of the radio lobe to the north-west (van Breugel et al 1984, Cowie et al 1983; Fig 1) and the two primary regions of excess blue continuum light each curve along the outside of a radio lobe (McNamara et al 1996). This UV/blue light is resolved into a knotty structure by the HST, strongly suggesting it to be due to clusters of young stars (McNamara et al 1996; Pinkney et al 1996; O’Dea et al 2004; Fig 1). This interpretation is supported by UV imaging used to constrain star formation models, implying either continuous star formation or a recent starburst, with rates of around (Smith et al 1997; Mittaz et al 2001). The general inference from all these papers is that close to the galaxy, recent star formation has been triggered by the interaction between the radio jet with dense gas to the north-west of the galaxy (eg McNamara et al 1996; Pinkney et al 1996). A detection of CO emission from cold molecular gas in the central galaxy (Edge 2001) lends further strength to this explanation, as a large fraction of the CO emission is also located along this north-west edge of the northern radio lobe (Salomé & Combes 2004 : Fig 1). Colour maps also reveal a dust lane sweeping down from the western edge of the northern radio lobe to cross the galaxy nucleus (McNamara et al. 1996; Pinkney et al. 1996; Fig 1). Thus local to the radio source there is a clear interplay between the outflowing jets and the cooler components of the surrounding intracluster medium – collision, displacement and jet-induced star formation.
The presence of features such as young massive star formation, an extended luminous emission-line nebula and central cold molecular gas are characteristic of central galaxies in clusters with a strong cooling flow operating in the hot intracluster medium (Crawford 2003, 1999; Fabian 1994 and references therein). The most recent X-ray data do indicate a cooling flow would operate in the absence of any heating source within the inner kpc of the A 1795 cluster, with an integrated mass deposition rate of (Ettori et al. 2002; Tamura et al 2001; Molendi & Pizzolato 2001). Although the X-ray emission from the outer regions of the cluster appears regular (Buote & Tsai 1996), detailed Chandra data showed that the central core is not relaxed (Ettori et al. 2002; Markevitch et al. 2001). In particular, Chandra revealed a thin, arcsec-long111 arcsec corresponds to a projected length of , using an assumed cosmology of , and . filament of X-ray emission extending away from the central cluster galaxy to the SSE (Fabian et al. 2001). It is here in the filament, many kiloparsec away from the influence of the central radio source, that a more direct connection between the different components of a cool intracluster medium can be observed.
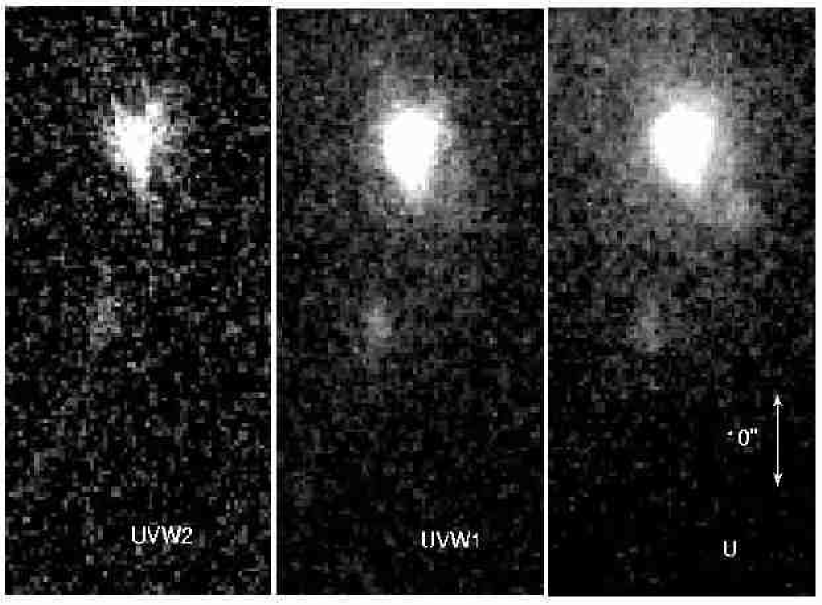
The X-ray structure coincides spatially with a luminous optical line-emitting filament discovered two decades earlier by Cowie et al. (1983; Fig 2). The X-ray filament is seen only at soft energies (0.3-3 keV), with a total keV luminosity of , barely an order of magnitude more than the luminosity it emits in the H[NII] emission lines. Although clumpy structure is seen both at optical and X-ray wavelengths, it does not correspond well spatially. The filament also shares the general sense of faint linear structures seen in the -band (McNamara et al. 1996; Fig 2; although note that this filter may also contain some [OII] line emission), which encompass a bright clump of blue continuum halfway down the filament, at arcsec SSE of the central cluster galaxy. This clump is not obviously associated with a galaxy in the cluster, and is also seen in the UV images of Mittaz et al (2001; Fig 2). The colours of this region are very blue, characteristic of very recent star formation.
A likely origin for the X-ray/optical/-band filament is that it is a ‘cooling wake’, produced as the host cluster gas cools around a moving galaxy (Fabian et al. 2001). The dominant cluster galaxy of A 1795 travels through the cluster gravitational potential with a peculiar velocity of relative to the mean of all the other cluster galaxies, and at faster than those within the central 270kpc (Oegerle & Hill 1994). The most rapidly cooling gas in the inner intracluster medium would then be gravitationally focussed onto a line trailing the central cluster galaxy’s direction of motion. This view is supported by the facts that the radiative cooling time of the X-ray gas is comparable to a dynamical timescale for the optical filament estimated from its size and velocity; also that Hu et al. (1985) find that most of the optical filament shares the velocity of the cluster rather than that of the central galaxy at its head. The dominant galaxy of A 1795 also has a cD envelope extended out to radii of up to 3 arcmin, which is elongated on the same approximate north-south axis as the filament (Johnstone, Naylor & Fabian 1991). The large-scale distribution of the galaxies and the X-ray emission from the cluster also both appear to be elongated in the same direction.
In this paper we present a deeper X-ray image of the core of the cluster, and optical spectroscopy of the A 1795 filament, in order to re-examine the relationship between the different wavelength components. This filament is a useful illustration of cooling behaviour within an intracluster medium, as it well removed from the complicating effects of a powerful radio source. We also examine the kinematic interaction of the ionized gas close to the radio source near the nucleus, as well as the nature of the massive young star formation taking place both here, and within the filament.
2 X-ray data
| Sequence | Instrument | Exposure | Date of | Type of |
|---|---|---|---|---|
| number | (ksec) | Observation | Observation | |
| 790078 | ACIS-S | 14.4 | 2002-06-10 | Cal |
| 800001 | ACIS-S | 19.6 | 2000-03-21 | GO |
| 800002 | ACIS-S | 19.5 | 1999-12-20 | GO |
| 890027 | ACIS-S | 14.3 | 2004-01-14 | Cal |
| 890026 | ACIS-S | 14.4 | 2004-01-14 | Cal |
| 290028 | ACIS-S | 14.6 | 2004-01-16 | Cal |
| 890029 | ACIS-I | 15.0 | 2004-01-18 | Cal |
| 890030 | ACIS-I | 14.9 | 2004-01-23 | Cal |
2.1 Observations and reduction
The X-ray filament was first discovered in the ksec Chandra image of Fabian et al (2001). We have merged the two original GO datasets of these observations (sequence numbers 800001/2) with a further six calibration datasets from the Chandra archive; the observations used are listed in Table 1. Three of the calibration datasets have the core of the cluster placed away from the aimpoint of the chip; whilst this may introduce artificial structures in the much larger-scale cluster emission, the features and structure in the filament itself are unaffected (we have checked this by repeating the analysis omitting the three offending datasets). The secondary event files for each of the datasets were added together with the CIAO merge_all contributed script to make a total merged event file. The resulting total exposure time for this merged observation is 126.7 ksec. We extracted an image in the 0.3 to 7 keV band from this merged event file, using the native 0.492 arcsec binning.
We also obtained spectral information on the filament from a separate reduction using only the six ACIS-S datasets (ie omitting the two ACIS-I datasets); these were reprocessed with the latest appropriate gain files. Time periods from the observations showing flares in the 2.5 to 7 keV band on the ACIS-S5 CCD (or the S3 if there was no S5 data in the observation) were removed. This yielded a total ACIS-S observation time of around 90 ksec in the central part of the filament, and a total image was created in the 0.5 to 7 keV band. We smoothed this image with the accumulative smoothing algorithm (see Sanders in preparation), which uses a circular top hat smoothing kernel that grows until the signal to noise is sufficient within the kernel. In this case we smoothed the image with a signal to noise ratio of 20.
We created bins on the raw ACIS-S image which contained a signal to noise of 32 ( counts), using a contour binning algorithm (Sanders in preparation). The routine grows regions from the brightest pixel on the smoothed map, adding neighbouring pixels nearest in value from the smoothed map, until the threshold signal to noise is reached. Pixels lying outside a radius of 1.8 times the radius of a circle with the same area as the bin were not added, ensuring the regions did not become very elongated. We start binning again from the next highest flux pixel in the image, until all the pixels are exhausted. Any stray regions are gathered up into the neighbouring bin with the nearest flux in the smoothed map. Spectra from each of the regions were extracted from each of the datasets, as well as from corresponding blank-sky fields. We also calculated responses and ancillary responses for each of the datasets and regions. The spectra for a bin were added together (ignoring those datasets with no data for the bin). We added the responses and ancillary responses together for the region, weighting them according to the number of counts in the corresponding spectrum. We added the background spectra together so that the effective exposure of each component was the same fraction of the total background, as the number of counts of the foreground spectrum was of the total foreground spectrum. This procedure is appropriate if the spectral response of the detector does not change greatly between the observations. We tested the procedure using faked data with a variety of different parameters. It produced no systematic temperature or abundance changes, but produced a slight offset in ( atoms cm-2), presumably due to the change in effective area caused by the build up of contaminant on the ACIS detector.
We fitted the spectra within XPEC by a mekal model (Mewe, Gronenschild & van den Oord 1985; Liedahl, Osterheld & Goldstein 1995) absorbed by a phabs model (Balucinska-Church & McCammon 1992). In the fits, the temperature, abundance (relative to Solar), normalisation and absorption were free. We minimised the C-statistic (Cash 1979) in the fits.
2.2 Results
The final 0.3-7 keV merged image is shown (on two different spatial scales) in Figs 1 and 2, along with images in other wavebands on a matched spatial scale for direct comparison: individual images in these figures are adapted from those published by O’Dea et al (2004), Salomé & Combes (2004), McNamara et al (1996), Pinkney et al (1996), van Bruegel et al (1984) and Cowie et al (1983); the 3.6cm radio data are courtesy of G. Taylor (from Ge & Owen 1993); the XMM-Newton UV data of Mittaz et al (2001) are shown in Fig 5. The X-ray images are shown after adaptive smoothing using the asmooth algorithm with a minimum significance of 3.
X-ray emission is now evident at the position of the radio nucleus, at RA 13:48:52.44 Dec +26:35:34.5 (J2000), with a 1-7 keV luminosity of (assuming a power-law spectrum with and only Galactic line-of-sight absorption). The brightest peak of X-ray emission, however, lies 4.5 arcsec to the NNW of the nucleus, spatially coincident with the bright peaks seen in both the CO(2-1) and H+[NII] line emission images (Fig 1). The emission in this region shares the same morphology in the three wavebands, appearing to curve round the outside of the northern radio lobe, first to the west then back round north-east to the offset bright peak. There is a prominent gap in the X-ray emission south of the active nucleus and before the start of the filament, at the location of the southern radio lobe.
The new X-ray image refines the clumpy structure seen by Fabian et al (2001) within the X-ray filament. As noted in that paper, although the sense of the filament is the same in the X-ray, H+[NII] and UV wavebands, there is no detailed one-to-one correspondence of features, particularly within the northern half of the filament. A bright X-ray blob 22.5 arcsec south of the nucleus coincides well with the brightest peak in the H+[NII] filament, but lies a couple of arcseconds to the south of the prominent UV continuum blob. In each band this bright peak is accompanied by a second, fainter knot around 5 arcseconds due south. There is no sign of any soft X-ray emission associated with the two much fainter cross-spurs seen in the optical emission-line image, running into the filament from the north-east.
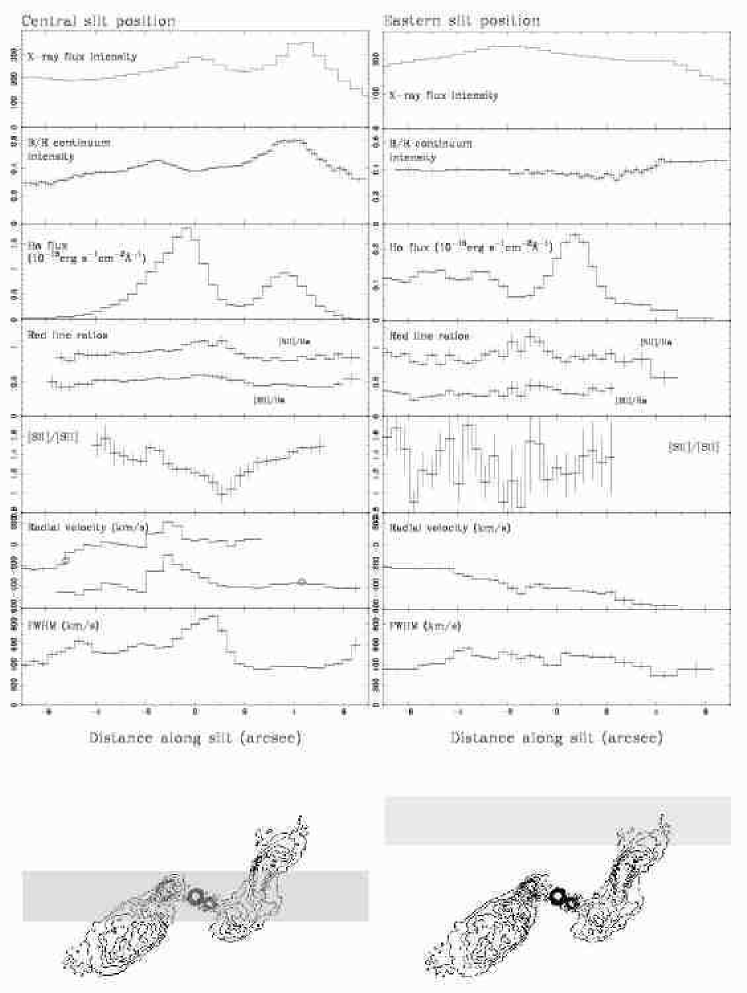
The top panels of Figs 10 and 11 show the X-ray flux intensity along a 2 arcsec cut across the nucleus and filament, and a parallel cut 3 arcsec to the east (these two cuts correspond to the optical slit positions detailed in the next section, also see Fig 8). The same data is displayed on two different scales to distinguish the general properties of the filament (in Fig 10) and the properties very local, and in relation to, the radio source (in Fig 11).
Fig 3 shows the number of counts for the combined six ACIS-S datasets in 0.5 arcsec pixels and the 0.5-7 keV energy range (smoothed with a Gaussian of two pixels, corresponding to 1 arcsec; left-hand panel), and the projected emission-weighted temperature of each region (right-hand panel). The uncertainties on each individual temperature measurement vary from per cent along the filament out to per cent at the edge of the region shown. The central region around the nucleus now shows emission down to 1.8 keV. The filament is seen to be at 2.1-2.6 keV, substantially cooler than that of the surrounding intracluster medium, with the coolest regions (at keV) located in the brightest structures around the radio source (Fig 3 – the bright patch of emission just 2 arcsec south-east of the nucleus, and the peak in the X-ray emission to the north-west). The components within the filament are, in comparison, not directly coincident with the brightest regions of X-ray emission.
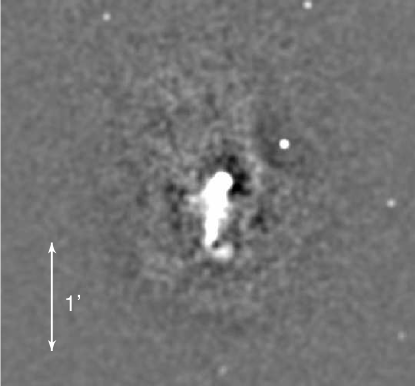
A hole in the X-ray emission is apparent to the West of the end of the X-ray filament in Fig 3, centred at RA 13:48:52.7, Dec 26:35:01.8. This is not an artefact of adaptive smoothing, as it is also present in the original unbinned data. No object is visible at this position in the DSS. A further structure is seen as a semi-circular depression in the X-ray emission, approximately centred on the bright point source (at RA 13:48:49.9, Dec 26:35:57.5), arcsec to the NW of the nucleus. This depression is again a feature visible in the raw data, but becomes more apparent after unsharp-masking the image (Fig 4); i.e. the dataset was subtracted by itself smoothed by 10 arcsec. The deficit in X-ray emission does not seem to be due to X-ray absorption, as the spectral image shows no obvious excess of NH is in this region. It could represent an infalling cluster, but no major galaxies are seen in this region, apart from a faint source in the HST data coincident with the central X-ray point source. The structure may be a ghost radio bubble as seen, for example in MKW3s (Mazzotta et al 2002), but there is no low-frequency radio emission coincident with this region, and it would be unusually small in size, with a radius of 15.5 arcsec (corresponding to kpcat the redshift of A 175).
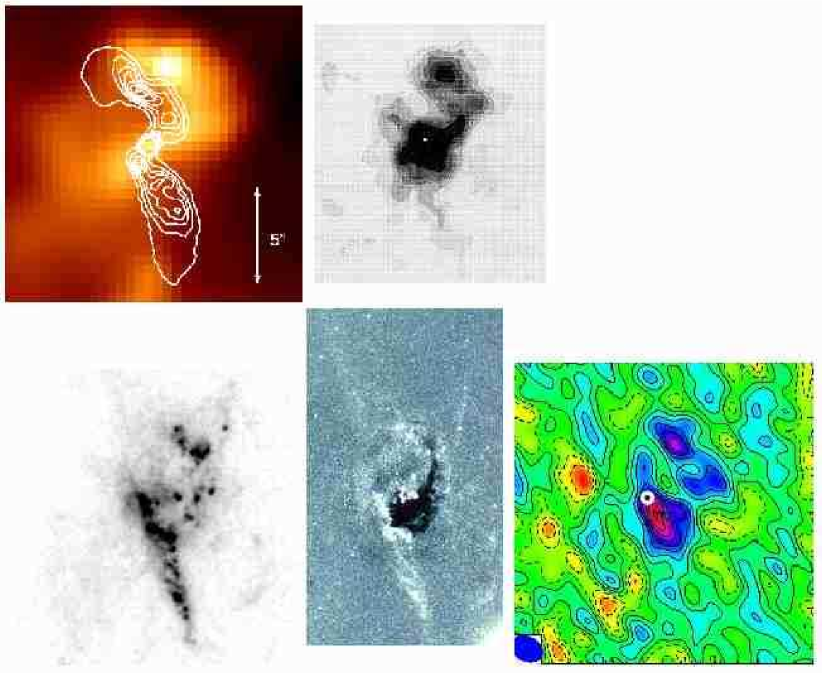
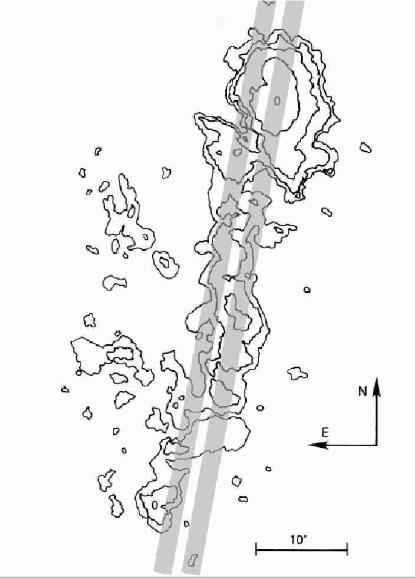
Left) the smoothed Chandra 0.3-7 keV X-ray image, with white contours of radio emission at 3.6cm superposed (courtesy of G. Taylor). The image size is arcsec.
Right) the H+[NII] optical line emission (adapted from van Breugel et al 1984), with the position of the radio nucleus marked by a white dot. The image is approximately arcsec.
Lower row:
Left) the far-UV continuum and Ly- line emission from the HST STIS (F25QTZ and F25SRF2 filters) taken from O’Dea et al (2004). The image is approximately 16 arcsec square.
Middle) galaxy-subtracted HST image (F702WF555W filters) taken from Pinkney et al (1996). The dust lane absorption shows as black, and emission features as white. The scale is 10.518 arcsec, and the position of the nucleus is marked by a red ‘N’.
Right) the continuum-subtracted CO(2-1) emission from Salomé & Combes (2004). The position of the radio nucleus is marked by a white dot and the beamsize is indicated by the solid oval in the lower left-hand corner of the image. The image is 16 arcsec square.
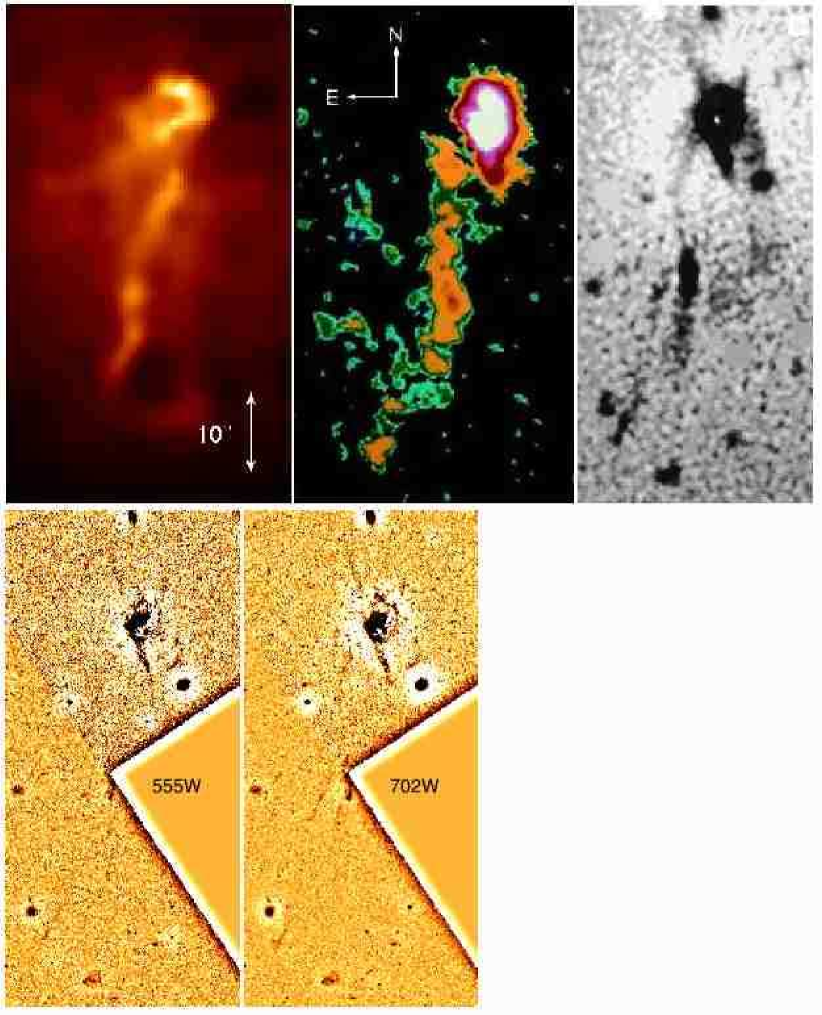
Adaptively-smoothed soft Chandra X-ray (0.4-7 keV) image of the filament south of the central galaxy in A 1795; the image is arcsec.
The filament in the light of the H+[NII] line emission from Cowie et al. (1983); the image is 65 arcsec.
The -band continuum image (with the galaxy continuum subtracted) adapted from McNamara et al. (1996). The image is 3065 arcsec. The nucleus is shown by a white dot.
The images are to scale, and the position of the radio nucleus in each is aligned horizontally in each row.
Bottom: Unsharp-masked WFPC2 HST images of the filament of A 1795 through the F555W (left; corresponding to virtually line-free emission) and the F702W (right; which includes the redshifted H[NII] emission lines) filters. Each image covers an area of arcsec.
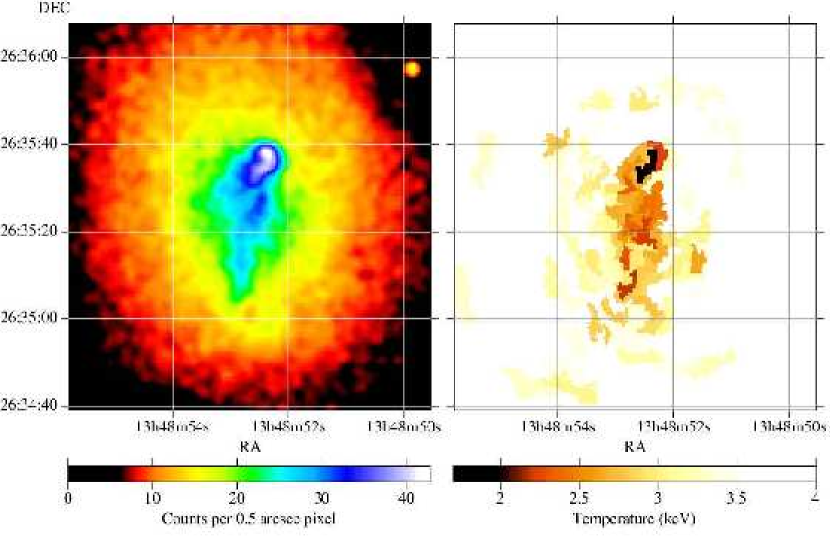
(Right) A map showing the variation in X-ray temperature along the filament, created from spectral fitting.
3 HST images
3.1 Archival observations
High spatial-resolution HST images of the central cluster galaxy in A 1795 have been published in many papers (eg O’Dea et al 2004; Pinkney et al 1996; McNamara et al 1996). We extracted two archival WFPC2 HST observations where some of the filament was also in the field of view. These two datasets each have a total observation time of 1780 sec, and are taken through the F555W (U2630404T U2630405T U2630406T) and F702W filters (U2630401T U2630402T U2630403T). The F555W (which is a -band filter) observation is dominated by stellar continuum emission at the redshift of A 1795, the only line emission being the comparatively weak H[OIII]. The F702W observation includes the strong redshifted emission lines of H[NII] in its bandpass. The raw data were combined using standard STSDAS software within IRAF. In order to show up the faintest structures within the filament, we unsharp-masked the data by subtracting the data by itself smoothed by 20 pixels. The final images were then smoothed by 1 pixel, and the resulting images are shown in Fig 2.
3.2 Results
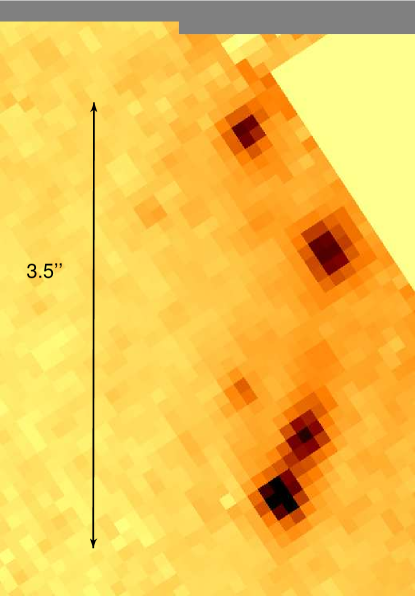
The images in both HST bands show linear structures emerging from the galaxy to the NW and NE, and the continuum forming the star formation around the southern radio lobe. In addition, the F702W image shows very faint, thin and double linear structures to the SSE, echoing the filament as seen in the ground-based -band image of McNamara et al (1996; Fig 2). The fact that these filaments are seen only in the F702W and not the F555W band strong suggest that they are due to redshifted line emission of H and [NII] in the filter bandpass. Unfortunately much of the star forming region half-way along the filament is located just at the join between the PC and WF chips. A chain of at least five resolved knots are visible in this location, however, and are shown in close-up in Fig 6. Each knot is approximately 0.3 arcsec across, corresponding to a size of around 170 parsecs at the redshift of the galaxy, and they are spread over a length of 3.5 arcsec (4 kpc). All five knots are visible in both the F555W and F702W bands, strongly confirming that they are primarily continuum in origin. We do not attempt photometry of the knots as they are so close to the edges of the chips, rendering the results unreliable.
4 Optical spectroscopy data
4.1 Observations and Reduction
Optical observations were taken on 2001 May 11 and on 2002 February 03, using the ISIS spectrograph at the 4.2m William Herschel Telescope on La Palma. On each occasion the optical filament was observed through a 2 arcsec-wide slit oriented at a position angle of 170∘for a total exposure time of 5400 s. The slit for the observation in 2001 was positioned to cover the centre of the galaxy and the bulk of the filament, including the blue knots of star formation (Fig 7). The slit position for the 2002 observation was at the same position angle but offset by 3 arcsec to the East (Fig 7), in order to cover the eastern side of the filament not encompassed by the first slit position. The seeing during both nights was 1–1.2 arcsec, and there was a small amount of (grey) dust during the 2002 observation. The light from the slit was split with the 5700 dichroic (with the GG495 blocking filter) into the blue and red arms of the spectrograph, where it was dispersed by the R158B and R158R gratings onto the EEV12 (blue) and TEK4 (red) CCDs, yielding wavelength dispersions of 1.62 and 2.90Å/pixel respectively. The galaxy was observed at airmasses ranging between 1.050 – 1.002, so the effects of atmospheric dispersion are minimized.
The red and blue datasets were each reduced using standard software packages within IRAF. The data were first bias-subtracted and flattened using long exposures of tungsten lamps; the individual spectra were corrected for a slight atmospheric dispersion before combining, after which they were wavelength-calibrated, sky-subtracted and flux-calibrated before the final correction for atmospheric extinction and Galactic reddening (A, assuming , from Stark et al 1992). The final two-dimensional spectra have fluxed wavelength ranges of 3200–5400Å and 6325–9300Å, and spatial binnings of 0.2 and 0.36 arcsec per pixel in the blue and red arms respectively. The data were de-redshifted using a redshift of .
It is common for central cluster galaxies with strong line emission to also have some level of intrinsic dust emission (E(B-V)), as determined by the Balmer decrement between H and H (Allen 1995; Crawford et al. 1999). In particular, the dominant cluster galaxy of A 1795 shows a patchy dust lane across its central regions in the HST images (Fig 1; Pinkney et al 1996; McNamara et al 1996) and the Balmer decrement measured from a long slit spectrum of the whole galaxy indicates that E(B-V) (Allen 1995; Crawford et al. 1999). In our current spectra, the H and H emission lines are detected on different arms of ISIS, and there are systematic uncertainties in matching the two datasets. We are also wary of applying a blanket correction from an averaged spectrum, given the observed patchy structure of the dust lane. We thus do not correct the spectra for the intrinsic reddening, but assess later any effect this may have in understanding the line emission properties and the continuum contribution from massive young stars.
4.2 Analysis and Results
For all the spectral results, we shall refer to distances along the slit relative to the measured peak of the galaxy continuum. For the spectra from the blue arm, this peak is assessed from the profile of only the very reddest continuum available. In the central slit position we take this continuum peak to be coincident with the core of the radio source. We adopt the convention that negative distances lie to the south of the nucleus, and positive distances to the north.
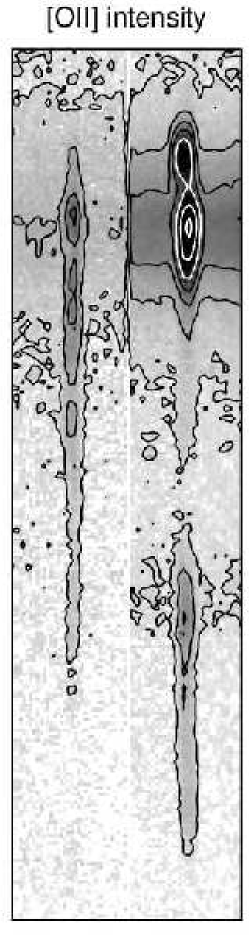
The filament is of low ionization, luminous in the lines of H[NII] and [OII]3727, and emitting less strongly in H[OIII], [NI], [SII] and [OI]. The central slit shows a prominent blueshifted secondary peak of emission to the north of the galaxy, and encompasses the brightest parts of the filament south of the location of the blue clump (which is of course unresolved into the separate knots in our ground-based spectrum) – which itself shows up as a weak continuum in our data (Fig 8). The data from the eastern slit do not include much of the secondary peak in emission to the north, but do ‘fill in’ the upper part of the filament between the blue blob and the dominant galaxy (Fig 8).

In Fig 9 we show the spatial variation of continuum intensity along each slit position in the blue in for two line-free wavebands: 3200-3650Å and 4500-4800Å (in the rest-frame). There are three main concentrations of excess blue continuum; one centred at about 3.8 arcsec to the north of the galaxy core, one at around 1.5 arcsec to the south (these are the ‘lobes’ of blue light lying at the boundaries of the central radio source) and that from the blue clump lying halfway along the emission-line filament at 21 arcsec south. This latter blue continuum feature appears to have a fairly sharp edges. The spectra from the eastern slit show much weaker contrasts in continuum colour, but still catch the edges of the blue structures 4 arcsec to the north and 22 arcsec to the south of the galaxy. The ratio of the fluxes in these bands (blue/red) is also included in the second panel from the top in both Figs 10 and 11.


4.2.1 Emission-line fitting method
The [OII] doublet was fit as single Gaussian (which is an adequate fit at this spectral resolution) using QDP (Tennant 1991), with the continuum represented by a constant (linear only where necessary) function over the (rest) wavelength interval Å. We fit other emission lines together in close sets also using QDP, with [OIII]H fit together, and H[NII][SII]6717,6731[OI]6300,6363 as another set. Within each such fitting set, the individual emission lines are modelled as Gaussian fixed to be at the same redshift and velocity width as each other, with the doublets of [NII] and [OIII] fixed to be in the correct intensity ratios.
To fit the [OIII]H complex, we first scale (at 4640-4840Å) and subtract a galaxy continuum template (created as the mean of twenty-four non line-emitting central cluster galaxies; taken from Crawford et al. 1999) to take into account the H present in absorption in the underlying galaxy starlight. The lines are then fit over the (rest) wavelength range of 4700-5050Å, with no continuum contribution assumed. The subtraction of a scaled galaxy template is not necessary beyond a distance of 30 arcsec south from the galaxy core, as the light from the galaxy becomes negligible. The results from these fits yield our initial results for the emission-line intensities. There is the possibility, however, that the averaged central galaxy template may not represent the H absorption profile correctly in regions with a prominent excess blue continuum; this is particularly true if this blue excess is comprised of stars with prominent Balmer absorption features. This would result in errors in our estimates of the H fluxes. We thus later carry out a check by fitting the [OIII]H emission-line complex at the same time as a full spectral modelling of the blue galaxy continuum (see section 4.2.6).
The red data are first corrected for atmospheric absorption, and then also have a scaled (at 6800-7000Å) template non-cooling flow galaxy continuum subtracted before the emission-line fitting, again to counter the effect of any underlying H in absorption that may be present. Although the H absorption level in the galaxy continuum may again be inaccurate in regions showing strong massive star formation, the effect is expected to be weaker than for the H emission, as the H emission flux is so strong; thus we do not correct for it later. Where the emission lines show clear evidence for two velocity components across the centre of the galaxy (see section 4.2.3), we also model the H+[NII] emission lines by two independent line complexes, each with its own redshift and velocity width.
4.2.2 Results: Line intensity and intensity ratios
The H line emission is distributed very similarly to the [OII] flux, and its variation as a function of distance along the slits is shown in the third panel from the top in Figs 10 and 11 (the intensity plots are from fitting the line emission with only a single velocity component). Other lines, such as the [OIII] and H follow the same distribution, albeit at a lower signal. The central slit shows three distinct peaks of the emission. One is centred about 3.6 arcsec north of the nucleus, comprising the secondary peak to the NW; and the second peak lies just less than 0.4 arcsec south. Both these H peaks are located slightly closer to the nucleus than the blue light lobes (compare to the distribution of the excess blue light shown in the second panel down in this figure). The third brightest region of line emission peaks at 23 arcsec south of the nucleus, slightly further from the central galaxy than the blue continuum clump.
The line emission from the eastern slit ‘fills in’ the northern half of the filament between the blue clump and the main galaxy (ie 2 to 16 arcsec). It is structured into a strong peak just 0.7 arcsec to the north of the galaxy centre, and three clear clumps of H emission between 2 and 8 arcsec south, and another peaked around 12 arcsec south. A final peak of emission is visible right at the tail of the filament, at 36 arcsec south of the galaxy. Most of this structure is apparent in the [OII] image in Fig 8. The H flux from the eastern slit position is around a factor of ten less than that from the central slit position. This partly because it is offset from the brightest part of the galaxy, to where the emission line intensity has greatly dropped, and also partly due to the fact that these second set of observations were taken through conditions of (grey) dust.
The intensity ratios of [NII]6584/H and [SII]6716/H are plotted in the fourth panel from the top in Fig 10 and Fig 11. The [SII]6716/[SII]6731 ratio is shown in the fifth panel only of Fig 11, as it can be plotted only for where the [SII] lines are strongest, within 10 arcsec of the galaxy core. We do not plot the line intensity ratios from the blue data as they should at this stage be treated cautiously for two reasons: firstly, the H emission line is the one most likely to have its intensity affected by the presence of massive young stars; and secondly because the large wavelength separation between [OII] and the [OIII]+H complex means that any intrinsic reddening may mask or mimic changes in ionization. We approach the blue line ratios later as part of the stellar continuum modelling.
4.2.3 Results: Kinematics of the emission-line gas
The bulk of the filament is blueshifted by about compared to the galaxy itself (Fig 10; also see Hu et al 1985), with a sharp decrease to around –200around 7 arcsec south of the galaxy. The radial velocity observed in the part of the filament observed through the eastern slit position is at a slightly higher blueshift, with a clear blue gradient towards the central cluster galaxy, where the emission is offset by as much as –400. The increased velocity width (Fig 10) and clear double structure seen in the profiles of the line emission spanning the nucleus (from to 2.5 arcsec) in the central slit position indicate that (at least) two velocity components are present here. We thus also fit this region with two independent H+[NII] line emission complexes in order to get the relative velocity profiles of the two separate components. The two components are separated by around 400, and both show a sharp redshift jump of about 200between –2 arcsec and the nucleus, and beyond about 3 arcsec north only one velocity component is apparent, that around –400. The northern end of the eastern slit data shows an even more extreme blueshift of around –600.
The full-width at half-maximum (FWHM) of the emission lines is plotted in Figs 10 and 11; for most of the eastern slit position this is fairly constant at around 430across the nucleus and the inner part of the filament, dropping to 260beyond a distance of about 20 arcsec. The velocity width of the filament emission seen through the central slit is highest at large distances (300 to 400at 40 to 30 arcsec south), then declines slightly to around 300over 28 to 10 arcsec south, thus appearing fairly quiescent. The FWHM increases sharply across the central cluster galaxy however, showing three distinct peaks; two weak jumps centred around 2.1 and 4.7 arcsec south, and a strong maximum centred around 0.7 arcsec north, falling away sharply to be just less than 400beyond 1.5 arcsec north.
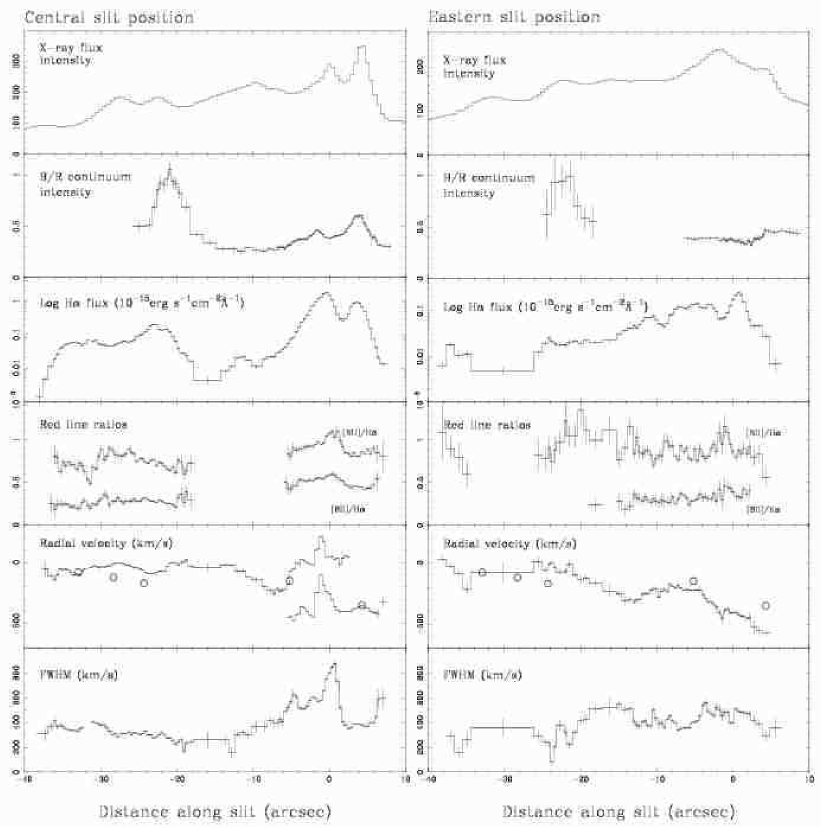
the intensity of the X-ray flux along the slit from the adaptively-smooted image ; the ratio of the blue to the red continuum values (in the passbands given in the caption to Fig 9); the intensity of the H emission line; the intensity ratios of [NII]/H and [SII]/H; the radial velocity of the emission relative to the galaxy nucleus (the large open circles represent values estimated from the kinematic map of Hu et al. 1985); and the FWHM of the H+[NII] lines (all when modelled by only one velocity component),
In all figures, positive distances are to the north of the radio core, negative distances to the south. The -axis scales differ between the left and right panels only for the X-ray flux and the H flux intensities.
In all figures, positive distances are to the north of the radio core, negative distances to the south. The -axis scales differ between the left and right panels only for the X-ray flux and the H flux intensities.
4.2.4 Stellar continuum fitting method
We model the stellar continuum observed across the galaxy and filament, using the blue spectra from the central slit position only. Fitting is carried out within the IRAF SPECFIT package; individual fitting components comprise the template non line-emitting central cluster galaxy spectrum, along with five main-sequence stellar spectra (O5, B5, A5, F5 and G5) to roughly characterize the excess blue continuum, and K5V and K3III stars to help represent the old stellar population. The stellar components were generated from the Kurucz (1979) tables and the spectra were fit over the (rest-) wavelength range of 3300-5050Å. The emission lines of [OII], [OIII], H and H were also included in the fit; as with the QDP fitting, we constrain [OIII]H and H to have the same redshift and velocity width, and now also permit them to be slightly skew in profile and have a small offset in redshift from the stellar continuum. The procedure is iterative; we start by fitting the template central cluster galaxy spectrum along with the intensity of all emission lines, with the redshift, width and skewness of the line freed after the first approximate fit is obtained. We then add all the other stellar components in at an equal weight (at around 1/10th of the level of the template galaxy) and repeat the fitting iterations until there is no significant decrease in . No component is allowed to be negative, and any component that is not required has its normalization automatically set to zero in the fitting programme.
To increase the signal of the spectra being modelled, we divide the
light from the central slit into eight distinct regions which comprise
(moving from south to north):
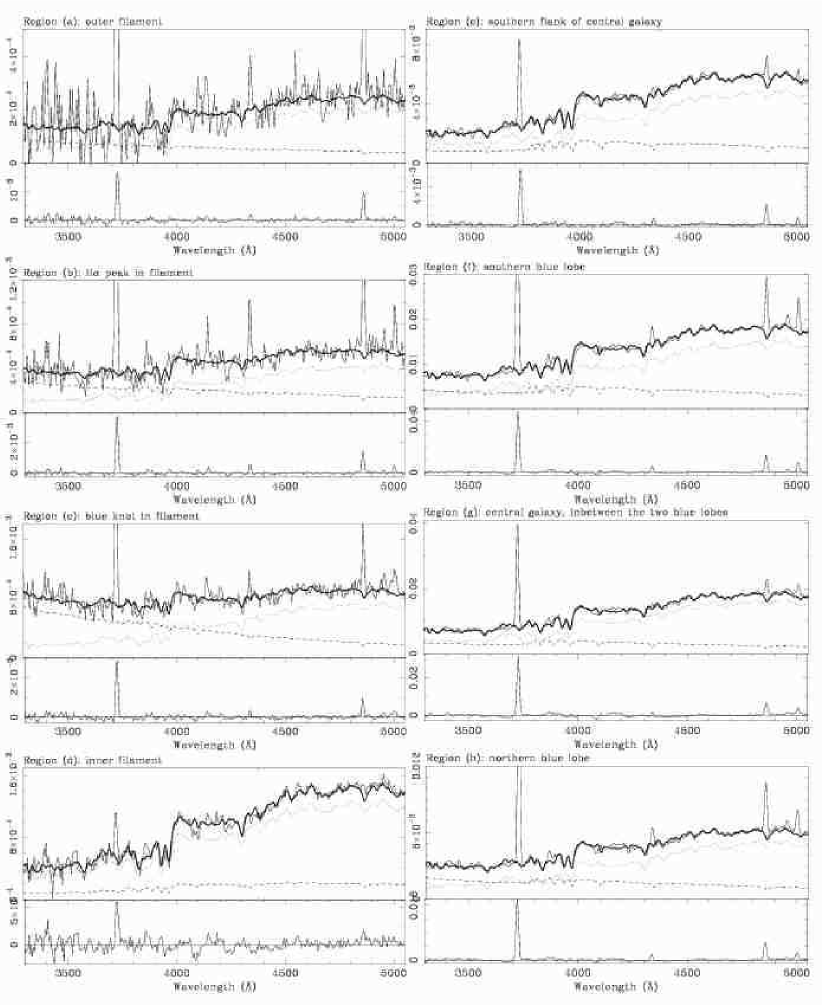
a) –36.5 to –28.3 arcsec (the outer filament);
b) –28.3 to –22.1 arcsec (the emission-line
peak just beyond the blue knots);
c) –22.1 to –18.5 arcsec (the region of the
blue continuum knots);
d) –18.5 –7.7 arcsec (the inner part of the filament);
e) –7.7 to –2.7 arcsec (the southern flank of the central cluster galaxy);
f) –2.7 to 0.2 arcsec (the southern blue lobe);
g) 0.2 to 2 arcsec (the part of the galaxy lying inbetween the two peaks of the line emission );
h) 2 to 6.3 arcsec (and the northern blue lobe).
Our results are, however, subject to an uncertain correction for internal reddening due to dust particles intrinsic to the galaxy. Values of the H/H Balmer decrement from a total spectrum across the central galaxy suggest an average reddening of between E(B-V)=0.15 (within kpc) and E(B-V)=0.43 (within 13 kpc; Crawford et al 1999). We do not apply such an averaged value to our spectra, as the HST (and other) images clearly show the dust to be structured into a band of varying width (Fig 1; Pinkney et al. 1996) that does not always intersect our slit positions. There is also little evidence from these images for dust outside of the core of the dominant galaxy. Whilst we could, in principle, estimate the intrinsic reddening from H and H Balmer decrement, both these emission lines are affected by the Balmer absorption lines present in the blue stellar continuum – H more so than H – and the comparative weakness in the H makes the determination of the E(B-V) from this ratio particularly uncertain. We instead fit the continuum assuming no internal reddening to be present, and assume this represents a safe minimum contribution to the number and type of massive stars present.
4.2.5 Results of stellar continuum fitting
The resulting decomposition of our best model fits into early- and late-type stellar components are given in Table 2. The components are all represented as percentages of the total light at (rest-frame) 4400Å, and the total flux in the spectrum at that point is given in the final column. The best fits to the spectra are also shown in Fig 12.
Despite being up to 37 arcsec away from the core of the galaxy, all the spectral regions require a component of older stars, as modelled by the template galaxy and the K5V and KIII stars. Such a late-type component at large radii should not be surprising, however, given the extensive cD envelope known to surround this central dominant galaxy (Johnstone et al 1991). This is reinforced by the fact that the spatial profile of the 4500-4800Å continuum shown in Fig 9 is non-zero out to beyond 30 arcsec south. The decrease of the flux in the 4500-4800Å band with radius matches well the fall in the flux of the old stellar component in the models with radius. As can be seen in Fig 12, the old stellar component in all the models is very constant at accounting for between 70 and 85 per cent of the flux in this band. Thus the ‘old’ stellar component in all of the model fits appears to be due to the large extent of the underlying galaxy.
The excess blue continuum clump in the filament (region c) is almost entirely comprised of O stars, suggesting an episode of either very recent or ongoing star formation. Interestingly, the two regions in the filament further out from the nucleus (regions a and b, coincident with the H peak and beyond) show a spectrum dominated by O star emission, although with a smattering of lower-mass stars also present. The inner half of the filament shows little in the way of young stars, and the northern and southern blue lobes have an older population of stars than seen in the star formation region in the filament. We note, however, that it is precisely regions f, g and h that would be most affected by dust extinction, so we expect that de-reddening the spectra would show the spectrum in these regions to be likewise dominated by younger stars. Dust extinction is unlikely to affect the star formation in the filament.
4.2.6 Results: the blue line intensities and ratios
We briefly revisit the properties of the blue emission lines, now corrected for any underlying stellar Balmer absorption. The variation in the line intensity along the central slit (Fig 13), as expected, mimics the distribution seen in the H intensity (Fig 10). The blue line intensity ratios, like the red line ratios, show a sharp change in value across the region of the slit encompassing the radio source (Fig 14; note that the absolute value of [OII]/[OIII] is still probably inaccurate though, as we have not made any correction for intrinsic reddening).


| Region | template | O5v | B5-7v | A5v | F5v | G5v | K5v | K3iii | Flux at 4400Å | Description |
|---|---|---|---|---|---|---|---|---|---|---|
| galaxy (%) | (%) | (%) | (%) | (%) | (%) | (%) | (%) | (Å) | ||
| a | 69 | 15 | – | – | 4 | 6 | 4 | 2 | 0.19 | outer filament |
| b | 56 | 18 | 1 | 2 | 11 | 4 | 3 | 5 | 0.49 | H peak in filament |
| c | 64 | 32 | – | 3 | – | 1 | 1 | 1 | 0.80 | blue knots in filament |
| d | 69 | – | 1 | 5 | 1 | 12 | 13 | 1 | 1.11 | inner filament |
| e | 69 | 1 | 2 | 13 | 9 | 1 | 2 | 3 | 4.71 | southern flank of central galaxy |
| f | 73 | 4 | 7 | 5 | 11 | – | – | – | 14.42 | southern blue lobe |
| g | 79 | 3 | 12 | 2 | 4 | – | – | – | 14.14 | galaxy inbetween blue lobes |
| h | 73 | 9 | 6 | 3 | 9 | – | 1 | – | 4.86 | northern blue lobe |
The entries in the table show the percentage contribution by each component to the total light at 4400Å, except for the last column which gives the observed flux of the spectrum at that same point.
5 Discussion
5.1 The immediate environment of the radio jet
5.1.1 The northern radio lobe
As it emerges from the active nucleus, the northern jet of radio plasma appears to displace the intracluster medium. The spatial distribution of both the X-ray gas and the warm ionized gas giving rise to the optical emission lines both show a clear dip in their intensity between 1-2.5 arcsec north in both the images (Fig 1) and in the spectra from along the central slit position (Fig 11). This may well be in part due to the location of the dust lane, which seems to have also been similarly displaced in this direction, along with the molecular gas (Fig 1).
After this displacement – or maybe because of this displacement, if it results in compression of the intracluster medium – the northern radio jet then clearly encounters a dense obstruction at around 2.5 arcsec to the north-west of the active nucleus, causing its sharp deflection to the north-east. Evidence for a direct interaction between the radio jet and a dense cloud is found from the optical spectra over the region of 0–2 arcsec north of the active nucleus in the central slit position. Within this region – coincident with a bright radio knot – there is a noticeable increase in the FWHM of the emission lines, and a very sharp drop in the [SII]/[SII] line ratio from the low-density values implying a hundred-fold increase in the electron density. Other line ratios, such as the [NII]/H, [SII]/H, [OII]/[OIII] and [OIII]H also change to a state of higher ionization in the same region. The spectra thus imply that here that the radio plasma pushes out against the surrounding gas, increasing its ionization state, turbulence and density.
Beyond this point of collision, bright peaks are apparent in the X-ray flux and optical and CO line emission all lying to the outside of the deflected radio lobe. The optical line emission from this peak is no longer turbulent (FWHM of ) but it has a strong blueshift of around , implying that this gas has had a momentum boost from a collision with the radio jet. The CO line emission is also observed to have a similar strong blueshift (of the order of in this region; Salomé & Combes 2004). The Eastern slit position crosses the radio source only at the outer reaches of the northern lobe, and the peak H emission here is complementary to the dip in the line emission seen in the central slit. The velocity of all this emission line gas to the east is substantially blueshifted (up to almost –600 relative to the nucleus) suggesting that this gas has also been displaced by the radio source, and forms the the eastern end of the blueshifted component seen in the central slit position.
Along our central slit position, the X-ray and H peaks clearly lie at the edge of the radio lobe (Fig 11), along with the peak in the blue starlight. The peaks in these three components are not exactly spatially coincident with the CO peak, which is centred around 3.3 arcsec distant from the active nucleus, whereas the H peak lies at 3.60.2 arcsec and the X-ray peak is furthest out at 4.250.5 arcsec. The blue starlight lies between H and X-ray, centred at around 3.8 arcsec. The CO peak is also slightly more west (by about 13 degrees) than the other two peaks (Figs 1 and 11), thus lying closer to the point of impact.
Given the general Z-shaped morphology of the source, it is possible that the radio jets are precessing or oscillating, and thus that the point of impact with the surrounding intracluster medium has been changing with time. The CO peak could then mark the most recent point of impact, where the gas has been compressed but star formation has yet to be initiated. The region of brighter X-ray and H emission might then be associated with an earlier point of contact. Compression of the gas has triggered the observed massive recent star formation, either as a single young starburst or as a continuous and longer-lived period of star formation (Smith et al 1997). The actual interaction may have also caused some mixing of the hot intracluster medium and the warm molecular gas, resulting in soft X-ray and UV ionization that in turn is capable of ionizing the cold clouds to produce the optical line emission in these regions (in addition to any stellar ionization).
5.1.2 The southern radio lobe
The other radio lobe also has a clear kinematic interaction with the warm ionized gas. Emission from the filament dominates south of about arcsec of the active nucleus, but then a second component of gas (as evinced by its different, and blueshifted velocity) becomes apparent just at the outer edge of the southern radio lobe. It is at this point, that the first noticeable increase in linewidth occurs. The (redder) emission from the ‘filament’ component of gas dominates in to the core of the galaxy, but the second blueshifted component continues right across the galaxy, becoming very prominent to the north, eventually forming the north-west peak. The blueshifted line emission is thus entirely associated with the location and properties of the radio source.
Both velocity components show a marked jump in redshift (by 200to the red) at arcsec, just beyond the location of the sharp deflection in the southern radio lobe at –1 arcsec (Fig 11). The pronounced increase in the FWHM (and decrease in the [SII]/[SII] ratio) starts within this region, reaching a maximum (minimum) to the north of the nucleus, before the radio lobe deflection point on that side. The distribution of the H emission seen in our central slit has a very skewed distribution to the south of the nucleus, peaking at –3.50.8 arcsec. Thus, unlike with the northern lobe, it does not seem to have been completely pushed out to lie only along the outside of the radio, although a tail in this peak spans the whole southern radio lobe. The multiwaveband images suggest that there are is also components of optical line emission, CO line emission, and UV light that appear to be extended a short way along the direction of the southern radio lobe (Figs 1 and 2). In contrast, there is X-ray emission across the nucleus and beyond the point of deflection of the southern radio jet, but there is, if anything, a deficit of X-rays associated with the southern radio lobe location. Along our central slit position, the star formation peaks at –1.5 arcsec, again just at the outside of the southern radio lobe.
Thus although the kinematics of the gas suggest that there is some input of turbulence and energy into the warm gas from the southern radio jet, which has in turn triggered star formation, the effects on the distribution and ionization state of the gas are far less pronounced than for the northern jet-cloud interaction.
5.2 The filament
The radio source has a marked influence on the surrounding environment only within about arcsec of the active nucleus. Beyond that, the soft X-ray filament stretches to almost 50 arcsec south of the dominant galaxy, and could show where the X-ray intracluster medium is cooling around the gravitational wake of the central cluster galaxy as it oscillates through the core of the cluster (Fabian et al 2001). This gives us a direct view of cooling within the intra-cluster medium well-removed from the influence of the dominant galaxy and its contained radio source.
In such a situation, the densest regions start to cool most rapidly, becoming the first to collapse and form massive stars (in the absence of any other heating mechanism). The chain of resolved continuum knots centred around –21 arcsec south presumably are stellar clusters resulting from the early collapse of the densest part of the filament. As the light from this region is comprised almost entirely of O stars (Table 2; Mittaz et al 2001), the star formation occurred within the last few tens of millions of years. The strongest clumps of X-ray emission within the filament (centred at 9.8, –22.5 and –27.5 arcsec south of the nucleus) thus trace the less dense regions along the filament that have been cooling more slowly. The strongest H emission peak along the filament coincides with the X-ray peak at around –23 arcsec south. [The field of view of the CO line observations of the central galaxy does not include the filament, so we cannot comment on the location of any molecular gas components along the filament.]
Our simple spectral synthesis shows that the total light (at 4400Å) from the UV knots within the slit is due to over 100 main-sequence O5 stars. Mittaz et al (2001) deduce over ten times more O stars from the UV flux of this region, but they assume an intrinsic reddening appropriate to the central cluster galaxy (), which is unlikely to be appropriate out in the filament. The inferred H luminosity produced by recombination in gas illuminated by 100 O5 stars is (scaling from Allen 1995) a factor of over 100 below the observed H luminosity from the same region of the slit. This discrepancy is exacerbated by the significant spatial offset of 2 arcsec between this region of star formation and the brightest peak of the H line emission. Thus the stars not only fail to provide enough ionization, but they are clearly not in the right location to provide the ionization for the optical line emission.
The bulk of the filament (between 40 to –10 arcsec south) is blueshifted only by around with respect to the central cluster galaxy. Its fairly constant velocity width of implies an r.m.s. velocity of the gas within the filament of around of its mean radial velocity. Thus despite the filament originating from the motion of the dominant galaxy, the gas motions within the filament are not large and turbulent. It is hence unlikely that mixing layers are relevant as a source of ionization. The fact that the soft X-ray luminosity from the filament is only an order of magnitude more luminous than the H+[NII] emission (Fabian et al 2001) compounds the problem. As seen in many of these cooling flow nebulae it is clear that some – and as yet undetermined – source of heat is required to power the optical line emission. Perhaps there is a small amount of energy conducted inwards from the surroundings, or by energetic electrons particles from the hot gas (depending on the magnetic configuration of the filament).
The UV knots are located around 24 kpc south of the current position of the galaxy. If the galaxy is moving through the cluster at a relative rate of (Oergerle & Hill 1994) it would take approximately 66 million years to travel between the UV knots to its present location (or approximately 160 million years if travelling at ). This timescale fits well with the expected lifetime of the star clusters as their light is currently dominated by massive young O stars. A further consequence is that the optical line emission will itself have been around for at least this long, as it will have taken the galaxy around 120 million years to travel its full length (or million years for the slower speed). The length of the filament also shows that the warm emission-line gas is not mixing rapidly in with its surroundings; it is therefore a long-lived feature of the core of this cluster of galaxies.
The accumulated data are therefore consistent with a cooling wake interpretation, provided that gas really is cooling. The Chandra data allow for about cooling from the inner intracluster medium, but we see less than of star formation in the giant filament. The situation in A 1795 resembles that in many cluster cores where the radiative cooling time of the gas is short. The gas temperature ranges down from the outer virial temperature by a factor of about 3 (Peterson et al 2001, 2003) in a manner consistent with the gas cooling, but the gas is not obviously accumulating at that lower temperature nor seen at still lower temperatures. Unless there is an unseen sink of cooled gas, most of the gas must be heated and prevented from collapsing. The exact heating mechanism is not yet identified, although it is likely that the central radio source is involved (e.g. Fabian 2005 and references therein).
An alternative interpretation is that the giant filament consists of cold gas from the central galaxy which has been dragged out. A set of filaments over 40 kpc long is seen going to the North of NGC 1275 in the Perseus cluster (Lynds 1970; Conselice et al 2001). These have mostly probably been dragged out by a buoyant bubble made by the central radio source (Fabian et al 2003). A ‘horseshoe’ shaped filament lying just inside the well-known ghost bubble in the Perseus cluster supports this idea. The small velocity range found here in the giant filament in A 1795 indicates that gas flows must be fairly smooth and laminar and not highly turbulent.
6 Conclusions
The changes in line intensity ratios, radial velocity and velocity widths of the optical emission-line gas provide further evidence supporting the generally-accepted scenario of an interaction between the radio jet and its surrounding intracluster medium, inducing recent massive star formation within the central cluster galaxy. We resolve the light from young star clusters comprised in total of at least 100 O stars, halfway along the filament. At an age of only a few million years, and at a distance of 21 kpc from the central galaxy, these stars are unlikely to have been dragged out of the galaxy. Thus it seems that even well away from the central galaxy and any influence of its radio source, straightforward cooling of the intracluster medium within the filament has resulted in the recent production of modest-sized star clusters. These stars cannot power the H line-emission which requires an (as yet) undetermined heat source. Despite the input of this heating, the filament of A 1795 shows that some of the intracluster medium is able to cool all the way from the hot X-rays to condense to form massive stars. The presence of these star clusters within a cooling filament lends weight to the possibility of a similar origin for the young and luminous star clusters found around the central galaxy NGC1275 in the Perseus cluster of galaxies (Holtzmann et al 1992; Richer et al 1993).
Acknowledgments
CSC and ACF thank the Royal Society for financial support. The William Herschel Telescope is operated on the island of La Palma by the Isaac Newton Group in the Spanish Observatorio del Roque de los Muchachos of the Instituto de Astrofisica de Canarias
References
- [] Allen SW, 1995, MNRAS, 276, 947
- [] Balucinska-Church M, McCammon D, 1992, ApJ, 400, 699
- [] Buote DA & Tsai JC, 1996, ApJ, 458, 27
- [] Cardiel N, Gorgas J, Aragón-Salamanca A, 1998, MNRAS, 298, 977
- [] Cash W, 1979, ApJ, 228, 939
- [] Conselice CJ, Gallagher JS, Wyse RFG, 2001, AJ, 122, 2281
- [] Cowie LL, Hu EM, Jenkins EB, York DG, 1983, ApJ, 272, 29
- [] Crawford CS 2003, in Clusters of Galaxies: Probes of Cosmological Structure and Galaxy Evolution, Carnegie Observatories Centennial Symposia, Carnegie Observatories Astrophysics Series, eds by Mulchaey JS, Dressler A, Oemler A 2004. (http://www.ociw.edu/ociw/symposia/series/symposium3/proceedings3.html)
- [] Crawford CS, Allen SW, Ebeling H, Edge AC, Fabian AC, 1999, MNRAS, 306, 857
- [] Edge AC, 2001, MNRAS, 328, 762
- [] Ettori S, Fabian AC, Allen SW, Johnstone RM, 2002, MNRAS, 331, 635
- [] Fabian AC, 2005, Phil Trans. Roy. Soc., A363, 735
- [] Fabian AC, Sanders JS, Ettori S, Taylor GB, Allen SW, Crawford CS, Iwasawa K, Johnstone RM, 2001, MNRAS, 321, L33
- [] Fabian AC, Sanders JS, Crawford CS, Conselice CJ, Gallagher JS, Wyse RFG, 2003, MNRAS, 344, L43
- [] Ge JP, Owen FN, 1993, AJ, 105, 778
- [] Heckman TM, Baum SA, van Breugel WJM, McCarthy P, 1989, ApJ, 338, 48
- [] Holtzmann JA et al, 1992, AJ, 103, 691
- [] Hu EM, Cowie LL, Wang Z, 1985, ApJS, 59, 447
- [] Johnstone RM, Fabian AC, Nulsen PEJ, 1987, MNRAS, 224, 75
- [] Johnstone RM, Naylor T, Fabian AC, 1991, MNRAS, 248, L18
- [] Kurucz RL, 1979, ApJS, 40, 1
- [] Liedahl DA, Osterheld AL, Goldstein WH, 1995, ApJ, 438, L115
- [] Lynds CR, 1970, ApJ, 159, L151
- [] Markevitch et al 2001 ApJ 563 95
- [] Mazzotta P, Kaastra JS, Paerels FB, Ferrigno C, Colafrancesco S, Mewe R, Forman WR, 2002, ApJ, 567, L37
- [] McNamara BR & O’Connell RW, 1992, ApJ, 393, 579
- [] McNamara BR & O’Connell RW, 1993, AJ, 105, 417
- [] McNamara BR, Wise M, Sarazin CL, Jannuzi BT, Elston R, 1996, ApJ, 466, L9
- [] Mewe R, Gronenschild EHBM, van den Oord GHJ, 1985, A&AS, 62, 197
- [] Mittaz JPD et al 2001, A&A, 365, L93
- [] Molendi S, Pizzolato F, 2001, ApJ, 560, 194
- [] O’Dea CP, Baum SA, Mack J, Koekemoer AM, Laor A, 2004, ApJ, 612, 131
- [] Oergerle WR & Hill JM, 1994, AJ, 107, 857
- [] Peterson JR et al 2001, A&A, 365, L104
- [] Peterson JA et al 2003, ApJ, 590, 207
- [] Pinkney et al 1996, ApJ, 468, L13
- [] Richer HB, Crabtree DR, Fabian AC, Lin DNC, 1993, AJ, 105, 877
- [] Salomé P & Combes F 2004 A&A 415 L1
- [] Smith EP et al 1997, ApJ, 478, 516
- [] Stark AA, Gammie CG, Wilson RW, Bally J, Linke RA, Heiles C, Hurwitz M, 1992, ApJS, 79, 77
- [] Tamura T et al 2001, A&A, 365, L87
- [] Tennant A. F., 1991, NASA Technical Memorandum, 4301
- [] van Breugel WJM, Heckman TM, Miley GK, 1984, ApJ, 276, 79