-
Second Data Release of the 6dF Galaxy Survey
Abstract: The 6dF Galaxy Survey is measuring around 150 000 redshifts and 15 000 peculiar velocities from galaxies over the southern sky at . When complete, it will be the largest survey of its kind by more than an order of magnitude. Here we describe the characteristics of the Second Incremental Data Release (DR2) and provide an update of the survey. This follows earlier data made public in December 2002 and March 2004. A total of 83 014 sources now have their spectra, redshifts, near-infrared and optical photometry available online and searchable through an SQL database at http://www-wfau.roe.ac.uk/6dFGS/.
Keywords: galaxies: statistics, luminosity function—cosmology: large-scale structure
1 Survey Overview
The 6dF Galaxy Survey1116dFGS home: http://www.aao.gov.au/local/www/6df/ (6dFGS; Jones et al. 2004a) is a combined redshift and peculiar velocity survey encompassing all but the most heavily obscured regions of the southern sky. The redshift survey aims to secure 150 000 redshifts across apparent magnitude limited samples complete to (12.75, 13.05, 13.75, 15.60, 16.75). In addition to these, a number of smaller subsamples defined from optical, near-infrared and radio surveys, fill-out fibre allocations the sky over. The peculiar velocity survey is taking the brightest 15 000 E/S0 galaxies and combining their 6dF velocity dispersion measurements with photometric parameters from Two Micron All-Sky Survey (2MASS) near infrared imaging (Jarrett et al. 2000) to yield Fundamental Plane distances and peculiar velocities.
The 6dFGS data are made public at approximately yearly intervals, with Early and First Data Releases having taken place in December 2002 and March 2004 respectively. Released redshift data and associated photometric input catalogues are searchable through an online database222Online database: http://www-wfau.roe.ac.uk/6dFGS/ maintained by the Royal Observatory Edinburgh. In this paper we present the 6dFGS data we are making available for the Second Incremental Data Release (DR2) of the survey and summarise its main attributes.
The wide sky coverage and near-infrared target selection of the 6dFGS set it apart from other redshift and peculiar velocity surveys. Near-infrared selection is most sensitive to the peak of the galaxy spectral energy distribution, which is dominated by old stars that make up most of the stellar mass in the majority of galaxies. Compared to optically-selected samples, which are biased towards younger, star-forming galaxies, the near-infrared selection of the 6dFGS favours older, bulge-dominated galaxies that are the best targets for Fundamental Plane distance determinations. Furthermore, near-infrared selection is minimally affected by extinction due to dust, both internal to the target galaxies and through the plane of our own Galaxy. As a consequence, the orientation of target galaxies is not important, and the 6dF survey fields can cover the entire southern sky apart from a strip around the Galactic plane.
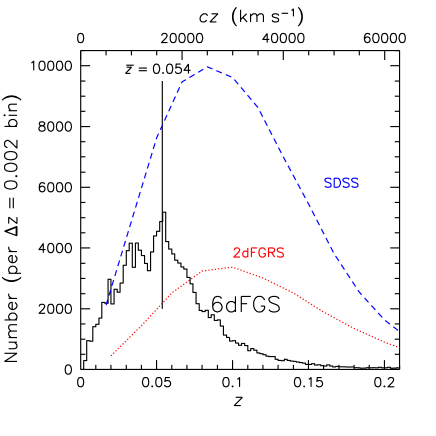
Figure 1 shows the redshift coverage of the 6dFGS compared to the 2dF Galaxy Redshift Survey (2dFGRS; Colless et al. 2001) and the Sloan Digital Sky Survey (SDSS; Blanton et al. 2001; York et al. 2000). In terms of sky coverage, the 6dF Galaxy Survey will ultimately cover 8 times the area of 2dFGRS and twice that of SDSS. In terms of sample size, the 6dFGS will yield two-thirds as many galaxy redshifts as 2dFGRS and one-fifth as many as SDSS. Both of these deeper surveys have median redshifts double that of the median for 6dFGS. While these surveys have greatly advanced our knowledge of the local universe, many questions are more readily addressed by a survey such as 6dF that yields both galaxy mass and velocity together.
| id | Sample (Contact, Institution) | Weight | Total | Coverage |
|---|---|---|---|---|
| 1 | 2MASS (Jarrett, IPAC) | 8 | 113988 | 94.1% |
| 3 | 2MASS (Jarrett, IPAC) | 6 | 3282 | 91.8% |
| 4 | 2MASS (Jarrett, IPAC) | 6 | 2008 | 92.7% |
| 7 | SuperCOSMOS (Read, ROE) | 6 | 9199 | 94.9% |
| 8 | SuperCOSMOS (Read, ROE) | 6 | 9749 | 93.8% |
| 90 | Shapley (Proust, Paris-Meudon) | 6 | 939 | 85.7% |
| 113 | ROSAT All-Sky Survey (Croom, AAO) | 6 | 2913 | 91.7% |
| 119 | HIPASS () (Drinkwater, Queensland) | 6 | 821 | 85.5% |
| 126 | IRAS FSC (Saunders, AAO) | 6 | 10707 | 94.9% |
| 5 | DENIS (Mamon, IAP) | 5 | 1505 | 93.2% |
| 6 | DENIS (Mamon, IAP) | 5 | 2017 | 61.7% |
| 116 | 2MASS AGN (Nelson, IPAC) | 4 | 2132 | 91.7% |
| 129 | Hamburg-ESO Survey (Witowski,Potsdam) | 4 | 3539 | 90.6% |
| 130 | NRAO-VLA Sky Survey (Gregg, UCDavis) | 4 | 4334 | 87.6% |
| Total | 167133 | 93.3% |
Table 1 is from Jones et al. (2004a) and summarises the breakdown of source catalogues contributing to the master target list. Also shown is the relative weighting (priority) given to each sample in the target allocation process, and the maximum coverage expected for each survey given that field allocation. These coverage fractions are theoretical values which will be reduced by fibre-breakage rates in practice, particularly for lower priority programmes. In total there are 167 133 objects allocated, of which two-thirds are in the near-infrared-selected sample.
Jones et al. (2004a) describe the main facets of the 6dF Galaxy Survey,
including the Six-Degree Field instrument, target catalogue
construction, and the allocation of fields and fibres to targets.
The data reduction and redshifting procedures are also described,
along with the main characteristics of the data comprising the
First Data Release. The interested reader is referred to this paper
for detailed information about the 6dFGS. Campbell, Saunders & Colless (2004)
describe the algorithm used to optimise the placement of field centres
with respect to the galaxy distribution on the sky. A series of
AAO Newsletter articles trace the history of the 6dF instrument
(Watson 1998; Watson et al.1999; Saunders et al. 2001),
target selections (Saunders et al. 2003; Mauch 2002),
online database (Read et al. 2003) and First Data Release (Saunders et al. 2004).
Various conference proceedings give further information about the
instrument (Parker, Watson & Miziarski 1998; Watson et al. 2000), survey aims (Wakamatsu et al. 2003; Colless et al. 2003) and First Data Release (Jones et al. 2005).
All of these references can be found together on the 6dFGS
Publications Page333Publications:
http://www.aao.gov.au/local/www/6df/publications.html.
The 6dFGS -band luminosity function (LF; Jones et al. 2005, Jones et al., in prep), shows excellent agreement with earlier work using 2MASS with 2dFGRS (Cole et al. 2001), ZCAT (Kochanek et al. 2001) and SDSS (Bell et al. 2003). Considering the precision of these modern LFs and the influence of such factors as sky coverage and nearby large-scale structures, the level of agreement is remarkable. Other near-infrared and optical luminosity functions from 6dFGS for (Jones et al.) also show good agreement.
The 6dFGS is being utilised for a variety of other programmes, including:
-
•
Study of the AGN and QSO populations from 2MASS (Francis et al., ANU; Cutri et al., Caltech).
-
•
Radio-selected samples (Mauch and Sadler, Sydney; Mamon, IAP; Doyle and Drinkwater, Queensland).
-
•
Galaxy ages and metallicities (Proctor and Forbes, Swinburne; Lah, ANU; Colless, AAO).
-
•
Southern sky peculiar velocity survey (Campbell and Colless, AAO; Lucey, Durham),
-
•
Galaxy groups, nearby superclusters and voids (Brough, Kilborn and Forbes, Swinburne; Wakamatsu, Gifu; Johnston-Hollitt et al., Tasmania).
-
•
Large-scale structures and clustering (Lahav and Rassat, UCL; Fairall et al., Cape Town).
In Section 2 we summarise the scope and features of the Second Incremental Data Release for the 6dFGS. Section 3 outlines caveats and cautions that users should bear in mind when using the data. Comments regarding the survey timeline from now until completion are given Section 4.
2 Second Data Release
2.1 Scope of DR2
The Second Incremental Data Release (DR2) for the 6dF Galaxy Survey spans observations during the period January 2002 to October 2004, including and superceding DR1. It contains 89 211 spectra that have yielded 83 014 unique galaxy redshifts over roughly two-thirds of the southern sky. Within these sets, the number of database spectra with acceptable quality redshift is 76 443, where ‘acceptable’ means quality parameter or 4 (see Jones et al. 2004a). The number of unique redshifts is 71 627. As discussed below, only redshifts with or 4 should be used for extragalactic science.
Extragalactic redshifts are ranked on a quality scale of to 4 by human operators, according to the definitions given in Sec. 4.4 of Jones et al. (2004a). represents spectra of no value, for tentative redshift values, for probable redshifts and for reliable redshifts. Only or 4 redshifts should be used for astrophysical applications, although some QSOs classified earlier in the survey will have a because no QSO template existed at the time to confirm the redshift Recently a new category, , was introduced and this is discussed in Sect. 3.2.
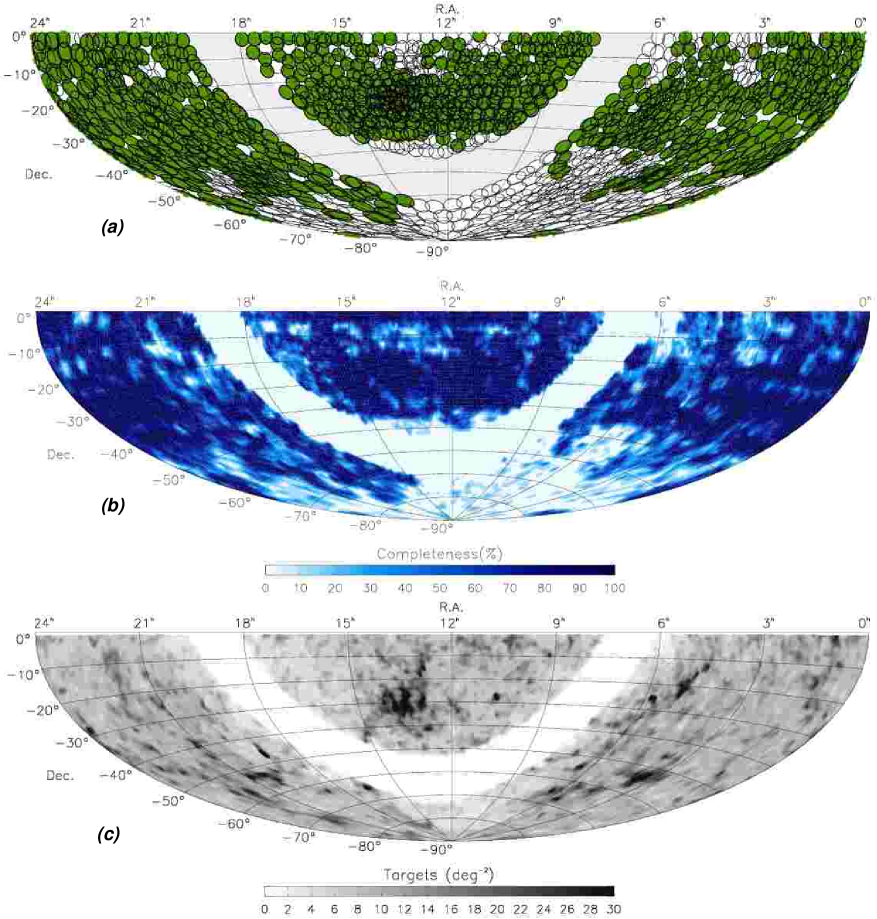
DR2 takes its data from 936 fields. Figure 2() shows that their distribution is true to observing strategy adopted by 6dFGS from the outset: mid-latitude fields were tackled first, followed by those nearest the equator and finished with the polar targets. Field coverage along the central declination strip is largely complete, as is coverage of the equatorial band, save for regions around 11 – 13 hr and 03 – 06 hr right ascension. The former is a region already covered extensively by the SGP region of the 2dF Galaxy Redshift Survey (Colless et al. 2001). Substantial progress has also been made on some of the polar fields, which have been included in DR2.
Figure 2() shows the distribution of galaxy redshift completeness on the sky. This is the fraction of galaxies in the original target catalogue with acceptable ( or 4) extragalactic redshifts, either new from 6dFGS or existing literature ones. Variations in completeness at this stage in the survey are dominated by variable observing conditions, since it is only in the final stages of the survey that virgin fields become sparse enough to allow re-observing fields with low completeness. Figure 2() shows the density of 6dFGS targets on the sky. The variation of source density is a major challenge. The strategies devised to handle this are described elsewhere (Jones et al. 2004a; Campbell, Saunders & Colless 2004).
Another measure of survey efficiency is field completeness, shown in Fig. 3. The field completeness is the number of or 4 extragalactic redshifts from all targets in a field, and as such, only applies to redshifts from 6dF. This shows little change from DR1: about 80 per cent of all fields are 80 per cent complete or more, and more than half have completeness in excess of 85 per cent.

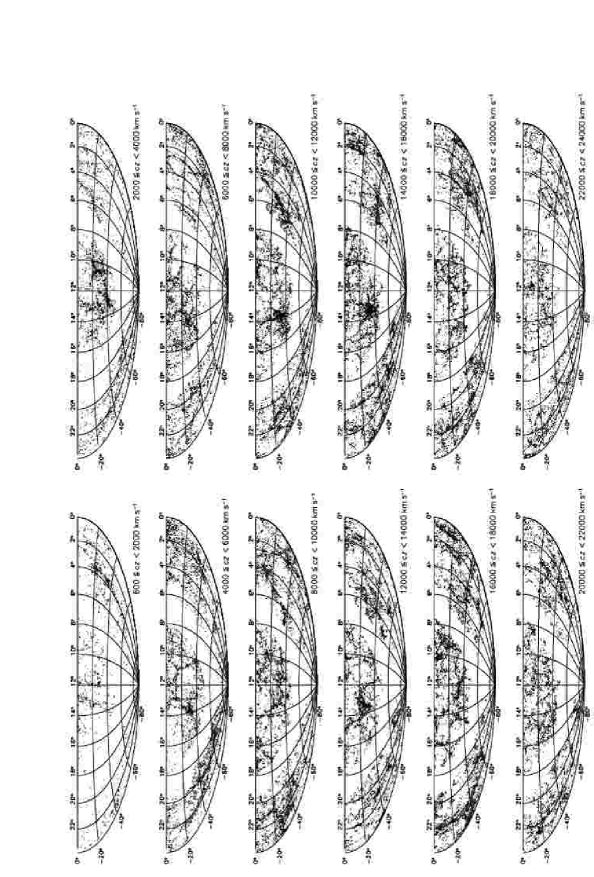
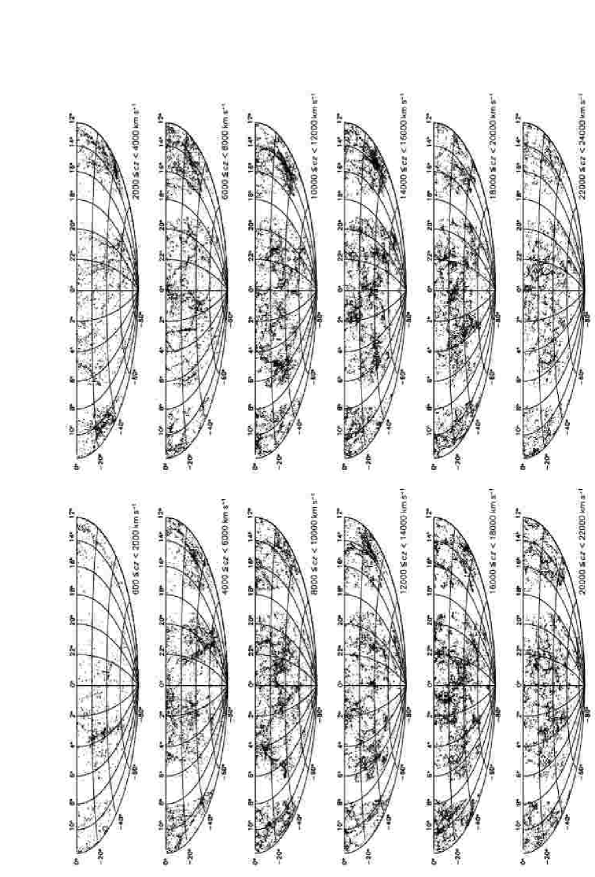
Figures 4 and 5 show the distribution of DR2 redshifts on the sky. They show many local large-scale structures, such as the Shapley and Hydra-Centaurus Superclusters; this is the most detailed and comprehensive view of the southern local universe to date.
2.2 Online Database
The 6dF Galaxy Survey Online Database444Online database: http://www-wfau.roe.ac.uk/6dFGS/ is maintained by the Wide Field Astronomy Unit of the Institute for Astronomy, University of Edinburgh. The site has been operating since an early 6dF data release in 2002 December of 17 000 redshifts. This was followed by the First Incremental Data Release of 6dFGS data in March 2004 (DR1), which increased the online catalogue to 52 048 measured spectra. This paper marks the Second Data Release; a third and final release will be made available on completion of the survey.
The database is based on the format of the 2dFGRS database and uses Microsoft’s SQL Server 2000. Each survey object has a corresponding multi-extension FITS file containing postage-stamp images of the object in and its 6dF-measured spectrum. Structured Query Language (SQL) is used to interrogate the database and extract its contents.
Fuller descriptions of the database can be found in Sec. 5.2 of Jones et al. (2004a) and Read et al. (2003). What follows here is a summary of its main features.
| Table name | Description | Programme |
| ID Numbers | ||
| TARGET | the master target list | progid |
| SPECTRA | redshifts and observational data | |
| TWOMASS | 2MASS input catalogue , , and | 1, 3, 4 |
| SUPERCOS | SuperCOSMOS bright galaxies and | 7, 8 |
| FSC | sources from the IRAS FAINT Source Catalogue | 126 |
| RASS | candidate AGN from the ROSAT All-Sky Survey | 113 |
| HIPASS | sources from the HIPASS HI survey | 119 |
| DURUKST | extension to Durham/UKST galaxy survey | 78 |
| SHAPLEY | galaxies from the Shapley supercluster | 90 |
| DENISI | galaxies from DENIS | 6 |
| DENISJ | galaxies from DENIS | 5 |
| AGN2MASS | candidate AGN from the 2MASS red AGN survey | 116 |
| HES | candidate QSOs from the Hamburg/ESO Survey | 129 |
| NVSS | candidate QSOs from NVSS | 130 |
| SUMSS | radio source IDs from SUMSS and NVSS | 125 |
Data are grouped into several tables, listed in Table 2. At its heart is the TARGET table, which contains the master target list used to define 6dFGS observations. Every table is linked through the parameters TARGETID and TARGETNAME which, although unique in the TARGET table, are not necessarily unique in the others (for example, some objects have been observed more than once). The 6dFGS parameterised spectral data comprising the redshift measurements and observational meta-data are held in the SPECTRA table. The other tables constitute related source catalogues (and their photometric data) that are used to define the various target subsets summarised in Table 1.
In the TARGET tables there are 4 177 sources, 5 347 with redshifts and 70 391 with . In the SPECTRA table, however, there are multiple observations of the same redshift: 7 855 for , 6 031 for and 70 047 for . In addition, there are 4 865 value-less spectra which are kept only for archival purposes and 292 recent Galactic sources (). There are many more confirmed Galactic sources with and noted with a comment.
TARGETNAME.FITS is the name given to the multi-extension FITS file holding all the data for a given target. Postage-stamp FITS images are held in the first five extensions, from and SuperCOSMOS scans and , and 2MASS imaging respectively. As 6dF spectra are measured and then ingested into the database, this information is held in FITS extensions six to eight, holding the V, R and VR-combined spectra respectively. Repeat observations (if any), are appended in the form of further FITS extensions. Jones et al. (2004a) describe this arrangement in more detail.
The database can be queried in one of two ways. One web-based form allows the user to make a number of basic selections from a number of common operations. Another form permits users conversant in SQL to construct their own query directly. Users are also able to upload a list of objects and cross-match this with the 6dFGS observations. Output is available as an HTML page returned directly to the user, a downloadable file, and/or a TAR file of FITS data. Several examples of database access are provided on the web site555 http://www-wfau.roe.ac.uk/6dFGS/examples.
2.3 Changes Since DR1
The structure of the database and the data within are largely unchanged since DR1. However, improved derivations for and galaxy photometry have led to the introduction of two new magnitude parameters in the TARGET table: BMAGSEL and RMAGSEL. These hold the old and magnitudes used to select the 6dFGS samples in these bands and formerly held by the BMAG and RMAG parameters. The BMAG and RMAG parameters remain, although, the magnitudes they now hold are from the improved and photometry introduced for the first time in DR2.
The new magnitudes result
from a significant improvement in the photometric calibration of the
photographic plate material. The original SuperCOSMOS magnitudes used to
select the optical samples suffer from scatter in the field-to-field
zeropoints of some tenths of a magnitude. In 2003, J. Peacock,
N. Hambly and M. Read re-calibrated all of the , (and
) SuperCOSMOS magnitudes to a common zeropoint. This
recalibration work was originally done for the 2dFGRS and is described
on the 2dFGRS web site6662dFGRS photometric calibration:
http://www2.aao.gov.au/2dFGRS/Public/Release/PhotCat/photcalib.html
The resulting zeropoint scatter has now been reduced to a few hundredths
of a magnitude (J. Peacock, priv. comm.). Neither the old nor new
magnitudes have been corrected for Galactic extinction. The old
magnitudes must be used when considering the selection of the optical
samples, but the new magnitudes are otherwise preferred.
Pairing the recalibrated photographic magnitudes with the 6dFGS targets is not a straightforward process, particularly for the brighter sources. A typical scenario will be that the target position will be paired with several objects in a given SuperCOSMOS/UK Schmidt Telescope passband. For example, these objects could be the parent object plus several daughter objects. As the targets are bright and will often have structure it is likely that the parent is the optimum object to get the magnitude for. In other cases the parent will be a star/galaxy, galaxy/galaxy or star/star blend, and the correct object is one of the daughters.
We have adopted an empirically-derived scheme that uses both proximity, magnitude and blend parameter to assign identifications and classify the match. Of the 179 262 target sources put through the -matching exercise, 44 per cent had both proximity and magnitude rankings of 1. Of the remainder, 48 per cent had either a proximity or magnitude rank of 1, 7 per cent had neither ranked as 1, and 1 per cent had no match at all. The corresponding numbers for -matching were around 46, 46, 7 and 1 per cent.
The non-matches fall into a few categories. Most are very bright objects, which in some cases have also been deblended into multiple targets by 2MASS. Some are to 17 galaxies that lie near satellite trails. Others are bright objects with poor deblending, globular clusters, 30 Doradus in the LMC, and other extended sources; a few are blank bits of sky. The null value assigned to BMAG and RMAG in the case of non-matches is 0.00. Figure 6 shows examples where the SuperCOSMOS deblending has led to incorrect 6dFGS target-matching.
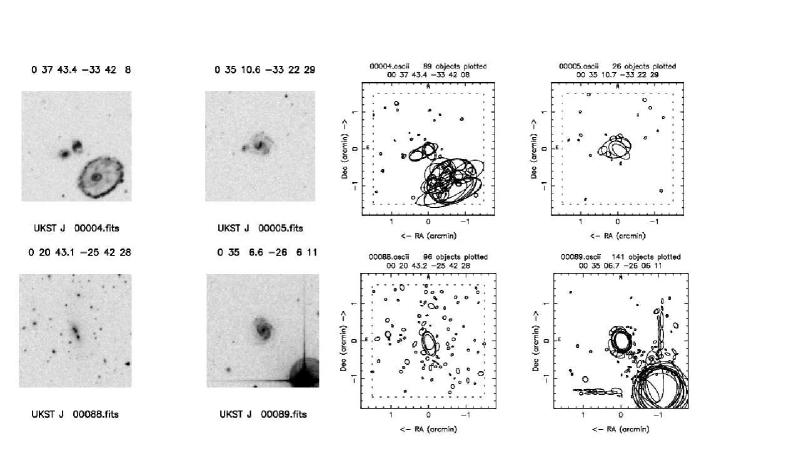
Users of the 6dFGS database should take account of these limitations and treat this preliminary matching with care. The matching algorithm will be further refined for the final survey data release.
The only other changes to the database are improved descriptions for some of the table parameters.
3 Caveats and Limitations
3.1 Spectral Data
With the 6dFGS still underway at the time of DR2, users should be mindful that DR2 is an intermediate data release. Just as DR2 is a significant improvement on DR1, so the quality, precision and reliability of the survey data will be further refined before the final data release at the completion of the survey.
Sec. 4.3 of Jones et al. (2004a) discusses in depth some of the typical problems that can afflict the spectral data. Generally, the splicing of V and R spectral data is acceptable, with the exception of a small number of cases. The effects of strong fringing are occasionally evident in the form of an oscillating spectral response. In some cases, the quality of the V and R data are significantly different, usually with the V being worse because of the lower counts in that spectral range. While it is possible in principle to derive redshifts from V or R halves alone, no half-data have been included in DR2.
Users should also be aware of spurious spectral features around 4440 Å in V, and 6430 and 6470 Å in R. These are due to ghost reflections caused by the VPH gratings, which have been used continuously from 2002 September onwards. These features are typically pixels wide.
Occasionally, poorly spliced data will show a spurious feature at the spectral join around 5570 Å.
Flux calibration of spectra remains highly approximate and users are discouraged from using the database for spectrophotometric applications. Sec. 4.2 of Jones et al. (2004a) outlines the spectral reduction steps and how they affect the final spectra.
Fibre cross-talk can occur when light from bright stars or Galactic emission-line sources finds its way into parked fibres. The bright spectral features contaminate adjacent spectra, causing spurious features. We strongly advise that any peculiar object spectra discovered by users are checked for this effect. To this end, we have made available the fully-reduced 2-d frames of spectra in the Downloads section of the Online Database.
3.2 Redshifts
For data from 2004 August onwards, a new version of the redshifting software was used that introduced some changes worth noting. First, only sources with an initial software-assigned -value of 3 or less were inspected by eye. While greatly increasing the efficiency of redshifting the spectra, the original configuration of the software resulted in 38 spurious high redshift sources that are in fact more likely misclassified low redshift sources. For DR2, these sources have been flagged and re-assigned ; they will be redshifted again manually at a later date. The software is now run in a different configuration that flags sources falling into this category.
The second software change affecting post-August 2004 data is that confirmed Galactic sources (stars, ISM Balmer-line emission, planetary nebulae, and the like) are now assigned . Before this, they had been given and their nature noted in a separate comment. Either way, all acceptable extragalactic redshifts have or 4. The two schemes will be unified for the final data release.
A final change to the software was the introduction of a QSO template, which has dramatically improved the successful identification of the higher redshift QSOs uncovered by the survey.
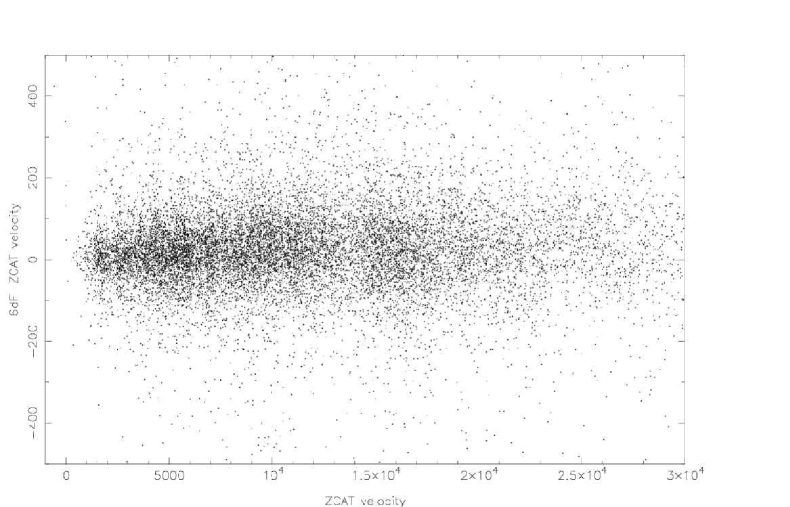
To check the precision of the redshifts we compared a sample of 16 127 6dFGS galaxies with previous redshifts from Huchra’s ZCAT Catalog (Fig. 7). The mean offset was km s-1. Repeat measurements indicate that most of the scatter is due to the ZCAT sample, for which the source material is highly inhomogeneous.
3.3 Photometry
We have already discussed the limitations of the matching algorithm used to pair the recalibrated and SuperCOSMOS magnitudes with 6dFGS targets in instances where source deblending fails. The sources to watch are those that are either bright (), or have one or more neighbours. Even for isolated targets, deblending may still be an issue if the source is a bright spiral galaxy with genuine clumpy structure. In general, users are urged to treat the optical photometry with caution.
4 Summary
We have described the Second Incremental Data Release (DR2) for the 6dF Galaxy Survey and its access through an online database. We have discussed several issues affecting data quality and underscored the preliminary and evolving nature of the data set. We urge potential users of the data set to familiarise themselves with these caveats and with the changes implemented since previous data releases.
Observing for the 6dFGS will nominally finish on 31 July 2005, although some clean-up observations may occur after that date. A third and final data release will be made sometime in 2006.
Acknowledgments
We are grateful to the staff of the Anglo-Australian Observatory, who were responsible for the design and construction of the 6dF instrument. AAO support for the 6dF Galaxy Survey continues in the form of the observing and data reduction done by staff of the UK Schmidt Telescope, without whom the project would not have been possible. We also thank E. Westra, M. Williams, V. Safouris, and S. Prior for their ongoing efforts in measuring redshifts from the survey. D. H. Jones is supported as a Research Associate by Australian Research Council Discovery–Projects Grant (DP-0208876), administered by the Australian National University.
References
- Bell et al. (2003) Bell, E. F., McIntosh, D. H., Katz, N., Weinberg, M. D., 2003, ApJS, 149, 289
- Blanton et al. (2001) Blanton, M. R., Dalcanton, J., Eisenstein, D., Loveday, J., Strauss, M. A., SubbaRao, M., Weinberg, D. H., Anderson, J. E., et al., (SDSS team), 2001, AJ, 121, 2358
- Cole et al. (2001) Cole, S., Norberg, P., Baugh, C. M., Frenk, C. S., Bland-Hawthorn, J., Bridges, T., Cannon, R., Colless, M., et al., (2dFGRS team), 2001, MNRAS, 326, 255
- Campbell, Saunders & Colless (2004) Campbell, L., Saunders, W., Colless, M., 2004, MNRAS, 350, 1467
- Colless et al. (2001) Colless, M., Dalton, G., Maddox, S., Sutherland, W., Norberg, P., Cole, S., Bland-Hawth , J., Bridges, T., et al., (2dFGRS team), 2001, MNRAS, 328, 1039
- Colless et al. (2003) Colless, M., et al. 2003, in Maps of the Cosmos, IAU Symp. no. 216, held 14-17 July 2003, Sydney, Australia, p 191
- Jarrett et al. (2000) Jarrett, T. H., Chester, T., Cutri, R., Schneider, S., Skrutskie, M., Huchra, J. P., 2000, AJ, 119, 2498
- Jones et al. (2004a) Jones, D. H., Saunders, W., Colless, M., Read, M. A., Parker, Q. A., Watson, F. G., Campbell, L. A., Burkey, D., et al., 2004a, MNRAS, 355, 747
- Jones, Colless & Saunders (2004b) Jones, H., Colless, M., Saunders, W., 2004b, Anglo-Australian Observatory Newsletter, 106, 6
- Jones et al. (2005) Jones, D. H., Saunders, W., Colless, M., Read, M., Parker, Q., Watson, F., Campbell, L. A., 2005, in Fairall A., Woudt P., eds., ASP Conf Ser., Large Scale Structure and the Zone of Avoidance, Astron. Soc. Pac., San Francisco, in press
- Kochanek et al. (2001) Kochanek, C. S., Pahre, M. A., Falco, E. E., Huchra, J. P., Mader, J., Jarrett, T. H., Chester, T., Cutri, R., et al., 2001, ApJ, 560, 566
- Mauch (2002) Mauch, T., 2002, Anglo-Australian Observatory Newsletter, 99, 10
- Parker, Watson & Miziarski (1998) Parker, Q. A., Watson, F. G., Miziarski, S., 1998, in Arribas S., Mediavilla E., Watson F., eds., ASP Conf Ser. Vol 152, Fiber Optics in Astronomy III. Astron. Soc. Pac., San Francisco, p 80
- Read et al. (2003) Read, M., Colless, M., Saunders, W., Watson, F., and the 6dFGS Team, 2003, Anglo-Australian Observatory Newsletter, IAU Special Edition, 13
- Saunders et al. (2001) Saunders, W., Parker, Q., Watson, F., Frost, G., Farrell, T., Gillingham, P., Hingley, B., Muller, R., et al., 2001, Anglo-Australian Observatory Newsletter, 97, 14
- Saunders et al. (2003) Saunders, W., Colless, M., and the 6dFGS Team, and the AAT Site Staff, 2003, Anglo-Australian Observatory Newsletter, IAU Special Edition, 9
- Saunders et al. (2004) Saunders, W., Jones, H., Read, M., Campbell, L., Colless, M., Hartley, M., Cass, P., James, D., et al., 2004, Anglo-Australian Observatory Newsletter, 104, 16
- Wakamatsu et al. (2003) Wakamatsu, K., Colless, M., Jarrett, T., Parker, Q., Saunders, W., Watson, F., 2003, IAU Regional Assembly,ASP Conf. Proc., 97
- Watson (1998) Watson, F., 1998, Anglo-Australian Observatory Newsletter, 85, 11
- (20) Watson, F., and the 6dFGS Team, 1999, Anglo-Australian Observatory Newsletter, 90, 15
- Watson et al. (2000) Watson, F. G., Parker, Q. A., Bogatu, G., Farrell, T. J., Hingley, B. E., Miziarski, S., 2000, in Iye M., Moorwood A. F., eds., Proc. SPIE Vol. 4008, Optical and IR Telescope Instrumentation and Detectors, SPIE, Bellingham, WA, p. 123
- York et al. (2000) York, D. G., Adelman, J., Anderson, J. E., Anderson, S. F., Annis, J., Bahcall, N. A., Bakken, J. A., Barkhouser, R. et al., (SDSS team), 2000, AJ, 120, 1579