X-ray Bursts from the Transient Magnetar Candidate XTE J1810197
Abstract
We have discovered four X-ray bursts, recorded with the Rossi X-ray Timing Explorer Proportional Counter Array between 2003 September and 2004 April, that we show to originate from the transient magnetar candidate XTE J1810197. The burst morphologies consist of a short spike or multiple spikes lasting 1 s each followed by extended tails of emission where the pulsed flux from XTE J1810197 is significantly higher. The burst spikes are likely correlated with the pulse maxima, having a chance probability of a random phase distribution of 0.4%. The burst spectra are best fit to a blackbody with temperatures 48 keV, considerably harder than the persistent X-ray emission. During the X-ray tails following these bursts, the temperature rapidly cools as the flux declines, maintaining a constant emitting radius after the initial burst peak. During the brightest X-ray tail, we detect a narrow emission line at 12.6 keV with an equivalent width of 1.4 keV and a probability of chance occurrence less than 4 10-6. The temporal and spectral characteristics of these bursts closely resemble the bursts seen from 1E 1048.15937 and a subset of the bursts detected from 1E 2259586, thus establishing XTE J1810197 as a magnetar candidate. The bursts detected from these three objects are sufficiently similar to one another, yet significantly different from those seen from soft gamma repeaters, that they likely represent a new class of bursts from magnetar candidates exclusive (thus far) to the anomalous X-ray pulsar-like sources.
1 Introduction
Originally grouped into two distinct, empirically-defined classes, Anomalous X-ray Pulsars (AXPs) and Soft Gamma Repeaters (SGRs) are now widely recognized as fundamentally the same type of object. Historically, some of the salient properties of AXPs include spin periods within a narrow range (512 s), rapid spin-down rates ( s s-1), X-ray luminosities within the range 10 ergs s-1, soft energy spectra most often characterized by the sum of a power-law and blackbody, and very dim optical/IR counterparts. The defining property of SGRs was their emission of brief (0.1 s), luminous (1038 ergs s-1) X-ray bursts. Two notable similarities drawn between AXPs and SGRs in recent years that have in large part established the connection between the two classes were the discovery of X-ray pulsations and rapid spin down in two SGRs (Kouveliotou et al. 1998, 1999; Hurley et al. 1999), a defining AXP trait, and the discovery of bright X-ray bursts from two AXPs (Gavriil, Kaspi & Woods 2002; Kaspi et al. 2003), a defining SGR trait. These two classes of isolated neutron stars have each been identified as probable manifestations of highly magnetized neutron stars (i.e. magnetars) whose bright X-ray emission is powered by the decay of their strong magnetic fields of the order of 1015 Gauss at the stellar surface (Thompson & Duncan 1995, 1996). Hereafter, we will refer to AXPs and SGRs collectively as magnetar candidates. For a recent review of these objects, see Woods & Thompson (2004).
The most recent addition to the small (11 confirmed), but growing class of magnetar candidates, XTE J1810197, was discovered in 2003 July (Ibrahim et al. 2004), interestingly enough, during a target-of-opportunity Rossi X-ray Timing Explorer (RXTE) observation of another magnetar candidate nearby on the sky (SGR 180620). The X-ray emission from XTE J1810197 was found to be spectrally soft and pulsed with a period of 5.54 s. Additional RXTE observations showed that the flux from XTE J1810197 was decaying, the pulsar was spinning down rapidly, and there was no evidence for orbital Doppler shifts due to a binary companion (Markwardt et al. 2003). Based upon these characteristics, the new X-ray source was tentatively identified as a transient AXP.
A subsequent ToO observation of XTE J1810197 with XMM-Newton showed that the source had a typical AXP energy spectrum with a blackbody temperature of 0.7 keV and a power-law photon index 3.7 (Gotthelf et al. 2004). The location provided by a ToO Chandra observation showed that this source has been present in archival X-ray observations dating back to 1980, albeit at a flux level some two orders of magnitude dimmer and with a softer energy spectrum (Gotthelf et al. 2004). This level of variability is extreme within the class of magnetar candidates, but not unprecedented (e.g. SGR 162741 [Kouveliotou et al. 2003] and the AXP candidate AX J18450258 [Vasisht et al. 2000]). The sub-arcsecond Chandra location also led to the discovery of the likely IR candidate to XTE J1810197 with properties closely resembling those of the other known AXPs (Israel et al. 2004).
Here, we report the definitive evidence for the identification of XTE J1810197 as a magnetar candidate. We have discovered four X-ray bursts from the source recorded during RXTE observations of this region. We report on the temporal and spectral properties of these bursts and show that they most closely resemble bursts seen from other magnetar candidates, in particular, 1E 1048.15937 (Gavriil et al. 2002, 2005) and 1E 2259586 (Gavriil et al. 2004). Finally, we discuss the possibility that a new class of magnetar candidate bursts is emerging whose characteristics include long durations, a temporal correlation of the bursts with the peak of the pulsed X-ray emission, and a spectral hardness versus burst intensity correlation.
2 RXTE Observations
We have been monitoring XTE J1810197 with RXTE since 2003 through a combination of dedicated observations pointed directly at the source and observations of two nearby objects. The two nearby X-ray sources monitored separately with RXTE, SGR 180620 and PSR J18111925, are 0.74 and 0.49 degrees offset in angle from the transient magnetar candidate, well within the 1.1 degree radius (zero response) Proportional Counter Array (PCA [Jahoda et al. 1996]) field-of-view (FOV). Here, we report on our burst search through PCA data from all RXTE observations containing XTE J1810197 between 2003 January and 2004 September. Over this time interval, the source was observed numerous times for a total exposure of 791 ks. Analysis of the persistent and pulsed emission from XTE J1810197 for a subset of these data is presented in Ibrahim et al. (2004). A detailed analysis of the full data set will be presented elsewhere.
3 X-ray Bursts from XTE J1810197
While filtering out bursts from a ToO observation of SGR 180620 carried out on 2004 February 16, we noted that one of the 11 bursts detected during this observation lasted 2 s and was followed by an X-ray tail lasting several hundred seconds (Figure 1). X-ray tails or burst afterglows have been detected in several magnetar candidates (e.g. Woods et al. 2004), so, in principle, this was not unexpected behavior from the SGR. In fact, we have detected X-ray tails following two separate bursts from SGR 180620 (Woods et al. in preparation) whose associations with that source were confirmed by Inter-Planetary Network (IPN) locations. However, an unusual property of the burst/afterglow pair observed on 2004 February 16 was the relatively small fluence of the burst compared with the fluence of the afterglow (1:6 in terms of total counts). The other two afterglows with bursts confirmed to have come from SGR 180620 had burst-to-afterglow fluence ratios several orders of magnitude higher. Moreover, a much brighter burst recorded earlier during the 2004 February 16 observation, presumably from SGR 180620, showed no evidence for an X-ray afterglow. We concluded that either this was a new type of burst never before seen in SGR 180620, or it was a burst from a different source in the PCA FOV.
Knowing that XTE J1810197 was within the PCA FOV and that magnetar candidates have always shown an enhanced pulsed flux amplitude during X-ray tails following bursts (e.g. Lenters et al. 2003), we constructed a power spectrum before and after the burst (both SGR 180620 and XTE J1810197 have very simple pulse profiles). For 200 s exposures directly before and after the burst, we find that the pulsed amplitude of SGR 180620 (7.56 s) does not change significantly while the XTE J1810197 pulsed amplitude (5.54 s) increases dramatically (Figure 1 - Burst 2). The increase in pulsed amplitude was so large that one can clearly identify individual pulsations in the light curve. Due to the profound pulsed flux increase of XTE J1810197 simultaneous with this burst, we conclude that it was emitted from XTE J1810197.

Motivated by this discovery, we searched all RXTE PCA observations containing XTE J1810197 for similar bursts. In our search, we first identified bursts within 230 keV light curves for each observation. We defined a burst as a excess above background on the 0.25 s time scale where the counts were consistent with being equally distributed among all active PCUs. The background rate during each bin was calculated by taking an average of 30 s before and after the bin being searched. Next, we measured the pulsed amplitude of XTE J1810197 for short integrations (30 cycles or 166.2 s) throughout the observation. Four bursts, including the one described above, showed simultaneous pulsed flux excesses (Figure 2). Only one observation (80150-01-05-00) showed a marginal pulsed flux enhancement without any corresponding burst. However, the pulsed flux decreased monotonically through the first half of the 2.5 ks observation which may be indicative of an undetected burst immediately preceeding this observation. Several hundred bursts were detected without corresponding pulsed flux increases, but only during observations centered on SGR 180620. At this point, we cannot distinguish between SGR 180620 and XTE J1810197 as the origin of the vast majority of these bursts, although most are likely to have come from SGR 180620. Several tens of these bursts were detected and localized by INTEGRAL and/or the IPN, and all of those reported thus far have been confirmed to originate with SGR 180620.

We constructed power spectra for 200 s of data before and after each of the four bursts and found that the pulsed amplitude increase occurred following the burst in all cases. The change in 230 keV pulsed amplitude () across each burst is listed in Table 1. For Bursts 1 and 2, the increase is highly significant (). For the two weaker bursts (3 and 4), the change in pulsed amplitude is marginal ( and , respectively). However, the rate increases of the bursts themselves are not marginal () and these two bursts, in addition to Burst 1, were recorded during observations of PSR J18111925. These pointings exclude SGR 180620 from the PCA FOV (1.2 degrees off-axis), thus eliminating this object as the origin of Bursts 1, 3 and 4. We, therefore, attribute all four bursts to XTE J1810197.
4 Temporal Analysis
The burst morphologies consist of brief spikes (0.52 s) superposed upon extended tails of emission strongly modulated at the XTE J1810197 spin frequency. For each of the four bursts, we measured several temporal parameters including durations, rise times, and phase occurrence of the sharp spikes within the burst light curves.
4.1 Durations
First, we measured durations, defined as the time over which 90% of the burst counts are accumulated (Kouveliotou et al. 1993; Koshut et al. 1996), for each of the four events. Due to the quasi-exponential flux decay following these bursts, we first subtracted the background due to the passage of RXTE through Earth’s radiation belts using PCABACKEST. Next, we fit a low-order polynomial through several hundred seconds of data preceding and following each burst, well away from intervals containing burst emission. We interpolated this polynomial model through the burst interval to subtract the remaining background, then measured durations (230 keV) for each event. While the bright spikes themselves are relatively brief, the total burst durations are much longer (Table 1). Note that only a lower limit could be determined for Burst 2 due to Earth-occultation of XTE J1810197 during this event.
4.2 Burst Spikes versus Pulses
At times, the distinction between bright pulses and bursts was not obvious. We set out to separate ordinary pulses from what we will refer to as “burst spikes” within the time history of each event in the following way. From 70 s prior to the peak of each burst until 200 s after, we split the time history into equal length segments of one pulse period (5.54 s). We binned the recorded counts within each segment into 16 phase bins and constructed a Fourier representation of each pulse using 5 harmonics. The Fourier representations of the individual pulse profiles were cross-correlated with the average pulse profile derived from a much longer time integration of the persistent emission. For each 5.54 s integration, we fit for both the pulse phase and amplitude and calculated the goodness-of-fit () which is defined as
| (1) |
where
Here, refers to the harmonic number, refers to the phase bin, is the total number of phase bins, is the phase, is the count rate in the phase bin of the template, is the count rate in the phase bin of the individual pulse, is the uncertainty in the count rate of the phase bin of the individual pulse, is the pulsed amplitude, and is the phase shift. The number of degrees of freedom for the fit (8) is twice the number of harmonics used in the Fourier representation (5) minus the number of free parameters ( and ). Ordinary pulses returned low values confirming their morphological consistency with the pulse shape. The burst spikes, on the other hand, yielded high values and high pulsed intensities (Figure 3).
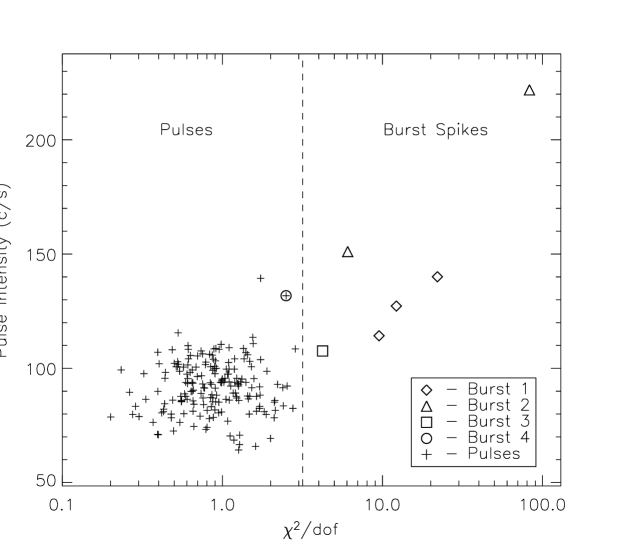
We set a threshold of 3 ( = 25.4 for 8 dof) to define the boundary between burst spikes and pulses. We identified 3, 2, 1 and 0 burst spikes in Bursts 1, 2, 3 and 4, respectively. Note that the initial pulse of Burst 4 ( = 2.5) falls slightly below our threshold, therefore this entire event was categorized, following our definition, as a sequence of bright pulses with no corresponding burst spike. Peak times of the burst spikes and the initial bright pulse of Burst 4, for completeness, are listed in Table 1. The average (i.e. reduced ) for all individual pulses was 1.000.04 where the error in the mean is determined from the sample variance. Thus, the individual pulses from XTE J1810197 seen during these burst tails, even several very high amplitude pulses, are morphologically consistent with the average pulse profile. Although several pulses have amplitudes higher than a few of the burst spikes, there is still a selection effect against burst spikes with low amplitudes due to low count statistics.
4.3 Burst Spike Morphologies
The individual burst spikes range in duration between 0.5 s and 2 s, although very precise determinations of durations are not possible due to the inseparable, underlying pulsations. The morphologies of the burst spikes are each consistent with a faster rise time than decay time. We measured the rise times of the burst spikes by fitting the local time histories (2.5 s) to a model consisting of a linear rise followed by an exponential decay. This model has been used previously to fit magnetar candidate burst time histories (Gavriil et al. 2002), and it adequately describes the burst morphologies observed here. For example, a close-up of the brightest observed burst spike (spike 1 of Burst 2) is shown in Figure 4. In general, the peak of each burst spike is defined as the time of the highest count density within the burst interval. To avoid statistical fluctuations, the maximum count density is determined for six consecutive counts where the mean arrival time of these events defines the burst peak. Due to the small number of total burst counts, we fit the model to the individual counts within the burst interval using a maximum likelihood method. The rise time is defined as the time between the intersection of the linear term with the pre-burst background count rate and the burst peak. The rise times of these burst spikes range from 14 ms to 150 ms (Table 1). The peak of Burst 4, classified earlier as a somewhat bright, yet ordinary pulse, has a much slower rise time of 600 ms.

4.4 Burst Tail Pulse Properties
The individual pulses within the tails of these bursts have morphologies consistent with the average pulse profile seen in the persistent X-ray emission (Figure 3), although this comparison is limited by the small number of counts recorded within individual pulses. Here, we probe the pulse morphology during the two brightest burst tails with higher sensitivity and investigate the phase alignment of these pulses with the pre-burst pulsations. First, we folded the 210 keV events recorded within the intervals of Burst 1 and 2, excluding the burst spikes, on the spin ephemeris of XTE J1810197. The resulting burst tail pulse profiles are well aligned with the pre-burst pulse profiles and have similar morphologies (Figure 5). We find a 3 upper limit of 0.03 cycles on a phase shift during the tails of these two bursts. The average pulse shape during the burst tails was slightly altered relative to the pre-burst pulsations. Specifically, the pulse peak during the tails is narrower than the pre-burst pulse peak.

Motivated by the modest changes in pulse shape that were measured during these two burst tails, we investigated the pulsed fraction following the bursts. It is not possible to accurately measure the pulsed fraction of the persistent emission due to the non-imaging PCA instrument, low count rate of XTE J1810197 at these epochs, and uncertain contribution to the PCA background due to other sources in the Galactic plane. We can, however, measure the pulsed fraction during the burst tails following Lenters et al. (2003). First, we subtracted the “local” PCA background using PCABACKEST. Next, we estimate the cosmic background (assumed to be constant within the 10 ks observations) by varying the background count rate until the pre-burst r.m.s. pulsed fraction equaled 42.70.8% and 41.30.8%, for Bursts 1 and 2, respectively. These 210 keV pulsed fractions were calculated from a linear interpolation between pulsed fraction measurements obtained from four XMM-Newton observations of XTE J1810197 (manuscript in preparation). We then used this rate as our background level for the burst tail (shown as horizontal dotted lines in Figure 5) and measured r.m.s. pulsed fractions (210 keV) of 48.03.1% and 61.54.3% during the tails of the respective bursts. The pulsed fraction during the tail of Burst 1 is consistent with the pre-burst level, whereas Burst 2 shows a significant increase in pulsed fraction. We conclude that the beaming function responsible for the persistent emission pulsations changes significantly during the tail of the brightest burst from XTE J1810197, such that the pulse maximum increases by a larger factor than pulse minimum. The pulsed fraction increase and pulse morphology change during this burst tail could be caused by unresolved bursts superposed upon pulse peaks.
4.5 Burst Phase Occurrence
From a visual inspection of the underlying pulsations within the burst time histories, it appeared that the burst spikes were concentrated near the maxima of the pulsed X-ray emission. We measured the relative alignment of each burst peak with the nearest pulse maximum in the following way. The centroid of the pulse maximum was determined by fitting a quadratic to the portion of the average pulse profile near pulse maximum. The average pulse profile used here was constructed from 230 ks of PCA data. The phase of each burst was determined by converting the time of the burst peak to pulse phase using the same pulse ephemerides utilized to generate the average pulse profile. Figure 6 shows the light curve of Burst 1 converted to pulse phase with the average pulse profile repeated below. The measured phase offsets for these three burst spikes given in Table 1 are the differences between the burst peaks and the nearest vertical dashed lines.

The relative alignment of the burst peaks with the pulse maximum is limited by the strong timing noise present in this pulsar (Ibrahim et al. 2004). Based upon the phase residuals from our timing solutions, we estimate the 1 error in the relative alignment to be 0.03 cycles. For a total of six burst spikes, we measure a net average phase offset of 0.0015 cycles and an absolute value average offset of 0.118 cycles. For a random burst distribution in phase, one would expect an absolute value average offset of 0.25 cycles. The probability that our measured offsets are consistent with a random distribution in phase is %. Thus, we conclude that these bursts from XTE J1810197 are in all likelihood correlated with pulse maximum. Furthermore, since the net average phase offset is consistent with zero, there is no preference for the burst spikes to lag or lead the main pulse.
| Burst 1 | Burst 2 | Burst 3 | Burst 4 | ||||
| Spike 1 | Spike 2 | Spike 3 | Spike 1 | Spike 2 | Main Pulse | ||
| Date | 09/22/03 | 02/16/04 | 04/19/04 | 05/19/04 | |||
| MJD | 52904 | 53051 | 53114 | 53144 | |||
| Peak Time | 27381.70 | 27407.92 | 27420.36 | 86101.50 | 86117.73 | 82122.70 | 36516.11 |
| (sod UT)a | |||||||
| 2.230.24 | 3.700.23 | 0.610.18 | 0.460.19 | ||||
| (c s-1 PCU-1) | |||||||
| Duration | 500 | 575 | 70 | 370 | |||
| (s) | |||||||
| Rise Time | 94 | 30 | 126 | 13.8 | 39 | 152 | 610 |
| (ms) | |||||||
| Burst Phase | 0.19 | 0.08 | 0.17 | 0.01 | 0.07 | 0.20 | 0.10 |
| (cycles)c | |||||||
| Blackbody | 8.01.1 | 3.90.6 | 5.40.8 | 7.20.5 | 5.30.7 | 5.82.0 | 3.90.7 |
| (keV) | |||||||
| Blackbody Radiusd | 0.380.11 | 0.810.24 | 0.700.21 | 1.040.13 | 0.940.24 | 0.330.23 | 0.410.15 |
| (km) | |||||||
| Fluence | 4.80.5 | 1.40.2 | 2.20.3 | 38.82.3 | 8.50.9 | 0.50.1 | 0.50.1 |
| (10-9 ergs cm-2) | |||||||
| Peak Fluxe | 18.44.0 | 6.31.9 | 7.42.4 | 991 | 15.14.9 | 2.11.2 | 0.70.4 |
| (10-9 ergs cm-2 s-1) | |||||||
a Seconds of day in Universal Time.
b is the change in 230 keV pulsed amplitude
from pre-burst to post-burst (200 s integration).
c The approximate 1 error for each measurement is 0.03
cycles. See text for details.
d The distance used to calculate the radii is 5 kpc. For
comparison, the radius inferred for the persistent thermal emission has been
steadily decreasing from 4 to 2 km between MJD 52980 and 53266
(Halpern & Gotthelf 2005).
e The peak flux is measured on the 62.5 ms time scale.
5 Spectral Analysis
5.1 Burst Spikes
Following standard recipes for RXTE PCA spectral analysis111http://heasarc.gsfc.nasa.gov/docs/xte/recipes/cook_book.html, we accumulated PCA spectra for each of the six burst spikes and main pulse of Burst 4, corresponding background intervals, and PCABACKEST spectra for both burst and background intervals. The PCABACKEST spectra estimate the “local” background in the PCA using various housekeeping parameters. This background component changes through the RXTE orbit on time scales of several tens of seconds to hours. Since our background intervals are hundreds of seconds offset from our burst intervals, the PCABACKEST spectra at the two epochs do not match. To correct for this, we first subtracted the PCABACKEST spectra from the observed background spectra, then added back in the PCABACKEST spectra derived for the burst interval. These modified background spectra are used in all subsequent spectral fits of the PCA data.
The two brightest burst spikes of Burst 1 and 2 were also clearly detected with the High-Energy X-ray Timing Experiment (HEXTE [Rothschild et al. 1998]), so we accumulated HEXTE spectra from cluster A of burst and background intervals for these events. We approximated the background during the burst interval by choosing background intervals before and after each burst equidistant from the burst peak.
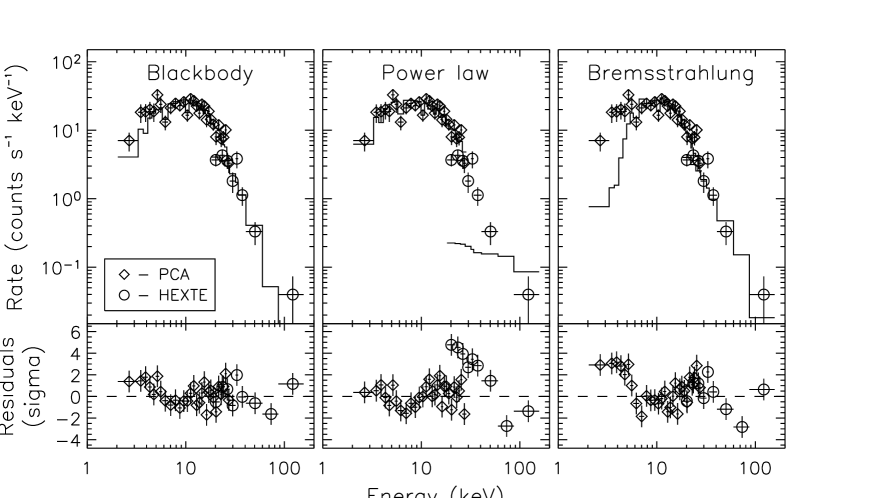
The PCA and HEXTE spectra for the brightest burst spikes (spike 1 of Bursts 1 and 2) were first grouped to include no fewer than 20 source counts per bin. Note that the background spectra were subtracted before grouping. In the PCA data, there were 370 and 990 counts recorded (230 keV) during the respective burst intervals. For each burst, the spectra were read into XSPEC v11.2.0 and fit to three simple models – power-law, bremsstrahlung, and blackbody – all modified by photoelectric absorption. For the PCA and HEXTE spectra, we simultaneously fit channels in the range 2.430 keV and 15150 keV, respectively, allowing for separate normalizations for the two instruments. The power-law and bremsstrahlung models provided poor fits to the spectrum of the primary peak of Burst 2 (/dof = 125/34 and /dof = 98/34, respectively), whereas the blackbody model provided an acceptable fit (/dof = 40/34). All three model fits for this burst are shown in Figure 7. Similarly, the energy spectrum for the main peak of Burst 1 was fit best with the blackbody model (/dof = 16.1/17), although the other two models provided statistically acceptable fits (/dof = 22.6/17 for the power-law model and /dof = 20.5/17 for the bremsstrahlung model). However, the measured column density was unrealistically large at 80 1022 cm-2 for both the power law and bremsstrahlung models. The column density measured from the persistent X-ray energy spectrum is cm-2 (Gotthelf et al. 2004). The blackbody model, on the other hand, returned an upper limit for the column density ( cm-2 at 90% confidence) for Burst 2 consistent with the value measured from the persistent X-ray emission. Finally, we fit only the PCA spectra for these bursts independently, and both the fit parameters and the quality of the fits did not change significantly from the joint PCA/HEXTE fits. We conclude that, of the simple one-component models tested here, only the blackbody model provides an adequate fit to the XTE J1810197 burst spike energy spectra.
With the column density frozen at the value inferred from the persistent emission spectral fits, we fit each of the six burst spike energy spectra (PCA data only for the four remaining burst spikes) to the blackbody model. Equally good fits were obtained for the four additional burst spikes. The blackbody temperatures from all fits (including a fit to the primary peak of Burst 4) are listed in Table 1. None of the burst spike spectra show evidence for discrete spectral features. For our set of six burst spikes, we find that the blackbody temperature is correlated with the flux of the burst (Figure 8). The probability that the measured spectral temperatures are consistent with a constant temperature is 2 10-4. The emitting radii range between 0.3 and 1.1 km (for a distance of 5 kpc [Gotthelf et al. 2004]), and show a marginal positive correlation with burst flux (1 10-3 chance probability).

Only the most energetic burst spike (the primary peak of Burst 2; Figure 4) had a sufficient number of counts to search for spectral evolution in time. We split this burst (0.152.0 s) into three time intervals of 330 counts each. The temperature does not change significantly between the three intervals, although the limits on variability are not very restrictive (2 keV).
5.2 Burst Tails
Using the same procedure as described above, we extracted PCA spectra of the tail emission, excluding the burst spikes, for the two brightest burst tails (Bursts 1 and 2). The remaining two burst tails did not have a sufficient number of counts for meaningful spectral fits. As with the burst spikes, we fit the tail spectra to the blackbody, power-law and bremsstrahlung models, all with interstellar absorption. For these fits, the column density was frozen at cm-2. Only the blackbody model provided an adequate fit ( 74.5 for 63 dof) to the spectrum of the X-ray tail of Burst 1, with a measured temperature of 2.60.2 keV. The power-law and bremsstrahlung models returned /dof of 100/63 and 96/63, respectively. None of these simple models could adequately fit the tail spectrum of Burst 2, although the blackbody model did provide the best fit. The /dof for the three models were 55.9/29, 137/29, and 192/29, respectively.
The residuals in the blackbody fit to the Burst 2 tail spectrum showed evidence for an emission line at 13 keV consistent with the instrumental width of the PCA (Figure 9). When we included a narrow (i.e. zero width) Gaussian line in our model, the fit improved significantly ( 30.0 for 27 degrees of freedom). We estimated the probability of measuring a change in this large (25.9) through a Monte Carlo simulation with 250,000 realizations of a blackbody spectrum. Using XSPEC, the spectra were fit to a blackbody model and a blackbody plus a narrow line for energies between 3 and 28 keV at 0.25 keV increments – finer than the instrumental resolution (12 keV). For each simulated spectrum, the change in was measured between the pure blackbody and the blackbody plus line fit for the line energy corresponding to the lowest . In none of the simulated spectra was the improvement in larger than 24.4, thus, the probability that a line of the strength measured would appear by chance is 4 10-6. The centroid of the line in the Burst 2 tail spectrum was fit to a value 12.60.2 keV with an equivalent width of 1.43 keV. The blackbody temperature for this fit was 3.60.2 keV. The Burst 2 tail spectrum was of better statistical quality than the Burst 1 tail spectrum, so the non-detection of a line in that spectrum is not surprising. The 3 upper limit on the equivalent width of a narrow line at that energy for the Burst 1 tail spectrum is 4.1 keV.

We performed phase-resolved spectroscopy on each of these burst tails. Using spin ephemerides determined from phase-connected fits to longer stretches of the persistent emission, we folded the data within each burst tail and extracted PCA energy spectra with 8 phase bins for each. For each tail, there is no significant change of the temperature with pulse phase. The limit on the range of the blackbody temperature about the mean is 0.4 keV.

Motivated by the observed dependence of the blackbody temperature on the burst flux (Figure 8), we split the 2004 February 16 burst (Burst 2 spikes and tail) into five segments of approximately equal source counts. We fit the individual spectra to the blackbody model and observe a clear decay in the temperature as the flux during the burst/tail declines (Figure 10). The blackbody temperature decays linearly with the logarithm of the time (), where = 1.730.16 keV . The bolometric flux decays more rapidly, following a power-law decay with an exponent 0.920.02. The isotropic energy emitted during the burst and tail is 8.7 1038 ergs for an assumed distance of 5 kpc. Note that there is no sharp transition between the temperature during the primary burst peak and the tail. The blackbody emitting radius, however, drops from 1 km during the burst to 0.5 km for the duration of the tail.
6 Discussion
6.1 X-ray Tails
After the peak of each burst from XTE J1810197, the persistent (and pulsed) emission increased, giving rise to extended X-ray tails. There appears to be a causal relationship between the bursts and tails in that each new burst spike elevates the persistent flux. For example, the persistent (and pulsed) flux of Burst 1 rose 50 s prior to the primary burst spike. Following this spike, the persistent flux rose even further and maintained this level for 60 s through the next two (observable) burst spikes before slowly decaying away. In the tail following the most energetic burst (Burst 2), the data are consistent with a constant emitting area whose surface cools as the bolometric flux declines according to a power law in time.
Power-law flux decay following bursts has now been observed on numerous occasions from four magnetar candidates (e.g. Woods et al. 2004). As more and more of these burst/tail pairs are recorded, their properties have been found to be increasingly diverse. The temporal decay indices of the X-ray tails now range from 0.22 to 1 and the tail-to-burst energy ratios span more than two orders of magnitude from 0.02 to 3.5. Within the context of the magnetar model, interpretations of these burst-induced transient flux enhancements include cooling of the outer layers of a magnetar crust (Lyubarsky, Eichler & Thompson 2002) and enhanced magnetospheric emission due to stronger currents driven by a twisting of magnetic field lines (Thompson et al. 2000, 2002). The exclusively thermal spectra of the X-ray tails observed here suggests crustal cooling as opposed to optically-thin magnetospheric emission.
Roughly 1% of the total energy of each burst is expected to be conducted into the crust and reradiated during the afterglow phase (Thompson & Duncan 1995). In fact, the afterglow following the giant flare of 1998 August 27 from SGR 190014 comprised 2% of the prompt burst energy (Woods et al. 2001), consistent with the cooling of the outer layers of a magnetar crust (Lyubarsky et al. 2002). However, in Burst 2 from XTE J1810197 presented here, the tail energy actually exceeds the burst energy by a factor 3.5. Clearly, a recycling of burst energy cannot explain the total tail emission seen here. This would suggest that the physical process which caused the short burst, presumably a crustal fracture (see next section), also supplied the energy required to power the subsequent X-ray tail.
The emission line in the energy spectrum of the X-ray tail of Burst 2 is centered near 12.6 keV. Emission lines at similar energies have been detected from SGR 190014 (Strohmayer & Ibrahim 2000) and 1E 1048.15937 (Gavriil et al. 2002), although these features were detected during the prompt burst emission at lower confidence levels. It has been suggested that in a magnetar, proton cyclotron emission lines can be excited following bursts with sufficient radiative pressure to drive a thin layer of particles off the stellar surface (Ibrahim et al. 2001). The detection of the line following this burst from XTE J1810197 is consistent with this picture. If this line represents the fundamental frequency for protons, the required local field would be 2 1015 G, or 7 times higher than the dipole field strength inferred from the spin down parameters (Ibrahim et al. 2004). Note that local magnetic fields higher than the dipole field are possible and furthermore, there are significant uncertainties in the magnetic field calculation for both the proton cyclotron energy and dipole spin down (e.g. Thompson et al. 2000).
6.2 Two Classes of Magnetar Bursts
A new paradigm appears to be emerging when we add the XTE J1810197 bursts to the existing magnetar candidate burst sample. We now are able to identify a class of bursts that () have thermal energy spectra () are correlated with the pulsed flux maxima and () exhibit extended X-ray tails lasting tens to hundreds of seconds. All four of the bursts from XTE J1810197 reported here and several others from both 1E 1048.15937 (Gavriil et al. 2002) and 1E 2259586 (Kaspi et al. 2003; Gavriil et al. 2004) seem to be part of this class. One of the two bursts detected from 1E 1048.15937 in 2001 (Gavriil et al. 2002) had a significant tail of emission lasting 50 s. While the full duration of this burst was long, it started with a brief (1 s), bright spike that had a short rise time (20 ms), very similar to the morphology of the burst shown in Figure 4. The other 1E 1048.15937 burst was similar, but there was no extended X-ray tail detected, although this could simply be due to insufficient sensitivity. The peaks of these two bursts occurred near pulse maximum, similar to the XTE J1810197 bursts. Another burst recorded from 1E 1048.15937 in 2004 (Kaspi et al. 2004) exhibits a brighter X-ray tail (Gavriil et al. 2005) than either of the 2001 bursts from that source. The properties of this tail are similar in many respects to the X-ray tail following Burst 2 from XTE J1810197.

The 2002 June outburst from 1E 2259586 contained 80 individual bursts within a single 11-ks RXTE observation (Gavriil et al. 2004). The arrival time distribution of these bursts in rotational phase of the pulsar, like those from 1E 1048.15937 and XTE J1810197, was correlated with the pulse maxima. The 1E 2259586 bursts also showed a hardness-fluence correlation qualitatively similar to what we find between the burst flux and blackbody temperature of XTE J1810197 bursts. Several of the bursts recorded from 1E 2259586 were brief (0.1 s duration) spikes similar to those detected from SGRs (Göğüş et al. 1999, 2000, 2001). However, a fraction of the 1E 2259586 bursts clearly had extended X-ray tails lasting hundreds of seconds in some cases. The high concentration of burst activity and the rapidly decaying X-ray flux upon which these bursts were superposed (Woods et al. 2004) made it difficult to identify these tails. Three examples of bursts with extended tails from 1E 2259586 are shown in Figure 11 (Bursts A, C and D) plus one event that does not show a post-burst flux enhancement (Burst B). Moreover, the bursts from 1E 2259586 with X-ray tails also exhibited a significant increase in pulsed amplitude following the burst. The change in 230 keV pulsed amplitude () for 200 s integrations prior to and following each burst is printed on the right-most panels of Figure 11. The pulsed amplitude of 1E 2259586 increases significantly (3) following Bursts A, C and D, but shows no significant change following Burst B. Interestingly, Burst B also has the highest peak flux (on time scales shorter than 1 s) of all bursts detected from 1E 2259586; thus bursts with high peak flux are not necessarily accompanied by X-ray tails or increases in pulsed flux.
The bursts we have observed from these three AXPs differ from SGR bursts in a few key ways. First, hundreds of bursts from SGR 190014 recorded in 1998 were consistent with being distributed randomly in pulse phase (Palmer 2002), whereas all three bursting AXPs have shown a correlation with the pulsed X-ray flux. Second, the ratio of burst-to-tail energy in AXP is very different from that of SGR bursts. X-ray tails from SGRs have been detected, however, only following high-fluence SGR bursts (Woods et al. 2001; Ibrahim et al. 2001; Lenters et al. 2003; Feroci et al. 2003) where the energy during the burst interval is many times larger than the energy emitted during the tail (Lenters et al. 2003). For the bursts with X-ray tails seen from the AXPs, the tail energy is larger than the energy emitted during the primary burst peak. Third, extended X-ray tails are a much rarer phenomenon following SGR bursts, in spite of the fact that many SGR bursts are orders of magnitude brighter than the bursts seen from these three AXPs. Fourth, the SGR bursts with X-ray tails exhibit a distinct morphology showing an abrupt flux termination that nominally marks the transition point between burst and tail (Woods & Thompson 2004). In a single case where there have been sensitive observations during one of these burst-to-tail transition points, we observed a spectral discontinuity coincident with the sudden drop in burst flux (Ibrahim et al. 2001). The AXP bursts show a quasi-exponential decay with no sharp transition point between burst and tail either in spectrum or morphology. Finally, the broad-band spectrum (2150 keV) of bursts from SGR 190014 has recently been shown to be well modeled by the sum of two blackbodies (Feroci et al. 2004; Olive et al. 2004). At least for XTE J1810197, the spectrum is well fit by a single blackbody over a similar energy range.
It is clear that this new type of burst is more common in AXP sources as compared to the SGRs. It should be noted that at least 1E 2259586 emits both types of bursts, so the two burst types are apparently not mutually exclusive from source to source or even within a given burst active period. For the purposes of the following discussion, we will refer to the traditional SGR bursts as Type A bursts and this potentially different type of bursts seen in AXPs as Type B bursts.
6.3 Magnetar Burst Models
The Type B bursts we have now observed from three different sources have a set of common characteristics that place constraints on their origin and geometry. In particular, the correlation of the burst arrival times with the pulsed flux maxima suggests some degree of collimation. Based upon the average phase offset from the peak (0.2 cycles), we estimate the opening angle of the emission cone to be 70∘. In all likelihood, the bursts are emitted at irregular intervals, yet we only observe those whose cone of emission includes our line of sight, thus producing the temporal correlation with pulse maximum. The observed properties of the XTE J1810197 bursts suggest that they originate from the same vicinity which produces the pulsed maximum, presumably at or above the polar cap. Given the thermal shape of these burst spectra and their absence during pulse minimum, the bursts are probably produced at, or very near the stellar surface. Note that this does not require the persistent X-ray pulsations be produced at the surface (i.e. the pulsations may originate from higher up in the magnetosphere above the polar cap).
Collimation of the burst flux suggests that one would expect to observe “naked” X-ray tails or enhanced persistent emission without observable bursts. Burst 4 and the first 50 s of Burst 1 are examples of such events. Each cycle of these burst intervals, including the primary peak of Burst 4, has a morphology consistent with the pulse shape (Figure 3). In these instances, a burst may have been emitted while the polar cap was pointed away from our line of sight, so we only detected the X-ray tail of the burst, but not the burst itself. The fraction of observed naked tails to tails accompanied by bursts is likely to be small for several reasons. First, there is an observational selection effect against the detection of naked tails. The pulsed flux enhancements are simply more difficult to detect than the bursts due to the relatively modest change in pulsed amplitude following bursts and the long integration times (150300 s) required to detect this change. Since the pulsed flux enhancements decay away rapidly, long integration times effectively dilute the signal. Second, the collimation of emission from the stellar surface will be reduced by the strong gravitational potential well of the neutron star, thus revealing a larger fraction of the neutron star surface to our line of sight (e.g. Psaltis, Özel & DeDeo 2000). Third, the durations of the bursts (0.52 s) are a significant fraction of the pulse period; thus one is likely to detect the burst even if it starts while the pole is pointed away from our line of sight. Finally, multiple bursts are often times emitted during each burst event, so with each burst the chances that one or more will cross our line of sight is increased.
What then do these constraints say about the physical mechanism that produces the bursts? Within the context of the magnetar model, two physical triggers have been proposed to explain magnetar bursts: crust fracturing (Thompson & Duncan 1995) and magnetospheric reconnection (Lyutikov 2002). Note that a localized crustal fracture may also induce sudden magnetospheric reconnection within a narrow bundle of field lines anchored to the crust (Thompson & Duncan 2001). In the crust fracturing model, two distinct mechanisms for converting the stored potential energy in the crust to observable X-rays have been put forth (Thompson & Duncan 2001; Heyl & Hernquist 2004). However, the end product of an expanding pair-photon plasma that emits predominantly blackbody emission is the same for each mechanism. Thus the two are, in the present understanding, indistinguishable observationally. The properties of the bursts resulting from the two physical triggers, on the other hand, are expected to have observational differences (e.g. Lyutikov 2002).
The qualitative differences in the two models would favor the magnetospheric reconnection trigger for Type A bursts and crust fracturing for Type B bursts. A magnetospheric origin would lend itself to more isotropic emission having no preference for a particular pulse phase. Alternatively, the crust fracture model would naturally produce a phase dependence of the burst emission for a localized active region on the crust. Moreover, the tendency of the bursts to occur near pulse maximum is consistent with the strain in the crust being highest in regions where the field is strongest (Thompson & Duncan 1995) – at the polar caps. Lyutikov (2002) argued that the conditions most favorable for magnetic reconnection are present in magnetars with magnetospheres having strong electrical currents and a high degree of magnetospheric shear. Thompson, Lyutikov & Kulkarni (2002) have argued that the SGRs, with their strong non-thermal X-ray spectral components, are most likely to match these conditions, thus making SGRs prime candidates for magnetospheric reconnection. Finally, Lyutikov (2002) shows that the magnetospheric reconnection model can account for the observed hardness-fluence anti-correlation seen in bursts from SGR 180620 (Göğüş et al. 2001). The bursts from the AXP 1E 2259586 exhibit a positive correlation (Gavriil et al. 2004).
At this time, there are very few quantitative model predictions for either the crustal fracture model or the magnetospheric reconnection model, particularly in terms of anticipated energy spectra and light curves. One notable exception is the prediction of bright radio bursts accompanying X-ray bursts triggered by magnetospheric reconnection (Lyutikov 2002). The lack of detailed model predictions limits the rigor with which we can compare and contrast these two models with the available data. In addition, more work is needed in analyzing existing data sets. For example, is the apparent spectral difference, one blackbody in Type B bursts versus two blackbodies in Type A bursts, ubiquitous among these different burst sources? Is there a small, as yet undiscovered, fraction of Type B bursts hidden in the SGR burst database? Answering these questions will help illuminate the full scope of magnetar candidate burst properties and ultimately improve our physical understanding of the burst mechanism.
References
- (1)
- (2) Duncan, R. & Thompson, C. 1992, ApJ, 393, L9
- (3)
- (4) Feroci, M., et al. 2003, ApJ, 596, 470
- (5)
- (6) Feroci, M., Caliandro, G.A., Massaro, E., Mereghetti, S., & Woods, P.M. 2004, ApJ, 612, 408
- (7)
- (8) Gavriil, F. P., Kaspi, V. M., & Woods, P. M. 2002, Nature, 419, 142
- (9)
- (10) Gavriil, F. P., Kaspi, V. M., & Woods, P. M. 2004, ApJ, 607, 959
- (11)
- (12) Gavriil, F. P., Kaspi, V. M., & Woods, P. M. 2005, ApJ, submitted
- (13)
- (14) Göğüş, E., Woods, P.M., Kouveliotou, C., van Paradijs, J., Briggs, M.S., Duncan, R.C., & Thompson, C. 1999, ApJ, 532, L121
- (15)
- (16) Göğüş, E., Woods, P.M., Kouveliotou, C., van Paradijs, J., Briggs, M.S., Duncan, R.C., & Thompson, C. 2000, ApJ, 526, L93
- (17)
- (18) Göğüş, E., Kouveliotou, C.,, Woods, P.M., Thompson, C., Duncan, R.C. & Briggs, M.S. 2001, ApJ, 558, 228
- (19)
- (20) Göğüş, E., Kouveliotou, C., Woods, P.M., Finger, M.H., & van der Klis, M. 2002, ApJ, 577, 929
- (21)
- (22) Gotthelf, E.V., Halpern, J.P., Buxton, M., & Bailyn, C. 2004, ApJ, 605, 368
- (23)
- (24) Halpern, J.P. & Gotthelf, E.V. 2005, ApJ, 618, 874
- (25)
- (26) Hurley, K., et al. 1999, ApJ, 510, L111
- (27)
- (28) Ibrahim, A., Strohmayer, T.E., Woods, P.M., Kouveliotou, C., Thompson, C., Duncan, R.C., Dieters, S., van Paradijs, J. & Finger M. 2001, ApJ, 558, 237
- (29)
- (30) Ibrahim, A., et al. 2003, GCN Circ. 2306
- (31)
- (32) Ibrahim, A., et al. 2004, ApJ, 609, L21
- (33)
- (34) Israel, G., et al. 2004, ApJ, 603, L97
- (35)
- (36) Jahoda, K., Swank, J., Stark, M., Strohmayer, T., Zhang, W., & Morgan, E. 1996, Proc. SPIE, 2808, 59
- (37)
- (38) Kaspi, V.M., Gavriil, F.P., Woods, P.M., Jensen, J.B., Roberts, M.S.E., & Chakrabarty, D. 2003, ApJ, 588, L93
- (39)
- (40) Kaspi, V.M. & Gavriil, F.P. 2003, ApJ, 596, L71
- (41)
- (42) Koshut, T.M., Paciesas, W.S., Kouveliotou, C., van Paradijs, J., Pendleton, G.N., Fishman, G.J., & Meegan, C.A. 1996, ApJ, 463, 570
- (43)
- (44) Kouveliotou, C., et al. 1993, ApJ, 413, L101
- (45)
- (46) Kouveliotou, C., et al. 1998, Nature, 393, 235
- (47)
- (48) Kouveliotou, C., et al. 1999, ApJ, 510, L115
- (49)
- (50) Kouveliotou, C., et al. 2003, ApJ, 596, L79
- (51)
- (52) Lenters, G., Woods, P.M., Goupell, J., Kouveliotou, C., Göğüş, E., Hurley, K., Frederiks, D., Golenetskii, S., & Swank, J. 2003, ApJ, 587, 761
- (53)
- (54) Lyubarsky, E., Eichler, D., & Thompson, C. 2002, ApJ, 580, L69
- (55)
- (56) Markwardt, C., et al. 2003, ATEL 188
- (57)
- (58) Olive, J-F, et al. 2004, ApJ, 616, 1148
- (59)
- (60) Palmer, D.M. 2002, in Soft Gamma Repeaters: The Rome 2001 Mini-Workshop, Eds. M. Feroci & S. Mereghetti, Mem. S. A. It., vol 73, n. 2, pp. 578-583
- (61)
- (62) Psaltis, D., Özel, F., & DeDeo, S. 2000, ApJ, 544, 390
- (63)
- (64) Rothschild, R.E., et al. 1998, ApJ, 496, 538
- (65)
- (66) Thompson, C., & Duncan, R. 1995, MNRAS, 275, 255
- (67)
- (68) Thompson, C., & Duncan, R. 1996, ApJ, 473, 322
- (69)
- (70) Thompson, C., & Duncan, R. 2001, ApJ, 561, 980
- (71)
- (72) Thompson, C., Duncan, R., Woods, P.M., Kouveliotou, C., Finger, M.H., & van Paradijs, J. 2000, ApJ, 543, 340
- (73)
- (74) Thompson, C., Lyutikov, M., & Kulkarni, S.R. 2002, ApJ, 574, 332
- (75)
- (76) Vasisht, G., Gotthelf, E.V., Torii, K., & Gaensler, B.M. 2000, ApJ, 542, L49
- (77)
- (78) Woods, P.M., et al. 2001, ApJ, 552, 748
- (79)
- (80) Woods, P.M., et al. 2004, ApJ, 605, 378
- (81)
- (82) Woods, P.M. & Thompson, C., in “Compact Stellar X-ray Sources”, Eds. W.H.G. Lewin & M. van der Klis, Cambridge, in press (astro-ph/0406133)
- (83)