Evidence for dust reddening in DLAs identified through CaII(H&K) absorption
Abstract
We present a new sample of 31 Ca ii (H&K) absorption line systems with discovered in the spectra of Sloan Digital Sky Survey (SDSS) Data Release 3 quasars, together with an analysis of their dust content. The presence of Calcium absorption together with measurements of the Mg ii , Fe ii and Mg i lines lead to the conclusion that the majority of our systems are Damped Ly- (DLA) absorbers. The composite spectrum in the rest frame of the absorber shows clear evidence for reddening. Large and Small Magellanic Cloud extinction curves provide satisfactory fits, with a best-fit E(B-V) of 0.06, while the Galactic dust extinction curve provides a poor fit due to the lack of a strong 2175Å feature. A trend of increasing dust content with equivalent width of Ca ii is present. Monte Carlo techniques demonstrate that the detection of reddening is significant at confidence. The discovery of significant amounts of dust in a subsample of DLAs has direct implications for studies of the metallicity evolution of the universe and the nature of DLAs in relation to high redshift galaxies. The gas:dust ratio is discussed. Our results suggest that at least 40% of the Ca ii absorption systems are excluded from the magnitude-limited SDSS quasar sample as a result of the associated extinction, a fraction similar to the upper limit deduced at higher redshifts from radio-selected surveys.
keywords:
quasars: absorption lines, dust, extinction, galaxies: high redshift, galaxies: ISM1 Introduction
The quantity and composition of dust in metal absorption line and damped Ly- (DLA) systems has been a topic of debate for over fifteen years. Quantifying the amount of dust in these systems is important not only for understanding the chemical evolution of galaxies over large lookback times, but also has implications for the biases involved in DLA selection in optical quasar surveys.
Due to the difficulty in defining suitable samples, there are relatively few reports of evidence for dust in DLAs via the reddening effect on background quasar spectra. Pei, Fall & Bechtold (1991), following up from the first study by Fall, Pei & McMahon (1989), found the spectral energy distributions (SEDs) of 20 quasars with DLAs to be significantly redder than those of 46 quasars without DLAs. Recently however, ?) found no evidence for dust reddening in a much larger, homogeneous sample of DLAs from the Sloan Digital Sky Survey (SDSS), finding a limit, E(B-V)0.02, that is inconsistent with the results of Pei et al.. Whilst the optical selection of the SDSS sample could potentially introduce some bias into this result, Ellison, Hall & Lira (2005) find an E(B-V)0.05 (3) using a smaller sample of radio selected quasars with DLAs. The alternative view, in which DLAs possess detectable quantities of dust, is supported by ?) who found the paths of 4 out of 5 “red quasars” to contain strong HI 21cm absorption, suggesting the excessive redness of the quasars to be due to the intervening absorption systems.
The importance of selection effects in quasar samples when searching for DLAs or metal absorption line systems is clear, a small amount of dust present in an intervening galaxy could cause enough extinction for the quasar to fall below the detection limit of optical magnitude-limited surveys. Using a complete sample of radio selected galaxies containing 22 DLAs with in 66 quasars, ?, the CORALS survey) find that optical surveys could have underestimated the number of DLAs by at most a factor of two. By making use of the criteria for identifying potential DLAs from the strengths of metal absorption lines (?), ?) extend this result to absorbers at lower redshift. Again their results permit up to a factor of 2.5 underestimate of the incidence of DLAs in optical, as opposed to radio selected, quasar samples.
Whilst the intrinsic range in the SEDs of the underlying quasar spectra means estimates of reddening from differences in the average SEDs of quasar samples rely on statistical arguments, a clear indication of the presence of dust comes from the identification of spectroscopic features caused by the dust grains. The strongest such feature in the Galaxy is at 2175Å, but the feature is weak or absent in the Large and Small Magellanic Clouds (LMC and SMC). The 2175Å feature has been detected in the spectrum of a BL Lac object at the absorption redshift of a known intervening DLA by ?). Possible detections in SDSS quasar spectra with strong intervening metal absorption systems have been presented by ?).
A further diagnostic of the presence of dust in DLAs and metal absorption line systems comes from relative abundances of elements, such as Cr to Zn, which are depleted by differing amounts onto dust grains (?). Results indicate that dust depletion is far less severe than in the Galactic interstellar medium today (??) which, combined with results from the radio-selected CORALS survey (?), has further strengthened the argument that DLAs are relatively dust free compared with modern galaxies.
In this paper we analyse a sample of 31 Ca ii (H&K) absorption line systems found in the spectra of SDSS Data Release 3 (DR3) quasars (?). Calcium is found to be generally underabundant in galaxies and is expected to be heavily depleted onto dust grains (?). Without doubt the detection of Ca ii indicates a large column density of HI and a very high fraction of our sample are expected to be DLAs. This paper therefore presents one of the largest homogeneous samples of DLAs at intermediate redshifts and provides a detection method with an expected success rate substantially higher than methods based on the properties of Mg ii and Fe ii absorption.
In Section 2 we present our sample of Ca ii absorbers. In Section 3 we describe our method for creating appropriate “composite” quasar spectra that allow the statistical removal of the underlying quasar SEDs to isolate any differences due to the presence of the Ca ii absorbers. Results are given in Section 4. Further details of the method will be presented in an accompanying paper (Wild, Hewett & Pettini 2005, in preparation) together with an analysis of Zn and Cr abundances in the composite spectrum.
2 A sample of Ca ii absorbers
An investigation into the properties of Ca ii (H&K: ) absorbers at redshifts 1 is made possible by the extended wavelength coverage of the SDSS spectra (3800-9200Å) combined with the improved sky subtraction of ?). The lower redshift limit to the absorber sample was set by the appearance of the 2175Å feature at 4000Å in the SDSS spectra, at , while the upper redshift limit, , was set by Ca ii (H&K) moving beyond the red limit of the spectra. We further restrict the sample of Ca ii absorbers by requiring that the 2175 Å feature falls redward of the Ly- forest in the individual quasar spectra.
In order to detect weak Ca ii (H&K) absorption features in medium resolution spectra, the sample of quasars whose spectra are searched is restricted to those obeying the following criteria:
-
•
entry in the DR3 quasar catalogue (?)
-
•
Galactic extinction corrected -band PSF magnitude
-
•
spectroscopic signal-to-noise ratio (S/N) in the -band
-
•
no broad absorption line (BAL) features.
The technique to identify BAL quasars will be presented in detail in the accompanying paper. Briefly, the scheme involves the calculation of the root-mean-square (rms) deviations around the C iv , Mg ii and Fe ii lines from a continuum defined using Principal Component Analysis (PCA). Thirteen per cent of the quasar spectra, which satisfy the first three criteria above, are flagged as potential BALs. The final sample consists of 11 427 quasars and the final conclusions of the paper are insensitive to the precise scheme used to define the subsample of quasars to be searched. The faint magnitude limit is similar to that used for the selection of “low-redshift” quasar candidates in the SDSS (-band magnitude of 19.1).
A matched-filter search (?) of the quasar spectra for Ca ii doublets (in the ratio of 2:1 and 1:1, matching the properties of unsaturated and saturated lines) above a 5 significance threshold was performed. Candidate systems also had to possess absorption line detections corresponding to Mg ii (). Visual inspection of the candidate list eliminated a small number of spurious detections. Table 1 lists the properties of the remaining 31 Ca ii absorber candidates.
| SDSS ID | mjd,plate,fibre | magi | EW Ca ii | EW Mg ii | EW Mg i | EW Fe ii | E(B-V)LMC | ||
|---|---|---|---|---|---|---|---|---|---|
| J002133.36+004301.2 | 51900,0390,537 | 17.42 | 1.245 | 0.942 | 0.34, 0.22 | 1.80, 1.66 | 0.55 | 0.99 | -0.022 |
| J010332.40+133234.8 | 51821,0421,049 | 18.24 | 1.660 | 1.049 | 1.07, 0.80 | 3.06, 2.66 | 1.44 | 2.25 | 0.072 |
| J014717.76+125808.4 | 51820,0429,215 | 17.71 | 1.503 | 1.040 | 0.50, 0.17 | 4.28, 4.26 | 1.15 | 3.05 | 0.041 |
| J074804.08+434138.4 | 51885,0434,340 | 18.44 | 1.836 | 0.898 | 0.53, 0.27 | 1.71, 1.19 | 0.30 | 0.69 | 0.025 |
| J080736.00+304745.6 | 52319,0860,601 | 18.53 | 1.255 | 0.969 | 0.56, 0.79 | 2.83, 2.70 | 1.24 | 2.23 | 0.001 |
| J081054.00+352226.4 | 52378,0892,106 | 18.30 | 1.304 | 0.877 | 0.56, 0.31 | 2.17, 2.11 | 0.99 | 1.78 | 0.032 |
| J081930.24+480827.6 | 51885,0440,007 | 17.64 | 1.994 | 0.903 | 0.75, 0.36 | 1.69, 1.57 | 1.03 | 1.36 | *** |
| J083157.84+363552.8 | 52312,0827,001 | 17.91 | 1.160 | 1.127 | 0.73, 0.41 | 2.52, 2.49 | 0.78 | 1.53 | -0.024 |
| J085221.36+563957.6 | 51900,0448,485 | 18.58 | 1.449 | 0.844 | 0.65, 0.49 | 3.32, 3.03 | 1.24 | 2.45 | 0.010 |
| J085556.64+383231.2 | 52669,1198,100 | 17.57 | 2.065 | 0.852 | 0.45, 0.16 | 2.65, 2.50 | 0.71 | 2.07 | 0.042 |
| J093738.16+562837.2 | 51991,0556,456 | 18.49 | 1.798 | 0.980 | 1.23, 0.62111Multiple absorption line system. All lines are fit with double Gaussians and the quoted EW is the total of the two systems. When fitting Ca ii , the velocity-separation of the systems is taken to be that determined from the associated Fe ii () lines. | 4.90, 4.34 | 2.35 | 3.21 | 0.300 |
| J095352.80+080104.8 | 52734,1235,465 | 17.40 | 1.720 | 1.024 | 0.48, 0.35 | 0.91, 0.80 | 0.46 | 0.64 | 0.024 |
| J100000.96+514416.8 | 52400,0903,258 | 18.70 | 1.235 | 0.907 | 0.81, 0.58 | 4.47, 3.90 | 1.41 | 2.47 | -0.012 |
| J100145.12+594008.4 | 52282,0770,087 | 17.82 | 1.186 | 0.900 | 0.47, 0.33 | 0.64, 0.58 | 0.50 | 0.41 | 0.057 |
| J103024.24+561832.4 | 52411,0947,179 | 17.81 | 1.288 | 1.001 | 0.68, 0.33 | 1.91, 1.84 | 0.95 | 1.58 | 0.030 |
| J112053.76+623104.8 | 52295,0775,455 | 17.39 | 1.130 | 1.073 | 0.57, 0.44 | 2.02, 1.94 | 0.92 | 1.50 | 0.070 |
| J112932.64+020422.8 | 51992,0512,113 | 17.31 | 1.193 | 0.966 | 0.56, 0.53 | 2.08, 2.03 | 0.71 | 1.64 | -0.004 |
| J113357.60+510845.6 | 52367,0880,288 | 18.28 | 1.576 | 1.030 | 1.25, 0.67 | 2.66, 2.72 | 0.82 | 1.97 | 0.117 |
| J115244.16+571203.6 | 52765,1311,631 | 17.92 | 1.603 | 0.848 | 0.54, 0.35 | 3.35, 3.19 | 1.15 | 2.33 | 0.212 |
| J122144.64-001142.0 | 52000,0288,078 | 18.52 | 1.750 | 0.929 | 0.58, 0.23 | 0.97, 0.82 | 0.72 | 0.74 | -0.012 |
| J124659.76+030307.2 | 52024,0522,531 | 18.81 | 1.178 | 0.939 | 1.07, 0.60 | 2.91, 2.78 | 1.30 | 2.15 | 0.184 |
| J131058.08+010824.0 | 51985,0295,325 | 17.80 | 1.389 | 0.862 | 0.74, 0.49 | 2.18, 2.27 | 1.33 | 1.46 | 0.209 |
| J144104.80+044348.0 | 52026,0587,329 | 18.42 | 1.112 | 1.040 | 0.97, 0.64 | 2.27, 2.38 | 1.05 | 1.93 | 0.149 |
| J145633.12+544832.4 | 52353,0792,242 | 17.94 | 1.518 | 0.879 | 0.47, 0.45 | 4.02, 3.72 | 1.71 | 3.11 | 0.060 |
| J151247.52+573842.0 | 52079,0612,438 | 18.69 | 2.135 | 1.045 | 0.98, 0.59 | 2.04, 2.28 | 0.75 | 1.57 | 0.139 |
| J153730.96+335837.2 | 52823,1355,633 | 17.44 | 1.024 | 0.913 | 0.38, 0.50 | 1.82, 1.78 | 0.70 | 1.16 | 0.004 |
| J160932.88+462613.2 | 52354,0813,070 | 18.67 | 2.361 | 0.966 | 0.65, 0.36 | 1.07, 0.92 | 0.65 | 0.60 | -0.034 |
| J172739.12+530227.6 | 51821,0359,042 | 17.97 | 1.442 | 0.945 | 0.62, 0.53 | 2.71, 2.57 | 0.98 | 2.17 | -0.027 |
| J173600.00+573104.8 | 51818,0358,529 | 18.18 | 1.824 | 0.872 | 0.81, 0.60 | 2.01, 1.80 | 0.87 | 1.55 | 0.066 |
| J224511.28+130903.6 | 52520,0739,030 | 18.56 | 1.546 | 0.861 | 2.03, 0.93222Multiple absorption line system detected in Mg ii doublet, for which the total EW of both systems is quoted. | 3.99, 3.67 | 1.77 | 3.39 | -0.004 |
| J233917.76-002942.0 | 51877,0385,229 | 18.26 | 1.344 | 0.967 | 0.74, 0.64 | 2.71, 2.44 | 0.85 | 1.80 | 0.108 |
3 Removing the underlying quasar spectra
Traditionally the study of reddening in quasar samples has been a difficult one due to the intrinsic variation in the shape of quasar SEDs. Using the large sample of quasars in the SDSS survey we can however obtain a good estimate of the average quasar spectrum. We do this by creating composite spectra in redshift bins of staggered in redshift by . Each spectrum is corrected for Galactic reddening using the quoted extinction in the SDSS photometric catalogue and the Galactic extinction curve from ?) and ?). The spectra are then moved to the quasar rest frame and normalised by dividing by the median flux in a common wavelength range (avoiding the main quasar emission lines) before all spectra are combined using an arithmetic mean. The statistical power of the SDSS is clear in the shear number of quasar spectra available for such an analysis. Up to a redshift of more than 500 quasars contribute to each composite and only for one quasar in our Ca ii sample does the appropriate composite depend on less than 100 quasars.
By construction, the composite spectra take account of any systematic variation in the quasar SEDs as a function of redshift. It is also important to take account of any possible variation with magnitude. A number of systematic magnitude- or luminosity-dependent effects are evident in the SDSS quasar spectra (?) and applying a magnitude-dependent correction also has the advantage of accounting for any potential small systematic variations of the SDSS spectrophotometry with object flux. For each quasar with detected Ca ii absorption we calculate a correction in slope based on its -band PSF magnitude. The correction is achieved by selecting from those quasars in the correct redshift range the 80 closest in magnitude. A second composite is created from these 80 quasars; dividing this composite by the control spectrum results in a residual spectrum representing the magnitude dependence, to which we fit a straight line. On dividing each of our quasar spectra with Ca ii absorption by their relevant control spectrum, we then use this fitted line to account for potential magnitude dependence. Finally, we combine all 31 spectra, divided by their control spectra and corrected for any magnitude dependence, into a single composite we term the “residual spectrum”.
4 Properties of the sample
In the following subsections we present the measured E(B-V) for the residual spectrum along with the reddening in each object; a Monte Carlo analysis of the significance of the result; the equivalent widths (EW) of important metal lines in the systems and an estimate of the number of DLAs in our sample.
4.1 The average reddening
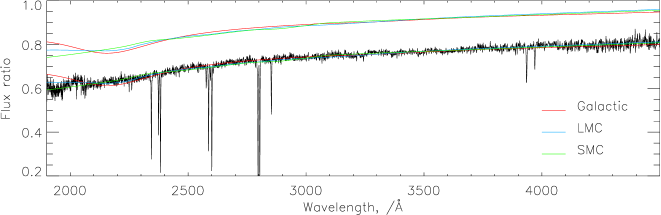
Fig. 1 shows the residual spectrum. Each overplotted dust extinction curve is fitted over a wavelength range of 1900:4500Å excluding the regions containing absorption lines. The LMC and SMC curves are evaluated from the tabulated results of ?) with an of 3.1 and the Galactic curve is evaluated as in Section 3. The similarity of the spectrum to the overplotted dust extinction curves is striking. However, the Galactic 2175Å dust feature appears to be weak or absent. The composite spectrum is consistent with LMC- or SMC-type dust and the best fit curves have values of E(B-V)=0.056 and 0.057. A jackknife error of 0.003 is calculated by removing each absorber in turn from the composite.
4.2 EW Ca ii (H&K) vs. reddening
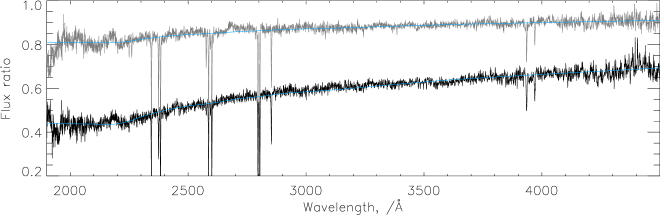
For each absorber we define a continuum around the Ca ii lines using the IRAF routine CONTINUUM to fit a cubic spline to the rest-frame wavelength regions 3800:3930, 3940:3965, 3975:4100. Each spectrum is fit interactively by altering primarily the order of the spline until the best by-eye fit is achieved. The two lines are fit jointly with Gaussian profiles, fixing the wavelength difference to the known value and constraining the width of the two lines to be equal. Two objects (indicated in the table) show evidence for multiple absorption systems. For J093738.16+562837.2 we were able to fit a double Gaussian to all absorption lines, however, for J224511.28+130903.6 this was only possible for Mg ii . In all but one case, in which the quasar is a poor match to the control spectrum, we can fit a dust curve to each residual spectrum individually. Although the results are strongly affected by the variations in the underlying quasar SEDs, the E(B-V) of the best-fit LMC extinction curve is given in the final column of Table 1. Whilst the scatter is large, it is clear that those spectra with large Ca ii EWs in general have a large E(B-V) and are dominating the reddening signal seen in the residual spectrum (Fig. 1). Fig. 2 shows the two residual spectra created from the sample split by the EW of Ca ii (K) at 0.7Å. Fitting LMC dust laws to each, we measure E(B-V)=0.099 and 0.025 for the large and small EW composites respectively. The measured E(B-V) values are stable to the precise EW chosen to split the sample and the conclusions drawn in the final section of the paper are affected little by moving the boundary.
4.3 Monte Carlo simulations of random samples
To confirm that our result is not simply due to the variation in quasar SEDs we create 10 000 Monte Carlo simulations of 31 randomly chosen quasars, randomly assign them a in the same redshift range as the Ca ii absorbers, and treat each sample identically to the actual sample of Ca ii absorbers. Fitting an LMC dust curve to the final residual spectra, we find a maximum E(B-V) of , i.e. we never obtain an E(B-V) as large as that found in the Ca II absorber sample and thus obtain a detection significance of . The distribution of simulation E(B-V) has a variance of 0.01 and a small tail to redder values, possibly due to extinction from the host galaxy.
4.4 Dust obscuration, the proportion of DLAs and HI column density
Extinction of the quasar due to dust in the intervening absorbers will cause objects to be missed from the magnitude limited survey. For each absorber we calculate the extinction to the background quasar at 7500Å in the observed frame (the effective wavelength of the -band that defines the magnitude selection) based on their estimated E(B-V). The average extinction for all objects is = 0.39, with values of 0.67 and 0.18 respectively for the large- and small-EW sub-samples. Assuming our ability to detect Ca ii is unaffected by the magnitude of the background quasars, we can obtain a lower limit on the fraction of Ca ii systems we would have missed due to extinction. A correction factor is calculated as the ratio of the total pathlength searched in quasars within the magnitude limit () to the total pathlength searched in quasars between and . The result is 2.3 for the large-EW sub-sample and the number of absorbers should therefore be corrected from 13 to 30. Equivalently, for the small-EW subsample a factor of 1.1 corrects the number from 18 to 20. Overall a total corrected number of Ca ii systems is therefore expected along the 11 427 sightlines searched with an average E(B-V) = 0.07 i.e. at least 38% of objects are missed. This is consistent with the upper limit expected for DLAs from the radio selected CORALS survey at high redshift (50%). However, our results represent lower limits on the fraction of systems missed: any objects with a higher dust content will not be seen in the SDSS quasar sample.
To assess the implications of our result, it is important to understand the relation between the Ca ii absorbers and DLAs. Firstly, converting the minimum EW(Ca K) detected in our sample (0.2Å) into a column density, N(Ca II) (?), we find Hydrogen column densities of to are required in our Galaxy to achieve similar values of N(Ca II) (?). The conversion does not account for the probable lower metallicity of the DLAs and suggests column densities well in excess of the accepted limit for DLAs. Secondly, using a sample of 197 absorbers with measured N(HI), Rao, Turnshek & Nestor (2005, in preparation) find that, where line EWs are available, all DLAs have EW(Mg ii )/EW(Fe ii )2 and EW(Mg i )0.2Å and these DLAs represent 43% of the Mg ii systems fulfilling this criteria. Also, 8 of 10 systems with EW(2853) Å are confirmed to be DLAs. Table 1 lists the EWs of metal lines for each of our absorbers, measured in a similar way to the Ca ii EWs. 30 of 31 of our objects fall within the (Mg ii ,Fe ii ,Mg i ) criterion and 20 of 31 within the Mg i criterion. These fractions suggest that the majority of our objects are DLAs according to accepted definitions.
We can also make an estimate of the number density of Ca ii absorbers and compare this to values for DLAs. For our sample of 11 427 quasars and absorbers with we search a total . Correcting for the effects of dust extinction we estimate absorbers to lie along this path, giving an . This is of course only a lower limit as it does not account for regions in the spectra of poor S/N ratio prohibiting the identification of Ca ii . ?) find . Performing our own search for Mg ii absorbers in the sample of quasars defined in Section 2, using the Mg ii /Fe ii /Mg i EW criteria above, we find . We conclude that our results are consistent with strong Ca ii absorbers representing 10% of all DLAs.
Finally, by assuming an average value of N(HI) for our absorbers (, calculated from Table 3 of RT00 for ) and taking the obscuration corrected average E(B-V) of 0.07, we can estimate their gas-to-dust ratio to be , which can be compared to that of the Galaxy; (?) and LMC; (?). If our absorbers were to contain column densities of neutral Hydrogen in excess of average DLAs, the value would increase. Multiplying our result by 10 (i.e. assuming the remaining 90% of DLAs not in our sample contains negligible dust) we can estimate a global dust-to-gas ratio for DLAs of , in agreement with the measured lower metallicities of DLAs compared to the Galaxy.
5 Discussion and Conclusions
Recent results have pointed to DLAs as a sample of chemically young galaxies with mixed morphologies and evidence for only small quantities of dust. We have shown that significant reddening due to dust is present in a subsample of intermediate redshift DLAs identified through Ca ii (H&K) absorption. The extinction associated with this detected reddening results in a minimum of 40% of absorbers to be missed from the SDSS magnitude limited sample, a fraction that is just consistent with the conclusions of the CORALS radio-selected sample (which relates to the entire DLA population). The detection of reddening due to dust helps to fill in the gaps in our understanding of the relation between DLAs and other high redshift galaxies - our measured E(B-V) values, representing the upper limit found in DLAs, fit into the lower end of the range covered by Lyman Break Galaxies at z3 (e.g. ?) and gravitational lens galaxies with (?). Follow up observations will add substantially to our knowledge of the morphology and chemical properties of z1 DLAs.
Finally, while criteria based on the properties of Mg ii , Fe ii and Mg i lines can identify DLAs with a success rate of 43%, selection based on the detection of Ca ii (H&K) is likely to increase the success-rate to 100%, albeit at the expense of sensitivity to only 10% of the DLA population. The two selection techniques are complimentary and further comparison of samples defined using both techniques should lead to a greater understanding of the nature of DLAs.
acknowledgements
We would like to thank Max Pettini, Michael Murphy, Chris Akerman and Tae-Sun Kim for valuable discussions and the referee, Joe Liske, for the prompt and thorough response. Also Sandhya Rao for making available to us her most recent results on Mg ii systems in DLAs and Chris Akerman and Sara Ellison for their recent results from the CORALS survey. VW acknowledges the award of a PPARC research studentship. This work made extensive use of the Craig Markwardt IDL library.
Funding for the Sloan Digital Sky Survey (SDSS) has been provided by the Alfred P. Sloan Foundation, the Participating Institutions, the National Aeronautics and Space Administration, the National Science Foundation, the U.S. Department of Energy, the Japanese Monbukagakusho, and the Max Planck Society. The SDSS Web site is http://www.sdss.org/.
The SDSS is managed by the Astrophysical Research Consortium (ARC) for the Participating Institutions. The Participating Institutions are The University of Chicago, Fermilab, the Institute for Advanced Study, the Japan Participation Group, The Johns Hopkins University, Los Alamos National Laboratory, the Max-Planck-Institute for Astronomy (MPIA), the Max-Planck-Institute for Astrophysics (MPA), New Mexico State University, University of Pittsburgh, Princeton University, the United States Naval Observatory, and the University of Washington.
Bibliography
- Akerman C. J., Ellison S. L., Pettini M., Steidel C. C., 2005, submitted A&A
- Cardelli J. A., Clayton G. C., Mathis J. S., 1989, ApJ, 345, 245
- Carilli C. L., Menten K. M., Reid M. J., Rupen M. P., Yun M. S., 1998, ApJ, 494, 175
- Diplas A., Savage B. D., 1994, ApJ, 427, 274
- Ellison S. L., Churchill C. W., Rix S. A., Pettini M., 2004, ApJ, 615, 118
- Ellison S. L., Hall P. B., Lira P., 2005, submitted ApJ
- Ellison S. L., Yan L., Hook I. M., Pettini M., Wall J. V., Shaver P., 2001, A&A, 379, 393
- Falco E. E., Impey C. D., Kochanek C. S., et al. 1999, ApJ, 523, 617
- Fall S. M., Pei Y. C., McMahon R. G., 1989, ApJL, 341, L5
- Hewett P. C., Irwin M. J., Bunclark P., Bridgeland M. T., Kibblewhite E. J., He X. T., Smith M. G., 1985, MNRAS, 213, 971
- Junkkarinen V. T., Cohen R. D., Beaver E. A., Burbidge E. M., Lyons R. W., Madejski G., 2004, ApJ, 614, 658
- Koornneef J., 1982, A&A, 107, 247
- Murphy M. T., Liske J., 2004, MNRAS, 354, L31
- O’Donnell J. E., 1994, ApJ, 422, 158
- Pei Y. C., 1992, ApJ, 395, 130
- Pei Y. C., Fall S. M., Bechtold J., 1991, ApJ, 378, 6
- Pettini M., King D. L., Smith L. J., Hunstead R. W., 1997, ApJ, 478, 536
- Pettini M., Smith L. J., Hunstead R. W., King D. L., 1994, ApJ, 426, 79
- Rao S. M., Turnshek D. A., 2000, ApJS, 130, 1
- Savage B. D., Sembach K. R., 1996, ARAA, 34, 279
- Schneider D. P., Hall P. B., Richards G. T., et al. 2005, astro-ph/0503679
- Sembach K. R., Danks A. C., Savage B. D., 1993, AAPS, 100, 107
- Shapley A. E., Steidel C. C., Adelberger K. L., Dickinson M., Giavalisco M., Pettini M., 2001, ApJ, 562, 95
- Strömgren B., 1948, ApJ, 108, 242
- Wang J., Hall P. B., Ge J., Li A., Schneider D. P., 2004, ApJ, 609, 589
- Wild V., Hewett P. C., 2005, MNRAS, 358, 1083
- Yip C. W., Connolly A. J., Vanden Berk D. E., et al. 2004, AJ, 128, 2603