The Geometry of and Mass Accretion Rate through the Maser Accretion Disk in NGC 4258
Abstract
A maximum likelihood analysis of the NGC 4258 maser positions and velocities reveals a deviation from Keplerian motion in the projected rotation curve of the high-velocity features, corresponding to a km s-1, or 0.8%, flattening of the LOS velocities with respect to Keplerian motion over the range of the high-velocity masers. While there are a number of potential explanations for this flattening, we argue for pure Keplerian rotation in an inclination-warped disk based on the ability of this model to explain a number of otherwise puzzling features of the system. A radial gradient in the disk inclination of 0.034 mas-1 is not only consistent with the observed rotation curve, but it generates a bowl along the near edge of the disk that naturally explains the otherwise puzzling narrow spread in the declinations of the systemic masers. It also explains the existence and location of an apparently recurring flare amongst the systemic masers. There is no significant evidence for non-Keplerian rotation in the inclination-warped disk. An additional implication of the inclination warp is that the disk rises in front of and obscures the central engine at a disk radius of about 8.3 mas, or 0.29 pc. By comparing the observed X-ray column to conditions in the disk at this radius, we argue the disk must be atomic at 0.29 pc. Hence we conclude that the molecular-to-atomic transition occurs just beyond the outermost maser at 0.28 pc and from this we infer an accretion rate of M⊙ yr-1, where () is the standard dimensionless parameterization of the kinematic viscosity. Our model suggests that most of the observed X-ray column arises in the warped accretion disk at 0.29 pc, and that the maser emission is truncated at large radii predominantly as a result of the molecular-to-atomic phase transition originally proposed by Neufeld & Maloney (1995). The inferred accretion rate is consistent with the jet-dominated accretion models of Yuan et al. (2002).
1 Introduction
NGC 4258 (M106) is a prominent barred spiral galaxy (SABbc) located at a distance of 7.2 Mpc (Herrnstein et al. 1998b). It is one of 12 galaxies included in Seyfert’s initial catalog of active galaxies (Seyfert 1943) and it has been studied extensively over a broad range of frequencies and resolutions. On large scales, NGC 4258 is dominated by a pair of anomalous spiral arms positioned between the stellar arms and symmetric with respect to the nucleus. The nonthermal emission from these arms spans many decades in frequency and is probably energized in shocks formed at the interface between the ISM and matter ejected from the nucleus (van der Kruit, Oort, & Mathewson 1972; Ford et al. 1986). Higher resolution H and VLA radio continuum images reveal that the anomalous arms are fed by north-south, multi-strand, twisted jets arising in the active nucleus of NGC 4258 (Cecil, Wilson, & Tully 1992; Cecil, Wilson, & De Pree 1995). The jets bifurcate and bend sharply about 2.6 kpc from the central engine, presumably as a result of interactions with especially dense regions in the ISM (Martin et al. 1989).
Further evidence for nuclear activity comes from IR, optical, and X-ray observations. Chary & Becklin (1997) detect a 4.5 mJy compact central source at 2.2 m whose color is consistent with that of an extincted nonthermal source. The near IR emission is unresolved by the (21 pc) beam. Chary et al. (2000) present higher resolution images between 1 and 18 m, and report nuclear emission unresolved by the beam with a spectral index, , of () and a 1–20 m luminosity of erg s-1. At optical wavelengths, Wilkes et al. (1995) detect faint blue continuum emission and broadened ( km s-1, FWHM) emission in polarized light. This is presumably the scattered emission from an obscured Seyfert 1 nucleus, and NGC 4258 is characterized as a hidden broad line region (HBLR) Seyfert 2 AGN. Wilkes et al. infer a spectral index of and an optical luminosity of erg s-1 or erg s-1, depending on whether the scattering screen is composed of electrons or dust. Finally, NGC 4258 has been observed by several X-ray telescopes over the last decade (see Table 2 of Fruscione et al. (2005) for a summary). The most recent XMM-Newton data of Fruscione et al. (2005) suggest a power law spectrum with a neutral hydrogen absorbing column of cm-2 and an absorption-corrected 2–10 keV luminosity of erg s-1. Taken together, these data imply a bolometric luminosity () of erg s-1.
While informative, none of these data actually resolve the NGC 4258 central engine on sub-parsec-scales, where the details of the accretion processes powering the AGN are likely to be uncovered. Fortunately, NGC 4258 contains a remarkable nuclear water maser, and VLBI observations of these dense molecular gas tracers provide a unique window into the sub-parsec-scale structure of the AGN. The NGC 4258 water maser was initially discovered by Claussen, Heiligman, & Lo (1984) and was shown to be confined to the inner 3 pc of the galaxy shortly thereafter (Claussen & Lo 1986). The unexpected discovery of maser emission offset km s-1 on either side of the brighter emission at the galaxy systemic velocity of 470 km s-1 (Nakai, Inoue, & Miyoshi 1993) suggested the possibility of a rapidly rotating structure. Greenhill et al. (1995a) showed that the systemic masers lie along a narrow, east-west structure spanning 4 mas and reported a striking linear relationship between position and line-of-sight (LOS) velocity that, in the context of disk models, suggested either solid body rotation or confinement to a narrow range of radii. In parallel with these developments, two teams were completing comprehensive, 10-year, single-dish monitoring programs of the systemic maser emission. Both Haschick, Baan, & Peng (1994) and Greenhill et al. (1995b) reported a secular drift in the systemic maser LOS velocities of about 9 km s-1 yr-1. In addition, Greenhill et al. made the preliminary conclusion that the high-velocity masers show no acceleration. Watson & Wallin (1994) were the first to propose a self-consistent disk model in which the systemic masers lie along a narrow annulus at the near edge of an edge-on disk and the high-velocity masers are near the diameter defined by the intersection of the disk with the plane of the sky (the midline).
The VLBI image produced by Miyoshi et al. (1995) provides the first unequivocal demonstration that the masers trace a well-organized rotating disk (see Figure 1). The bulk of high-velocity masers extends from 0.17 to 0.28 pc on either side of the systemic masers and apparently obeys a Keplerian rotation law. (Note that an isolated feature has been detected recently at 0.12 pc (Modjaz et al. 2005).) The rotation curve requires a central binding mass of M⊙ and a central density of at least M⊙ pc-3. This central mass, together with the systemic maser position-velocity gradient and LOS accelerations, indicates the systemic masers occupy a narrow annulus 0.14 pc from the central engine and spanning in disk azimuth along the near edge of the disk. At 1100 km s-1 it takes individual masers about 10 years to traverse the entire envelope of systemic emission. The systemic masers lie about 0.02 pc south of the disk center as determined from the high-velocity masers, requiring that the disk be tipped down about from edge on. The lack of structure in the vertical positions of the systemic masers implies that the aspect ratio of the disk is less than about 0.2% and that the portion of the disk traced by the masers is extremely thin (Moran et al. 1995). Because the high-velocity masers are confined to within several degrees of the midline by their small observed accelerations (Bragg et al. 2000), the systematic curvature in the declinations of these features implies that the disk is warped. The data are well fit by a gradual change in the position angle of the disk between 0.17 and 0.28 pc (Herrnstein 1997). Herrnstein, Greenhill, & Moran (1996) use this warp to explain the relative faintness of the blue-shifted emission. An ongoing multi-epoch VLBA monitoring program has detected as yr-1 proper motions of the systemic masers as they sweep in front of the background jet at 1100 km s-1. In addition to confirming the disk geometry, these proper motions, together with the accelerations, provide a geometric distance to the galaxy (Herrnstein et al. 1998b).
High-frequency VLBA continuum observations have uncovered a compact jet elongated along the rotation axis of the disk, and well-aligned with the large scale jets at the base of the anomalous arms (Herrnstein et al. 1997). The pc offset between the jet emission and the central engine is consistent with optical depth effects along a mildly relativistic jet (Blandford & Konigl 1979). The southern jet is 5–10 times weaker than the northern jet, and this is probably due to thermal absorption in the disk. Furthermore, while the high-velocity masers presumably amplify their own spontaneous emission (the velocity gain paths being longest along the midline), the systemic masers most likely amplify the southern jet, which lies directly behind them. VLBA observations provide a 3- upper limit of 220 Jy on any 22 GHz continuum emission coincident with the central engine (Herrnstein et al. 1998a).
Bragg et al. (2000) report the detection with the VLA of a flare in the systemic spectrum in 1996, at a velocity of 492.6 km s-1 LSR. The flux density of this flare was 20 Jy, a factor of 4–5 brighter than the typical peak in the systemic emission. The flare maximum was observed on 29 March 1996. There is some evidence for above-normal emission at the same velocity in the preceding observation of February 26. However, the observation following the flare peak, on 10 May 1996, shows no evidence of the flare. From these data, an upper limit on the flare lifetime of days is inferred.
While the warped-disk model derived from the positions, LOS velocities, motions, and accelerations of the NGC 4258 masers is compelling in its completeness and self-consistency, several important questions remain unanswered. In particular, in spite of all that is known about this AGN central engine, the accretion rate, , through the disk is still a matter of speculation. The central mass together with the estimated bolometric luminosity indicate a highly sub-Eddington system, , the Eddington luminosity corresponding to the central mass. In fact, NGC 4258 is quite characteristic of the ubiquitous class of relatively faint AGN known collectively as low luminosity AGN (LLAGN). A determination of might provide a means to discriminate amongst the various accretion modes that have been proposed in NGC 4258, and shed some light on accretion processes in LLAGN in general. Unfortunately, the infall motions of the gas cannot be measured directly in NGC 4258, and estimates for have been indirect and insufficiently precise to constrain the accretion models.
A second category of unanswered questions concerns the geometry of the disk itself. The warping in the position angle of the disk is immediately obvious because the disk mid-line is well-sampled by the high-velocity masers. A corresponding warping in the inclination () of the disk (i.e. ) is very likely, as the alternative would imply that we observe the disk from a very special perspective. Unfortunately, the sparse sampling of the disk means that observations are not terribly sensitive to an inclination warp (Herrnstein, Greenhill, & Moran 1996). There are also questions concerning the precise locations of the masers in the disk. It has long been appreciated that the high-velocity masers probably occupy the midline because this is where the velocity gain paths are longest. Furthermore, Neufeld & Maloney (1995) explain the outer edge of the maser emission in the context of a molecular-to-atomic phase transition. However, there is no compelling explanation for why the systemic masers are so narrowly clustered in declination and apparently in radius. Nor is it understood why the high-velocity features possess an apparently abrupt inner edge at 0.17 pc on both the red-shifted and blue-shifted sides of the disk.
In this paper we use the shape of the high-velocity maser rotation curve to explore the three-dimensional geometry of the disk between 0.14 and 0.28 pc. We find that an inclination warp consistent with the rotation curve also naturally explains the morphology of the systemic masers. In addition, we report the discovery of a second flare at the same velocity as the first, and show how the inclination warp can explain this apparently recurring feature of the system. An additional implication of the inclination warp is that the disk itself obscures the central engine X-ray emission. By comparing the observed X-ray column to the predicted disk column, we are able to place tight constraints on the accretion rate through the maser disk.
Section 2 discusses the data and observations utilized in the analysis. Section 3 presents the rotation curve fits. Section 4 demonstrates that the inclination-warp model provides a compelling explanation for the otherwise puzzling geometry of the systemic masers. In Section 5 we consider various implications of the inclination warp, focusing on the X-ray column and the accretion rate. Section 6 presents concluding remarks.
2 Observations and Data
The purpose of this analysis is to explore deviations from pure Keplerian rotation in the projected rotation curve of the high-velocity masers. Isolating such deviations requires careful statistical analysis, since the precise shape of the rotation curve correlates strongly with several additional fitted parameters, most notably the position of the disk center. We attempt to minimize statistical uncertainties in our results by combining a number of datasets, listed in Table 1. The first four epochs (designated ’L’ in the table) were designed to deliver synthesis maps over the entire range of maser emission. The principle objective of the ’C’ epochs, on the other hand, was high-sensitivity, as relative-position images of the central continuum, and they yielded synthesis maps for the systemic masers only. Each of the epochs included the entire VLBA111The National Radio Astronomy Observatory is a facility of the National Science Foundation operated under cooperative agreement by Associated Universities, Inc. plus the phased VLA acting as a single large aperture. The NRAO 140-foot and Effelsberg 100-meter were included in several of the experiments. The relatively narrow bandwidth provided by the VLA complicated the observations considerably. While the masers span about 150 MHz, the VLA is limited to a 50 MHz bandwidth in each polarization. Thus, in each observation one polarization was centered on the systemic masers while the other polarization alternated between either the red-shifted and blue-shifted masers (’L’), or bands devoid of maser emission, well outside of the highest-velocity masers (’C’). In the ’L’ configuration we observed a total of four 8-MHz bands, and correlated 512 spectral channels across each band giving a spectral resolution of about 0.22 km s-1. The ’C’ configuration utilized eight 8-MHz bands and 256 channels, giving a spectral resolution of 0.44 km s-1 across the systemic maser emission. In both frequency setups, the interferometer was stabilized by applying the phase of a single strong systemic maser to the entire spectrum. While this results in the loss of all absolute position information, it provides relative positions of a small fraction of the 500 as beam.
Our need to phase reference across the full 150 MHz spectrum, and across different polarizations, introduced a number of complications into the data reduction (Herrnstein 1997). Errors, , in the absolute position of the reference maser lead to second order errors in maser positions of , where is the offset in frequency between the reference and imaged maser, and is the observing frequency. This amounts to 3.5 as mas-1 at 22 GHz, across the 75 MHz spread of the NGC 4258 maser. In this analysis, we reference all the data to the systemic maser at 510 km s-1 using the position derived by Herrnstein (1997) via a fringe rate analysis on four VLBA epochs:
(J2000)
(J2000)
The mas uncertainty in the reference maser corresponds to a negligible 18 as uncertainty across the full extent of NGC 4258. In general, broad bandwidth phase referencing leads to a heightened sensitivity to all forms of delay-like errors. As a result, delay calibrators were observed at 10–20 minute intervals throughout the experiments. These calibrators were also used to calibrate the relative phase offsets between the two polarizations, a critical step in the calibration process given our need to phase reference across polarizations. The VLA was phased-up on a nearby, strong calibrator prior to each NGC 4258 scan, and typically maintained phase coherence at the 80–90% level across the 10–15 minute NGC 4258 scans. The relative amount of time on phase-up sources and on NGC 4258 at the VLA was adjusted in real time according to changes in weather conditions and phase stability.
Each spectral channel was imaged using the standard image deconvolution techniques provided in AIPS. Thermal noises of between 10 and 20 mJy per beam per spectral channel were achieved. All features stronger than that occurred in two adjacent frequency planes within a beam of one another were considered significant. The centroided positions of these features were determined using a Gaussian fitting routine in AIPS. Figure 1 includes a spectrum derived from the image cubes in this way. The positions and velocities of individual masers were derived from this spectrum using a crude feature decomposition algorithm. Each peak in the interferometric spectrum was assumed to correspond to a distinct maser feature. The peaks were determined from numerical first and second derivatives of the spectrum, and the positions and velocities of the resulting maser features are the flux-weighted averages around these peaks. The result is 25–35 systemic masers, 10–20 red-shifted masers, and 2–4 blue-shifted masers, per epoch. Each epoch was referenced to the same point in the systemic maser emission envelope to ensure consistency. Continuum maps were generated by averaging all maser-free channels.
2.1 Single-Dish Monitoring of the Systemic Spectrum
In hopes of detecting additional systemic flares, the low-velocity maser spectrum of NGC4258 was monitored from 1997 January 27 to 1997 June 24 with the 37-meter diameter antenna of the Haystack Observatory. Eleven epochs were observed. Position-switched total power spectra were calibrated using a system temperature referenced to outside the atmosphere and corrected for elevation dependent antenna gain using a standard model for the antenna. For each observing track, we observed continuum sources 4C39.25 and 1308+326 to calibrate offsets in antenna pointing. To correct for pointing errors within one hour of transit (elevations ), we sampled the peak line intensity every minutes and rescaled the spectra to achieve a level response. The calibration of the spectrum compiled for each epoch is accurate to .
We used a 17.8 MHz bandwidth in one circular polarization and obtained 8192 channel spectra to which we applied a boxcar convolving function to obtain a channel spacing of 21.7 kHz (0.293 km s-1). The rms noise after removal of a spectral baseline was 0.1 to 0.2 Jy per channel for the 11 epochs.
3 The High-Velocity Rotation Curve
3.1 The Basic Model
The shape of the high-velocity rotation curve is explored using a minimization analysis comparing model LOS velocities to measured velocities. The details are described in this section. In the interest of generality, we revert to angular coordinates for the maser positions. Thus, the systemic masers are clustered about a disk radius of 3.9 mas, the high-velocity masers extend from 4.5 to 8.1 mas, and at 7.2 Mpc, one mas equals 0.035 pc. The basic thin-disk model assumes that the masers obey simple Keplerian motion:
| (1) |
Here, and are the angular sky coordinates of the maser, is the gravitational constant, is the central mass () over the distance (), and and specify the disk center. For masers assumed to be along the midline, this rotation velocity is related to the LOS velocity () according to
| (2) |
where and are the inclination ( corresponding to edge-on) and systemic velocity of the disk, respectively.
Rotation curve models are assessed by comparing to the observed maser LOS velocities. Special and general relativistic effects play a significant role in the transformation from observed frequency to LOS velocity for the masers. Since the relativistic corrections are model-dependent, we choose to remove them from the model LOS velocities instead of including them in the observed velocities. Hence, the relativity-corrected model LOS velocity () is given by (see, for example, Herrnstein 1997 for details)
| (3) |
where
| (4) |
These model velocities are compared to the observed velocities () as derived by the classical expression for the Doppler shift (optical definition):
| (5) |
where is the rest frequency of the water transition (22.23508 GHz), and is the observed frequency of the maser. Our ability to decompose the model velocities into classical and relativistic terms (Equation 3) is a convenient by-product of using the optical Doppler shift expression.
The of the model fit is given by:
| (6) |
where the summation is over all high-velocity maser features, are the combined uncertainties in the model and observed velocities, and and are geometric correction factors discussed below. Because of the excellent spectral resolution of the VLBA, is dominated by uncertainties in the model velocities as a result of uncertainties in the measured positions of the masers:
| (7) |
where is the uncertainty in the right ascension of the feature, given approximately by . Here, is the x-component of the synthesized beam and SNR is the signal-to-noise ratio. We are justified in ignoring the contribution of to because of the east-west orientation of the disk. and in Equation 6 correct for the oversimplification of assuming that all the masers lie precisely along the midline. Observations of high-velocity maser accelerations indicate a scatter about the midline of (Bragg et al. 2000). In the present analysis, we assume that the masers are scattered with a uniform probability distribution about the midline by an angle , taken to be independent of radius. In Equation 6, accounts for the fact that this scatter will impose a downward bias on the observed LOS velocities. Similarly, specifies the magnitude of the additional uncertainty in the velocities as a result of this scatter. These terms are related to as follows:
| (8) |
and
| (9) |
The in Equation 6 is minimized, via a downhill simplex algorithm, by varying , , , , and , where the disk center is measured with respect to the phase center of the observations, corresponding to the position of the maser at 510 km s-1. Each line in the high-velocity spectra was associated with a distinct maser feature, and positions were derived as the flux-weighted average across each line. The four “L”-setup epochs listed in Table 1 provide a total of 99 red features and 17 blue features for the fits. Ultimately, it is the relative paucity of blue-shifted features that constrains the quality of the fits.
In practice the high-velocity rotation curve can only be used to constrain three of the disk parameters, since and are degenerate, and since the approximate east-west orientation of the disk renders the high-velocity fit insensitive to . The results of this section are insensitive to , and we use mas as estimated by Herrnstein (1997), based on high-velocity maser spatial symmetry considerations. The inclination can be determined from the positions and velocities of the systemic masers. Herrnstein (1997) reports at a radius of 3.9 mas for a global model incorporating a radius-dependent position angle, and a constant inclination. Here, we adopt at 3.9 mas because this results in a consistency between the positions of the systemic masers and the bowl model derived from the high-velocity data. In fact, the conclusions of this section are not substantively affected by the choice of inclination over a range of values consistent with Herrnstein (1997).
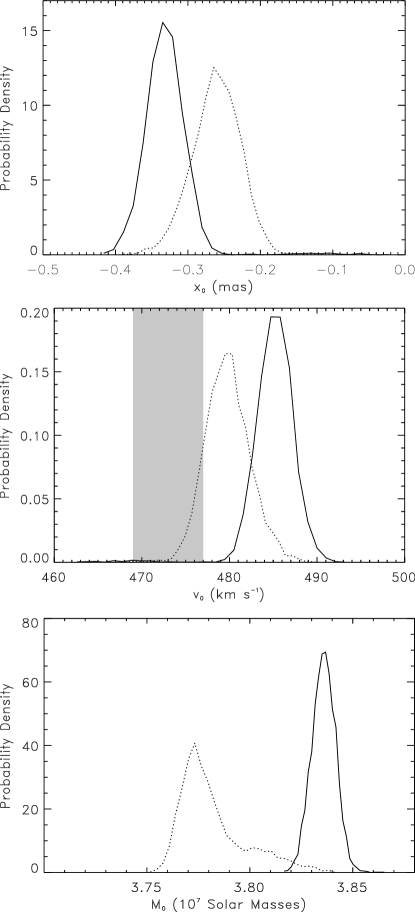
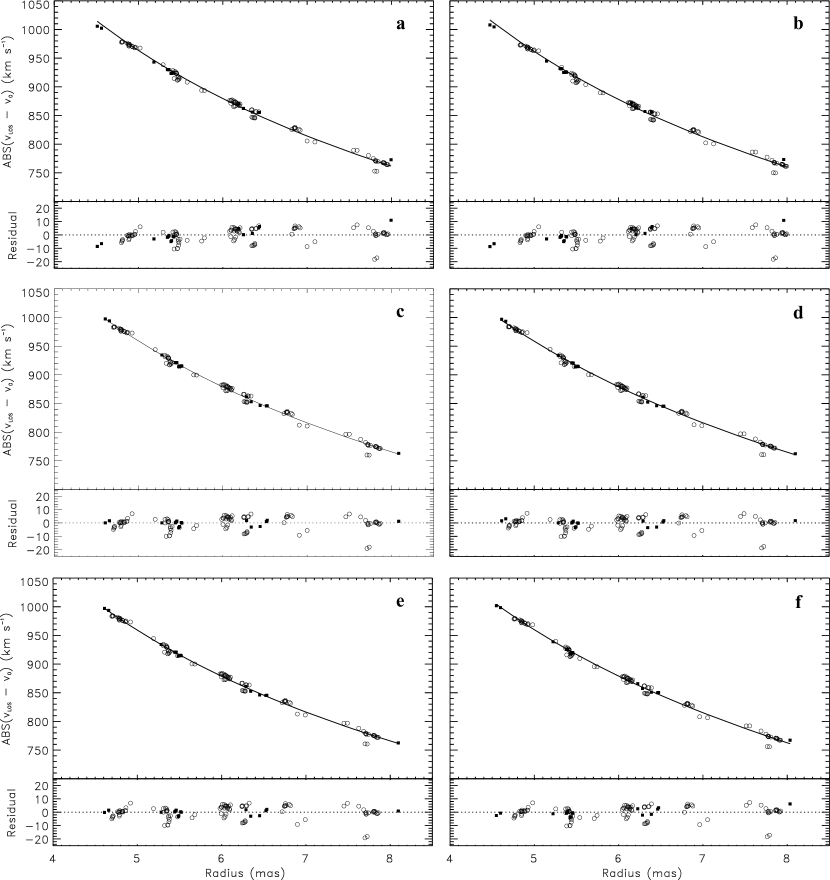
The results of our analyses are shown in Table 2. The first two rows of Table 2 show the disk center parameters for the best-fitting pure-Keplerian rotation curve model, neglecting and incorporating relativistic effects, respectively. The quoted uncertainties are based on the probability density functions of Figure 2, which are derived via a Monte Carlo analysis in which minimizations are performed on an ensemble of idealized datasets with sampling and noise commensurate with the true data. Panels and of Figure 3 show rotation curves and residuals for these models. A of , corresponding to a velocity scatter of km s-1 at km s-1, is needed to bring the reduced close to one. Models positioning the masers precisely along the midline yield reduced of over 200. Hence, the rotation curve fits provide a highly significant statistical detection of the scatter around the midline that is in good agreement with the Bragg et al. (2000) measured value of .
As reported in earlier results, the projected rotation curve is at least qualitatively well-fit by a Keplerian rotation law. The data do not yield an unambiguous detection of relativistic effects primarily as a result of parameter correlation and the relatively sparse blue coverage. These effects are nevertheless incorporated in all subsequent models.
3.2 Refinements
We search for deviations from pure Keplerian motion by considering four different modifications to the central point-mass, Keplerian rotation, constant-inclination disk model discussed above.
3.2.1 Model 0 – Non-Keplerian Rotation
This first refinement is the most direct and arguably the least enlightening probe of the NGC 4258 rotation curve. We search for non-Keplerian rotation across the high-velocity masers by replacing Equation 1 by
| (10) |
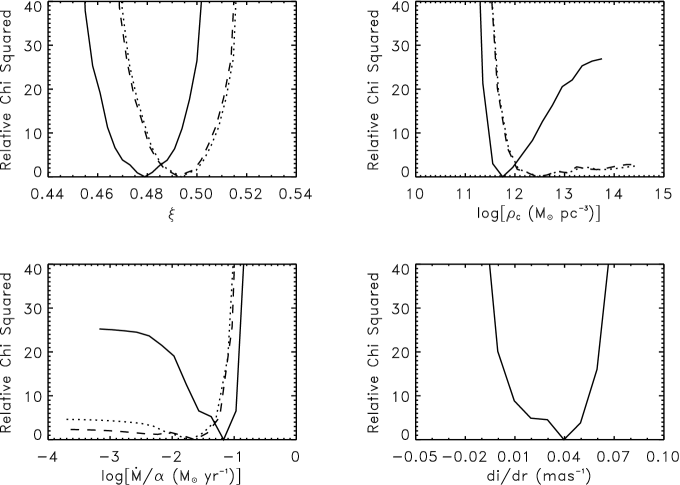
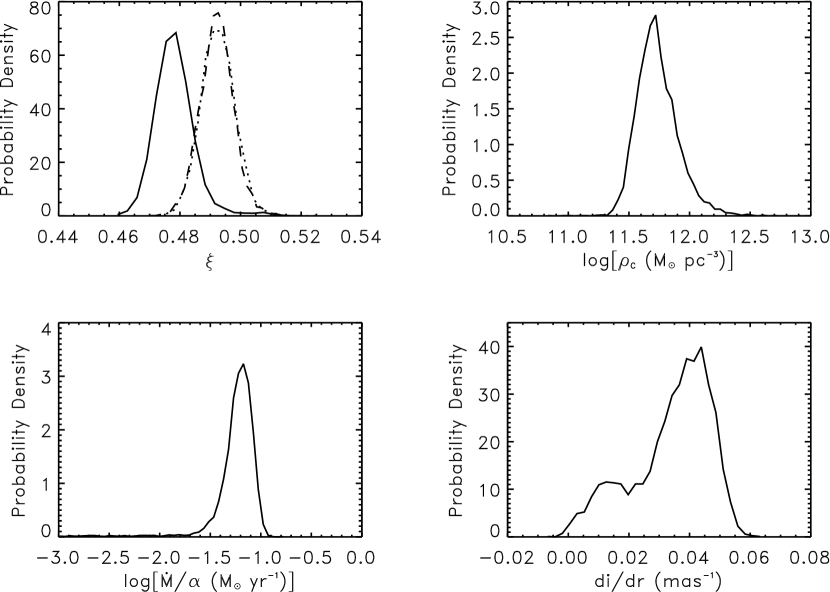
and including as a fourth parameter in the maximum likelihood analysis. The discrepancy between and 0.5 measures the deviation from Keplerian rotation in the LOS velocities of the masers. Table 2 and panel of Figure 3 show the results of such an analysis. The reduction in the reduced is highly significant, and the systematics of the blue residuals are noticeably improved. Figure 4 shows relative as a function of , and Figure 5 shows the probability density function, derived from the Monte Carlo technique described above. We find evidence for deviation from Keplerian rotation () in the NGC 4258 disk, with a preferred rotation law of . This amounts to a total flattening in the high-velocity rotation curve of about km s-1 across the high-velocity masers.
3.2.2 Model 1: – Central Cluster
Maoz (1995) explored the possibility that the binding mass at the center of the NGC 4258 disk is not a supermassive black hole, but a spherically symmetric cluster of objects. Since such a cluster cannot have abrupt edges, Maoz was able to place a lower limit on the cluster core density based on the precision of the Keplerian rotation curve. However, this analysis relied on the relatively crude upper limits on the deviation from Keplerian rotation available at the time, and we duplicate it here using the formalism developed in the previous section.
Following Maoz, we consider the possibility that all the binding mass resides in a spherically symmetric Plummer-model cluster at the center of the disk. The mass distribution is then parameterized in terms of the core density and radius ( and ) as follows:
| (11) |
The cluster model is implemented in the analysis by associating with in Equation 1 and adding as a fourth parameter in the fit. Once again, Table 2 indicates a significant improvement in the reduced over pure Keplerian models, and Figure 3 shows the fit and its residuals.
A disk obeying perfect Keplerian rotation would not possess a minimum. Instead, the relative would asymptotically approach zero for large values of and such an analysis would provide only a lower limit on . The minimum in relative evident in Figure 4 therefore implies a significantly flattened rotation curve. Specifically, we find M⊙ pc-3(Figure 5), a core radius of mas ( cm), a total cluster mass between the inner and outermost masers of M⊙, and a resulting rotation curve flattening of 10.9 km s-1 across the high-velocity masers.
3.2.3 Model 2 – Massive Disk
We now consider the possibility that mass in the outer accretion disk itself is responsible for flattening the rotation curve. The maser observations provide direct evidence that the outer disk is thin, cool, and dense. For a thin, isothermal, steady-state accretion disk in hydrostatic equilibrium (c.f. Frank, King, & Raine 2002), the scale height is , and the midplane density as a function of radial distance can be written (Neufeld & Maloney 1995):
| (12) |
where is the central mass, is the accretion rate, is the sound speed, and is the Shakura-Sunyaev parameter of the kinematic viscosity. Integration of Equation 12 gives the mass of disk, , within the inner and outer boundaries of the maser emission, and ,
| (13) |
where and are in pc, is in km s-1, is in solar masses per year and is in solar masses. The disk mass internal to the maser feature () is estimated from Equation 13, using and (the radius of the innermost maser), and assuming km s-1, corresponding to a temperature of 800 K. Theoretical models predict that temperatures between 500 and 1000 K are most conducive to the formation of water masers.
A massive disk is included in the rotation curve model by incorporating as a fourth parameter in the fit and replacing in Equation 1 by , where the distance, , is taken to be 7.2 Mpc. The reduced improvement is comparable to the cluster model results (Table 2), and the rotation curve and residuals are included in Figure 3. As with the central cluster analysis of the previous section, the pronounced minimum in relative evident in Figure 4 implies a significantly flattened rotation curve. The analysis favors an accretion rate of M⊙ yr-1(Figure 5), which leads to a total disk mass of M⊙ and a km s-1 flattening in the rotation curve across the high-velocity masers. Note that for this disk mass the midplane densities at the inner and outer radii of 0.14 and 0.28 pc are and cm-3 respectively, about an order of magnitude above the normally preferred range for maser emission of to cm-3. Hence, the disk conditions implied by the existence of maser emission make this model unlikely.
3.2.4 Model 3 – Inclination Warp
The disk geometry is parameterized in terms of two Euler angles: the position angle () is azimuthal about the LOS while the inclination angle is polar. A warped disk can be described by allowing these angles to vary with radius. While the specific functional relationship between and and will depend on the perspective of the observer, it can be expected that both Euler angles will have some radial dependence. As discussed in Section 1, the declinations of the high-velocity masers are well-fit by a position angle obeying a second order polynomial in radius. Thus, it seems likely that the inclination of the disk will also vary with radius. Such an inclination warp will manifest itself as an apparent deviation from pure Keplerian rotation in the LOS velocities of the high-velocity masers.
We quantify this effect by postulating the following (ad hoc) linear inclination warp model:
| (14) |
where is the inclination of the disk at the radius of the maser. As discussed above, and are fixed at and 3.9 mas, respectively, based on observations of the systemic masers. The inclination warp is added to the projected rotation curve fit by replacing by in Equation 2 and including as a fourth free parameter. This leads to a significant improvement in the reduced over pure Keplerian, constant-inclination models (Table 2) and the model and residuals are shown in Figure 3. The analysis prefers an inclination gradient of mas-1 across the high-velocity masers (Figures 4 and 5). Consistent with previous results, this corresponds to a rotation curve flattening of about 9.6 km s-1 across the high-velocity emission. In this model, the inclination of the disk changes from at the radii of the systemic masers (3.9 mas), to about at the radius of the outermost high-velocity feature (8.1 mas). The magnitude of the inclination warp is approximately equivalent to that of the position angle warp.
We emphasize that, unlike the other models under consideration, the inclination warp model does not indicate non-Keplerian motions in the NGC 4258 disk, but rather radius dependent projection effects in the disk.
3.3 Discussion
While there is compelling evidence for a km s-1 flattening in the projected rotation curve of the high-velocity masers, its physical origin is ambiguous. In the previous sections, we have examined three possible mechanisms, each in principle capable of generating the observed rotation curve. Not surprisingly, the parameters defining these three mechanisms are highly correlated with one another. Furthermore, because an inclination warp is capable of both flattening and steepening the rotation curve, the actual disk could in fact incorporate any combination of these effects. This is demonstrated graphically in Figure 6, which shows contours of constant throughout the – plane. The correlation between the parameters is clear, and arbitrarily large can be supported by positing negative values for without incurring too dramatic an increase in . This limits our ability to place firm limits on either or from the high-velocity rotation curve alone. We note in passing that the overall minimum in the joint of Figure 6 suggests a detection of the effects of finite mass in an inclination-warped disk. However, the detection is very weak (a of for the inclusion of as a new parameter) and the densities implied by the preferred accretion rate are inconsistent with the existence of masers.
The three mechanisms considered above are not intended to be an exhaustive list of the mechanisms capable of flattening the projected rotation curve. For example, it might be possible to fit the rotation curve without violating the acceleration data by systematically displacing the innermost masers farther from the midline than the outer masers. We merely note in passing that such a geometry is counterintuitive in that the envelope of maser emission is expected to grow with radius, along with the coherent velocity gain paths.
4 The Systemic Masers and the Inclination Warp
The previous section suggests that additional information is required to discern the true origin for the flattened rotation curve. In this section we show that the inclination warp derived from the high-velocity masers provides a compelling explanation for the morphology of the systemic masers. Based on this we conclude that inclination warping is indeed the source of the apparently flattened rotation curve. We begin by first demonstrating that there are substantial unanswered questions surrounding the geometry of the systemic features. We then show that the inclination warp answers these questions convincingly.
4.1 The Systemic Masers
The initial VLBA observations of the NGC 4258 masers (1994 April) failed to detect any vertical structure in the systemic masers at the 10 as level, leading Moran et al. (1995) to conclude that the disk aspect ratio () must be less than about 0.25%. We have repeated this analysis using epochs 6–8 in Table 1. These observations include the Effelsberg 100-m antenna and are about three times more sensitive to vertical structure. The results are shown in Figure 7. The slope of the best-fitting line suggests the systemic masers trace a disk with a position angle. The linear fit has a reduced of 82 when the -coordinate instrumental uncertainties are used, indicating a highly significant detection of vertical structure in the systemic masers. Specifically, a reduced of one is achieved by adding in quadrature an additional scatter in () of 8 as or 0.00024 pc, indicating that % at the radius of the systemic masers.
For a constant inclination disk, the narrow spread in of the systemic masers is puzzling in light of the fact that the high-velocity masers extend from 4.7 to 8.1 mas. It is even more surprising when we consider that the systemic masers apparently amplify background continuum emission from the compact nuclear jet. Figure 8 shows, for a constant-inclination disk, (distance along the LOS) versus along the radial perpendicular to the disk midline, with disk azimuth () of . is measured in the direction of rotation from the ascending node of the disk, such that for the red-shifted masers. The LOS velocities of the systemic masers range from about km s-1 to km s-1 indicating that they occupy a arc centered about . This is a natural place for masers to occur since, together with the midline, it is the location in the disk where is a minimum. Furthermore, as long as the dependence of position angle on radius is not too steep at small radii, jet emission aligned with the rotation axis of the disk lies behind the radial irrespective of position angle, and masers located here are well-situated to amplify background jet emission.
The vertical dash in Figure 8 marks the position and spread of the systemic masers. Continuum emission has been detected in seven of eight VLBA epochs. The northern jet emission is variable in both strength, ranging from less than 2 mJy to 6 mJy, and in position, with northern offsets between 0.35 and 1.0 mas. The southern jet has remained relatively stable at 0.5 mJy and 1.0 mas South of the disk center (Herrnstein et al. 1997, 1998a). The observed range of northern jet emission is marked by the upper shaded oval in Figure 8. The southern shaded oval is the reflection of the northern emission through the disk center, and the asterisk marks the location of the observed southern emission. Herrnstein, Greenhill, & Moran (1996) demonstrate that any portion of the disk directly exposed to the central X-rays will develop a thin layer of ionized gas with 22-GHz free-free optical depths of that scales as . They further propose that the southern jet appears weaker and is displaced southward as a result of thermal absorption in the disk. Figure 8 shows that if the jet is symmetric, the brightest 22 GHz emission lies directly behind the systemic masers suggesting that these masers amplify southern jet emission that is otherwise obscured from view by the disk itself. In this scenario, the extremely bright systemic masers are only mildly saturated, and their variability is naturally explained by variability in the background continuum. Both the northern jet continuum and the systemic masers vary on timescales of weeks.
Clearly there is a serious inconsistency between the background amplification models and the observed narrow extent of the systemic masers at . While the background 22 GHz continuum radiation extends to mas with respect to the disk center, the systemic maser emission is narrowly confined around mas. Furthermore, symmetry with the northern jet emission would imply that amplifying systemic masers should range in from -0.35 mas to -1.0, about a factor of ten larger than the observed spread. Of course, the bright systemic masers require both background seed photons and an inverted population of water molecules. However, it is very difficult to construct a pumping mechanism that leads to such a narrow annulus of inverted molecules. Neufeld & Maloney (1995) show that the high-velocity masers are pumped by direct exposure to the central X-ray emission, as a result of the position angle warp. No plausible inclination warp would yield such a narrow cusp of pumped water on the near edge of the disk. One possibility is that the outer cool disk is truncated within 3.9 mas, and that the systemic masers trace the narrow annulus of pumped gas along the inner edge of the disk. However, we know of no physical explanation for such a truncation.
The narrow spread in the systemic declinations can also place more quantitative restrictions on a constant-inclination disk. For a disk with no inclination warp, the observed scatter in places a firm upper limit on the radial scatter () of the systemic masers. For a disk tipped down from edge-on, , and the detected vertical scatter in the systemic masers requires mas ( pc). Thus, for a constant-inclination disk, the narrow spread in of the systemic masers requires a fractional radial spread of less than 1.5% at a radius of 3.9 mas. This requirement can be tested directly using the velocities of the systemic masers.
If the systemic masers are indeed distributed azimuthally in a Keplerian disk, then
| (15) |
where is the disk position angle. The instrumental uncertainties in the velocity are negligible, and we express the uncertainty in , , as the quadrature sum of two terms:
| (16) |
where is the instrumental uncertainty in right ascension and is the projected near edge of the disk where the observed LOS velocity is precisely the systemic velocity and is independent of radius. 270 km s-1 mas-1 is the well-constrained prior on the position-velocity slope based on numerous, past observations. The first term in the sum is the straightforward propagation of position uncertainties through to , while the second propagates through to .
The fit in the upper panels of Figure 9 uses in conformation with the upper limit on the fractional scatter in radius from the observed scatter in . The resulting reduced of 40 demonstrates a significant inconsistency in the distributions of the declinations and velocities of the systemic masers in the context of a constant-inclination disk. In the lower panels a reduced of one is achieved for , a factor of 10 larger than indicated by the declination data. Hence, a constant-inclination disk model is unable to accommodate both the extremely narrow scatter in declination and the more substantial velocity deviations of the systemic masers.
4.2 The Inclination Warp: Masers in a Bowl
In the rotation curve analysis of Section 3.2.4 we found mas-1. In the sections that follow, we will assess this estimate based on a variety of considerations involving the systemic masers. The resulting refined estimate for the inclination warp, , of 0.034 mas-1 is the best-guess estimate for the warp based on the high-velocity and systemic data together. In motivating the inclination warp in the present section, we are justified in using this value for the warp, as it is well within the uncertainties indicated by the high velocity data alone (Figure 5).
Figure 10 shows the cross-section of a disk with mas-1. At the observed -offset of the systemic masers, marked by the vertical dash in the figure, . In other words, for a consistent with the high-velocity rotation curve, the systemic masers lie at the bottom of a bowl along the near edge of the disk, as viewed from our perspective. That the systemic masers lie on the disk at all at is critically sensitive to our choices for , , and , and indeed determined the values used for these parameters in the fits of Section 3.2.4. However, the fact that these high-velocity fits lead to a geometry in which the systemic masers lie at a tangent point to the disk is either a remarkable coincidence or of physical significance.
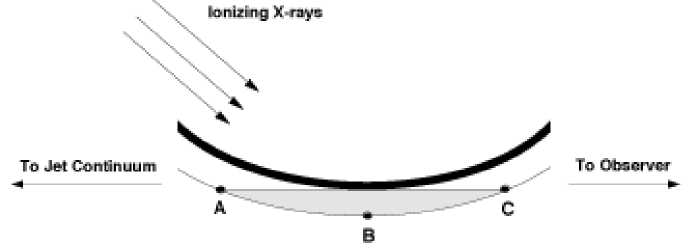
In fact, there is a compelling reason the brightest systemic emission should occur at the bottom of such a bowl. Figure 11 is a schematic representation of the bowl cross-section. The upper surface of the bowl is directly exposed to X-rays from the central engine and will therefore possess the aforementioned thin surface layer of ionized gas with optical depths . Any molecular gas suitable for supporting masers will lie underneath this ionized gas. Three radii are labeled in the Figure: B marks the bottom of the bowl, while points A and C delineate the range of radii with unattenuated sightlines to both the background continuum and us. Water molecules internal to A will have an unobstructed view of the background jet. However, any maser emission generated in this gas must traverse two ionized surfaces of the bowl along the LOS to us and will therefore be attenuated by a factor . Similarly, while molecular gas external to C will have an unobstructed LOS to us, it will have an equally attenuated view of the background continuum and will effectively be limited to self amplification. By analogy with the self-amplified high-velocity masers, such emission is likely to be at least 20 times weaker than the background amplified emission in the shaded region at the bottom of the bowl.
A significant shortcoming of the constant-inclination disk model is its inability to explain the narrow -confinement of the systemic masers (Figure 8). In contrast, the bowl model predicts that the brightest systemic emission ought to lie at the bowl bottom in a narrow declination band on the sky, corresponding to the thickness of the masing region along the bottom of the bowl (shaded region in Figure 11). Figure 10 shows that this is indeed the case for the estimated from the high-velocity data. In addition to predicting that the brightest systemic emission arises in the bowl bottom, the bowl model also allows for much ( times) fainter systemic emission at larger or smaller radii, as described above. Such emission is not ruled out in the present analysis.
The top panel of Figure 12 once again shows systemic maser versus . The solid line demarcates the bowl bottom, and demonstrates in detail the coincidence in declination of the systemic masers and the bottom of the bowl. The parallel dotted line is intended to represent the approximate maser-layer thickness needed to accommodate all the systemic emission. It corresponds to a thickness of 15as. It is larger than the thickness inferred from a straightforward linear fit to the data (Figure 7) because the bowl bottom is not parallel to this best-fitting line. Figure 12 suggests that the declinations of the systemic masers require a masing layer of () at the bottom of the bowl. The bottom panel of Figure 12 shows radius as a function of for the three points identified in Figure 11. There is a gradient in the radius of the bowl bottom across the envelope of systemic emission. The inner and outer edges of the bowl (A and C) are located 0.77 and 1.23 times the bowl bottom radius for a maser layer thickness of 15as.
A second serious deficiency of the constant-inclination disk is an inconsistency between the extremely narrow declination scatter and relatively larger velocity spread of the systemic masers (Figure 9). Figure 12 shows that masers along the bowl bottom, and therefore confined to a narrow band of declination on the sky, can, in principle, reside over a large range of radii in the disk. Because the bowl model removes the proportionality between and characteristic of constant-inclination models, it also removes any inconsistency between the declinations and velocities of the systemic masers.
This conclusion is quantified in Figure 13, which shows actual systemic maser position-velocity data superposed on the predicted LOS velocity for the three annuli identified in Figure 11, assuming a maser layer thickness of 15as. The precise relationship between the model and depends on both the inclination and position angle warps. As in previous works (Herrnstein, Greenhill, & Moran 1996), we estimate the latter warp by assuming the high-velocity masers lie along the disk midline, and fitting a second order polynomial through their positions. Using the first four epochs of Table 1, we find the data are well fit by ( in mas), in good agreement with past estimates for the position angle warp.
If the systemic masers were positioned exactly along the bowl bottom, we would expect the data to lie along the line B in Figure 13. However, given the scatter in the systemic declinations and the bowl curvature determined from the high-velocity data, the systemic masers could in principle lie anywhere in the range of radii shown in Figure 12. Hence, the lines A and C show as a function of the envelope of LOS velocity that is consistent with the bowl model and the observed scatter in . Whereas the constant inclination disk is unable to handle the structure in the systemic – data, and in particular the structure between and mas (Figure 9), the bowl model has no trouble accommodating the observations.
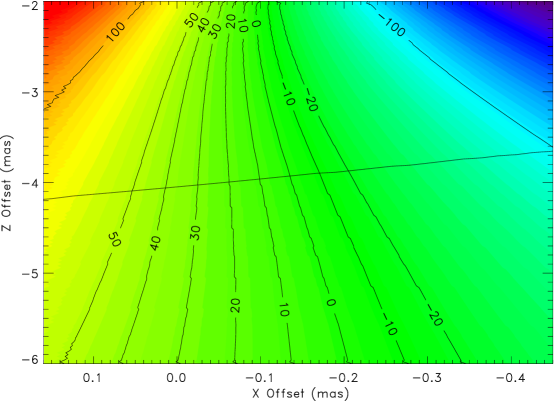
The model velocities in Figure 13 were generated using km s-1 and mas. The convergence point of the three velocity curves in the figure marks the point along the near edge of the disk where the LOS velocity gradient across the bowl bottom and along the line of sight reaches a minimum of km s-1. A noteworthy feature of the model is that the LOS velocity gradient across the bowl is a minimum for a velocity and a position that are km s-1 and mas to the red of the systemic velocity and projected near edge of the disk ( mas), respectively. This is also evident in Figure 14, which shows lines of constant LOS velocity in the bowl assuming mas. The iso-velocity lines are most nearly vertical for velocities km s-1 red of . In the next section we make an association between this velocity convergence point and the observed systemic flare.
4.3 The Inclination Warp: The Systemic Flare
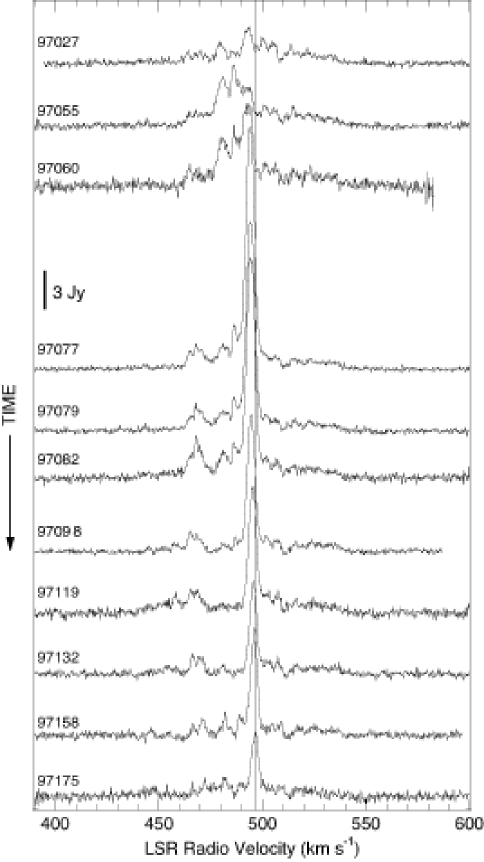
The 1996 systemic maser flare arose at a velocity of about 494 km s-1 (Bragg et al. 2000). Figure 15 shows the single-dish Haystack detection of a second flare in the NGC 4258 systemic spectrum. The flare was first unambiguously evident on day 77 of 1997, at which point it was near its maximum flux density of about 17 Jy. It returned to a more standard strength of Jy by day 175 of 1997. The implied lifetime of this flare is thus days, somewhat longer than the 75-day upper limit indicated by the Bragg et al. (2000) observations of the 1996 flare. The centroided velocity of the flare reddens from 494.1 to 496.4 km s-1 over the course of the observations, and is well-fit by a secular drift of km s-1 yr-1, which is consistent with previous detections of accelerations in the systemic masers (see Figure 16). Coincidentally, VLBA epochs BH25a, b, and c (Table 1) occurred near the maximum of the 1997 flare and detected a peak flux density of 17 Jy and flare velocities between 493.3 and 495.0 km s-1 (Figure 17).
Figure 18 shows spectra for both the 1996 and 1997 flares. The flare flux density maximums occur between 492.6 km s-1 (in 1996) and 494.6 km s-1 (at the end of the 1997 flare). The line profile of the 1996 flare was in fact not well-fit by a single feature. In a three-feature fit, the two features significantly brighter than standard systemic emission are centered about 488.4 km s-1 (14 Jy) and 492.6 km s-1 (20 Jy). The impressive agreement in the velocities of the two flares suggests that the NGC 4258 flare is actually a recurring event at a particular point in the disk. That is, flaring is observed when a suitable patch of enhanced density gas moves through a zone of optimum amplification. For mas and km s-1, Figure 13 shows that the flare position corresponds with the velocity convergence point of the disk 20 km s-1 and 0.1 mas to the red of disk center.
Hence, we propose that the NGC 4258 flare is recurring, and arises as a result of the bowl-like geometry along the front of the disk. At km s-1 the inclination and position angle warps conspire to bring the LOS velocity gradient along the LOS to km s-1 across the entire mas width of the bowl. We speculate that flares arise as a result of the serendipitous alignment and coherent self-amplification of masers along the bowl bottom at km s-1. The time scale between flares of about one year suggest that the characteristic length scale between gas density peaks is about cm. We note that Boboltz et al. (1998) have shown that a 1990 flare in the W49N water maser is well-modeled by the same type of chance alignment proposed here.
The inclination and position angle warps indicated by the positions and velocities of the high-velocity masers unambiguously predict a velocity convergence point along the near edge of the disk. However, the preferred and of the high-velocity fits do not lead to a precise coincidence between the velocity convergence point and the location of the flare. The final entry of Table 2, labeled , is the best-fitting inclination-warp model that also leads to center coordinates consistent with the flare. It is arrived at using the following iterative scheme. The high-velocity fitting is first performed with no constraints on or , yielding the solution . The velocity convergence point, which depends on the precise shape of the warp, the central mass, and the disk center coordinates, is computed for this model. and , the disk center coordinates that locate the flare at the velocity convergence point while holding all other model parameters fixed, are estimated, and the high-velocity fit is rerun around and priors. The sequence is repeated with increasingly narrow prior distributions about and until convergence is achieved. In this case, convergence indicates the existence of an and for which the best-fitting central mass and warp model (as determined from the high-velocity masers) also leads to an alignment between the velocity convergence point and the flare.
Table 2 shows that there is a discrepancy between the unconstrained high-velocity fit and the flare-constrained fit. There is also a significant degradation in the reduced of the flare-constrained fit. Past efforts at global disk fitting have uncovered comparable inconsistencies between the systemic and high velocity masers, and this is summarized in Figure 19. The diamonds denote the maximum-likelihood centers for fits considering only the high-velocity masers. The squares mark the center values for fits incorporating both the systemic and high-velocity masers. The open and filled symbols represent position-angle warp and inclination- and position-angle warp models, respectively. The open square is derived from true global fit incorporating all masers, while the filled square corresponds to the solution discussed above, and utilizes the high-velocity masers and the location of the flare. The discrepancy between the open diamond and open squares illustrates the tension between the high-velocity and systemic masers in the context of a position-angle warp. The solid symbols indicate that by including an inclination warp and locating the flare at the velocity convergence point of the disk, we have significantly reduced, but not removed this tension.
4.4 Discussion
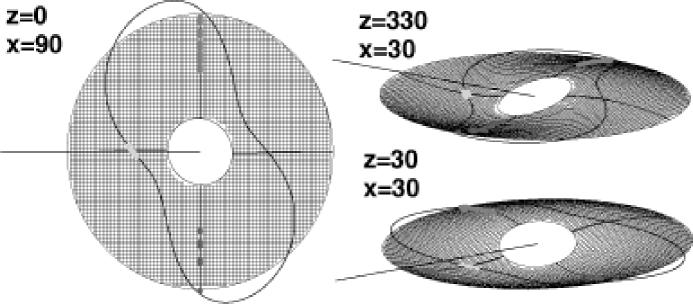
In this section we have attempted to demonstrate that the inclination warp derived from the projected high-velocity rotation curve naturally explains a number of otherwise puzzling features of the systemic masers. In particular, we have shown that the bowl geometry provides an explanation for the extremely tight declination spread, and broader velocity spread of the systemic masers. Furthermore, we have argued that the combination of central X-ray heating, background amplification, and thermal absorption makes the bowl bottom an especially attractive location for the systemic masers to arise. Finally, we have speculated that the apparently recurring flare in NGC 4258 arises at the point in the bowl where the velocity gradient along the LOS approaches zero. Based on these results, we conclude that mas-1 and that the inclination warp is in fact predominantly responsible for the flattened high-velocity projected rotation curve. Figure 20 shows three perspectives of this disk. The disk midline and the and radials are overlaid. The peanut-shaped curve traces the location of the disk tangent, as seen from our perspective. As prescribed by the model, the systemic masers have been distributed along the disk tangent at the near edge of the disk, while the high velocity masers have been placed along the midline.
5 Implications
5.1 The Rotation Curve Revisited
Of the three specific refinements to a constant-inclination, centrally bound disk considered in Section 3.2, it was the inclination warp alone that was capable of steepening the rotation curve and that prevented us from placing interesting limits on , , and . The dotted curves in Figure 4 show , , and for a disk with mas-1. Figure 5 also shows the probability distribution for in the presence of an inclination warp. The maximum-likelihood rotation law for a inclination-warped disk is , and there is no significant evidence for deviation from pure-Keplerian rotation. The asymptotic behavior of the relative and further reinforces the conclusion that the inclination warp alone fits the projected high-velocity rotation curve. For mas-1, we find that M⊙ pc-3 and M⊙ yr-1.
Maoz (1998) has developed a formalism for estimating cluster lifetime upper limits () by considering both collision and evaporation timescales for a variety of cluster constituents. For NGC 4258, he finds Gyr for M⊙ pc-3. Hence, the lower limit on derived from the high-velocity rotation curve indicates that if the disk is bound by a central cluster, the cluster lifetime would have to be considerably shorter than the age of the galaxy itself. This strongly favors the presence of a supermassive black hole in NGC 4258. The upper limit on is less interesting since it is three times larger than what would be expected for advection-dominated accretion flow models (ADAF; Gammie, Narayan, & Blanford 1999), which are generally the least efficient, highest solutions.
5.2 The Disk Geometry Revisited
For a disk with no position angle warp, the narrow spread in the declinations of the systemic masers implies that these features are tightly clustered about a radius of 0.14 pc (3.9 mas). A number of theories have been proposed to explain the inner cutoff in the systemic emission. Neufeld & Maloney (1995) suggest that the inner edge of systemic emission might be due to a flattening of the disk and a resulting decrease in the X-ray heating inside of this radius. More recently Yuan et al. (2002) have fit the NGC 4258 SED with a jet-dominated AGN model in which the outer thin disk transitions to an ADAF at a radius . The NGC 4258 SED alone does not place tight constraints on , and it is tempting to associate with the inner edge of systemic emission. However, if the inclination warp model is correct then the systemic masers are clustered along the bottom of a bowl along the near edge of the disk, and there is no additional explanation needed for their narrow spread in . In this model, there is nothing distinctive about 0.14 pc except that from our perspective it corresponds to a tangent point to the disk.
Similarly, efforts have been made to explain the observed range of high-velocity emission from 0.16 to 0.28 pc (4.5–8.1 mas) on either side of the central mass. Most notably, Neufeld & Maloney (1995) argue that the outer edge of high-velocity emission is due to a transition from a molecular to an atomic disk at this radius. We discuss this in detail in the next section. To date there is no compelling explanation for the inner edge of high-velocity emission. Here we speculate that the same amplification and absorption considerations that make the bowl model attractive as an explanation for the systemic geometry play a role in the inner cutoff for the high-velocity emission. Figure 21 shows the disk cross section in the plane of the sky. The vertical dashes mark the observed extent of high-velocity emission. Water molecules inside of a certain radius will have an unabsorbed view of the background jet emission and, according to the arguments of Section 4.2, will generate strong maser emission perpendicular to our LOS (i.e., “their” systemic emission). If these masers are at least mildly saturated, as appears to be the case for ’our’ systemic masers (e.g. Modjaz et al. 2005), then competitive gain arguments would suggest a corresponding quenching of any high-velocity emission along our LOS from within this radius. The precise radius at which the background jets come into view depends on the orientation and extent of the jets. But from Figure 21, which shows the observed extent of continuum emission, it seems plausible that there is indeed a connection between the purported location of ’their’ systemic emission and ’our’ high-velocity emission.
5.3 X-ray Obscuration and the Accretion Rate
For mas-1, the accretion disk traced by the masers rises in front of and obscures the central engine at a disk radius, , of 8.3 mas or 0.29 pc (see Figure 10), where and is the inclination at . The formal fractional uncertainty in this radius is about 30% and is dominated by the uncertainty in . However, for a disk in which the systemic masers lie along a tangent to the disk, can be written in terms of and instead of and as , where and are the radius and inclination ( for edge-on) of the systemic masers. In other words, if we assume that the systemic masers are clustered around the bottom of a bowl along the near edge of the disk, then the X-ray obscuration radius is independent of and depends only on other relatively well-constrained parameters of the model. We estimate that in the context of the bowl model, is known to a fractional uncertainty of about 5%.
From Equation 12, the shielding column density through a Shakura-Sunyaev isothermal accretion disk is
| (17) |
Here, is the shielding column in units of cm-2, , , is the disk radius in pc, and km s-1 is the isothermal sound speed. The column is computed for an obliquity angle with respect to the disk normal () and assuming solar abundances. From the bowl model the obliquity angle is 74 degrees and . Neufeld & Maloney (1995) showed that as a result of the warp in the NGC 4258 disk, heating from direct exposure to central X-rays dominates viscous heating in the outer disk, and this must be taken into consideration in evaluating Equation 17. More precisely, they showed that for an externally heated Shakura-Sunyaev disk, the midplane pressure scales as . As a result there exists a critical radius, , beyond which the disk is atomic throughout:
| (18) |
where is the 2–10 keV X-ray luminosity in units of erg s-1. Numerical simulations by Neufeld, Maloney, & Conger (1994) indicate that the temperature in the predominantly atomic disk beyond rapidly reaches an asymptotic value of about 8000 K, corresponding to . Their models also indicate that within , the temperature of the dwindling surface atomic layer ranges from about 5000 to 8000 K degrees depending on depth and proximity to , while the midlplane molecular layer temperature ranges from about 400–1000 K.
Equations 17 and 18 can be used to estimate the X-ray shielding column at as a function of . For each accretion rate, Equation 18 is first used to calculate along the radial for , (Fruscione et al. 2005), and mas-1. If for a given , , then the disk is entirely atomic at and is computed from Equation 17 using the asymptotic sound speed of 7 km s-1 and . If on the other hand , then the X-rays must also transit cooler molecular gas in the disk midplane.
Figure 22 shows at mas. The abrupt jump in at M⊙ yr-1 marks the accretion rate at which passes outside of and the disk column becomes increasingly dominated by cool, dense molecular gas in the disk midplane. We have made no effort to model the transition from predominantly molecular to predominantly atomic gas. However, we note in passing that the actual transition is likely to be extremely rapid as a result of the strong radial dependence () of the disk midplane pressure. Furthermore, Figure 22 is based on the assumption that inside of , all the disk mass is molecular. While a surface layer of atomic gas will in fact persist inside the critical radius, it is reasonable to approximate that the column will rapidly become doiminated by the dense midplane molecular gas.
The X-ray column has been observed and estimated numerous times since 1993 (see Table 2 of Fruscione et al. 2005 for a summary), and the dotted lines in the figure show the range of observed values. Standard AGN models suggest that this column is due to a thick dusty torus 1 to 10 pc from the central engine. With this in mind, we treat the observed column as an upper limit on the column through the sub-parsec disk. For the disk column is times greater than the largest observed column. Hence, for mas-1, consistency with the observed X-ray column requires that the disk be atomic at the obscuring radius of 8.3 mas (0.29 pc), translating to an upper limit on the accretion rate of M⊙ yr-1 for and . As discussed above, these conclusions are robust to uncertainties in if the systemic masers are indeed distributed about the tangent to the disk. The upper limit on assumes a disk filling factor of order unity at . The unbroken nature of the systemic spectrum suggests this is a reasonable approximation at mas. Furthermore, the relative stability (to factors of a few; Fruscione et al. (2005)) of the observed column over the last ten years implies a fairly smooth intervening medium. Finally, our analysis implicitly treats the central X-ray emission as arising from a point source. Observed X-ray variability on timescales of hours (Fiore et al. 2001) implies an X-ray source of less than 100 rg corresponding to an angular size of at the distance of the innermost maser. Thus, these conclusions should not be sensitive to spatial structure in the central X-ray source.
Neufeld & Maloney (1995) estimate the accretion rate through the NGC 4258 outer disk by postulating that it is the transition from a molecular to an atomic disk at that defines the radius, , of the outermost high-velocity maser. Using Equation 18 and setting mas they find M⊙ yr-1. A more conservative approach is to require merely that the disk be molecular over the entire range of maser emission, leading to a lower limit on the accretion rate. Figure 23 shows along the midline for the position angle warp discussed in the previous section. In order to accommodate both the manifest existence of maser emission at and the observed X-ray column at , the transition from molecular to atomic gas must occur outside of 8.1 mas (0.28 pc) along the disk midline and inside of 8.3 mas (0.29 pc) along the LOS. For and , this implies accretion rate upper and lower limits of M⊙ yr-1. Given the central mass of M⊙, this translates to an accretion rate in Eddington units of , assuming a canonical efficiency of 0.1. For erg s-1, we estimate a radiative efficiency of for .
The conclusion that the disk transitions from molecular to atomic gas between and is robust in the sense that a predominantly molecular disk would lead to substantially more column than observed and an atomic disk could not support masers. Furthermore, our estimate that the transition occurs at mas pc is relatively insensitive to details of the fitting process as long as it is indeed the case that the systemic masers lie along the bottom of a bowl and the high-velocity masers trace a position angle warp. The accretion rate estimate, on the other hand, is sensitive to estimates for the X-ray luminosity and column (both known to be variable by factors of a few; Fruscione et al. 2005), the disk sound speed, and, more generally, to the applicability of the equations for an externally heated thin disk to the outer NGC 4258 disk. With this in mind, we refrain from placing formal errors on the accretion rate.
The preceding analysis validates the proposal of Neufeld & Maloney (1995) that the high-velocity emission is truncated at large radii by a transition from molecular to atomic gas. In addition, it suggests that a substantial fraction, if not all, of the observed X-ray column is due to the warped disk at 0.29 pc (Figure 22). The standard model of low-luminosity AGN (Antonucci & Miller 1985) asserts that Seyfert 1s and 2s are the same class of object observed from different perspectives. More recent work suggests that HBLR and non-HBLR Seyfert 2s may in fact be distinct classes of objects, with the HBLR Seyfert 2s being the misaligned counterparts to the face-on Seyfert 1s (c.f. Veilleux 2003). While it is generally accepted that at least some Seyfert 2s are Seyfert 1s shrouded in intervening gas, the precise nature of the absorbing material is still debated. Broad emission-line region clouds, sub-parsec-scale warped disks, 1–10 pc thick molecular tori, and larger-scale wind structures have all been considered. Recent studies of column variability in Seyfert 2 galaxies suggest intervening material quite close to the central engine (Risaliti, Elvis, & Nicastro 2002). NGC 4258 is just one object, and as such generalizations cannot be drawn from it. Nevertheless, our analysis, together with the X-ray observations of Fruscione et al. (2005), presents compelling evidence for at least one HBLR Seyfert 2 in which most, if not all, of the X-ray obscuration arises in a subparsec-scale warped disk.
If the X-ray column indeed arises in the disk, then the expected timescale, , for variability in the X-ray column is , where we have associated the disk thickness with the characteristic scale of the intervening material. For an isothermal disk, , and . For the NGC 4258 disk at 0.29 pc, km s-1 and, taking km s-1, we estimate yrs. The observed column variability of over months (Fruscione et al. 2005) is approximately consistent with this prediction, but may indicate inhomogeneities on a scale somewhat less than the disk thickness.
The existence of water masers requires K and cm-3 in the NGC 4258 disk, where and are the temperature and density of the masing gas. This temperature is consistent with the models of Neufeld et al. (1994) for an externally irradiated thin disk. The density of the maser layer is estimated by assuming that the masers lie approximately at the midplane of the disk. From Equation 12 the midplane number density, can be written
| (19) |
For M⊙ yr-1 and km s-1( K), ranges from cm-3 at the inner radius of 0.14 pc to cm-3 at 0.28 pc, the radius of the outermost high-velocity feature. Hence, the accretion rate derived from the disk geometry and X-ray column provides conditions suitable for water masers in the disk midplane over the entire envelope of observed maser emission.
The same disk material that obscures the central X-ray emission will also obscure any radio emission arising in the central engine. Herrnstein et al. (1998) report a 220 Jy upper limit on 22 GHz emission coincident with the central mass, and this limit has been used to place constraints on the accretion mode and rate through the disk (Herrnstein et al. 1998; Gammie, Narayan, & Blandford 1999; Yuan et al. 2002). The 22-GHz optical depth due to free-free absorption in the disk at will be 1–2 (Herrnstein, Greenhill, & Moran 1996), and hence we speculate that the actual upper limit on central-engine 22 GHz is likely 1–2 times larger than the observed 220 Jy.
Finally, we note that any association between the accretion rate in the maser disk and that in the NGC 4258 central engine implicitly assumes that mass loss via winds can be ingored and that the disk is in a steady state, such that . Gammie et al. (1999) argue that in the absence of external torques, steady state is achieved after a viscous timescale given approximately by Gyr. For K and , Gyr at the radii of the masers.
5.4 The NGC 4258 Central Engine
Ho (2003) lists the defining properties of Low luminosity AGN. LLAGN are highly sub-Eddington, and their spectral energy distributions (SEDs) lack the ’big blue bump’ of more powerful AGN. Instead they typically show an excess of IR emission, perhaps even peaking in this region of the spectrum. They tend to be relatively strong radio emitters, and they possess narrow rather than relativistically broadened iron k emission. NGC 4258 satisfies all of these criteria, especially if we accept that the steep () optical/UV spectrum of Wilkes et al. (1995) is in fact an extension of the steep () IR spectrum of Chary et al. (2000), and that the SED therefore peaks in the IR.
The generic LLAGN SED as described above shows indications that at least three distinct emission mechanisms may be at work. First, the IR excess (as well as numerous examples of double-peaked emission lines; Ho et al. 2000) is consistent with black body emission from a standard optically thick, geometrically thin, radiatively efficient Shakura-Sunyaev disk. However, the absence of an optical/UV peak and of relativistically broadened k lines indicates this disk does not extend too close to the black hole. Next, the representative LLAGN SED seems broadly consistent with emission from a class of hot, quasi-spherical, inefficient accretion flows, known collectively as radiatively inefficient accretion flows (RIAFs; see Quaetert 2003 for a recent summary). Accretion of this type naturally explains the low bolometric luminosities and inferred low accretion efficiencies of LLAGN. Finally, the characteristic radio excess is most readily explained by compact jet emission at the central engine (Falcke & Biermann 1995, 1999; Anderson et al. 2004).
Hence, a plausible model for the LLAGN central engine (c.f. Ho 2003; Qataert 2003) has an outer thin accretion disk truncated at rg by a hot, inefficient RIAF, which in turn channels some fraction of the accreted energy into a compact jet. While it is perhaps uncontrovertial that one or all of these mechanisms play a role in most LLAGN central engines, the neat itemization of the previous paragraph is probably misleading. The RIAF models can be enhanced to accommodate the radio excess, the compact jet models can be extended to accommodate essentially the entire SED, and the thin disk can be left out altogether.
Several attempts have been made to model the NGC 4258 spectrum. Gammie et al. (1999) propose an accretion rate of M⊙ yr-1 through an advection dominated accretion flow (ADAF) that transitions to a thin disk at rg. The model relies on relatively high accretion rates through an outer thin disk to explain the observed IR luminosity and the extreme inefficiency of the central ADAF to accommodate the significant sub-Eddington luminosity of the system. However, this model appears to be inconsistent with the subsequent detection of a steep () IR spectrum by Chary et al. (2000). Yuan et al. (2002), on the other hand, propose that essentially the entire NGC 4258 LLAGN spectrum arises in a compact jet. They demonstrate broad agreement with the observed SED, and in particluar the steep IR spectrum, for jet mass loss rates between and M⊙ yr-1. They speculate that disk accretion rates of M⊙ yr-1 are needed to feed the jets, and show that for such low accretion rates, an outer thin disk and central ADAF contribute negligably to the jet sprectrum. In this jet-dominated model, the radiatively inefficient ADAF serves primarily as a means to channel large amounts of accretion energy to the radiatively efficient jets. Our estimate for the NGC 4258 accretion rate is in reasonable agreement with the jet-dominated models of Yuan et al. (2002). In NGC 4258 we know that all the detected 22 GHz emission arises in compact jets and apparently not in a central RIAF. Furthermore, we appear to be able to place relatively tight constraints on the accretion rate at 0.28 pc, and this may aid in untangling the relative contributions of jet and RIAF.
6 Conclusions
In this paper, we have proposed a geometry for the sub-parsec disk in NGC 4258 based primarily on its ability to explain a large number of oherwise puzzling features of the system. In particular, an inclination warp explains:
-
•
The sub-Keplerian projected rotation curve of the high-velocity masers and implies a purely Keplerian underlying disk.
-
•
The narrow declination spread of the systemic masers, and their apparent tight clustering around a radius of mas, corresponding to the bottom of a bowl along the near edge of the disk.
-
•
An apparently recurring flare in the systemic masers km s-1 red of the systemic velocity of the galaxy.
-
•
In conjunction with observed X-ray column, the outer cutoff of high-velocity emission.
-
•
By analogy with amplification and obscuration arguments for the systemic masers, the inner cutoff of the high-velocity emission.
While the model is compelling in its ability to explain a variety of aspects of the system, we have not demonstrated that it is the best model in the formal maximum likelihood sense. In particular, we have shown that there remains a tension between the disk center predicted purely from the high-velocity masers, and the center derived from the high-velocity masers and the flare location. The resolution of this tension requires global fits, perhaps incorporating additional details not considered here (such as non-circular orbits).
Finally, the inclination-warp model makes several predictions, most obviously that systemic maser emission cannot arise significantly further south of disk center than 0.55 mas, and that all high-velocity emission must occur within mas. This has held true up to this point, and will be easily verifiable in upcoming datasets. In addition, it predicts that future flares should occur km s-1 to the red of the systemic velocity. If it is indeed the case that the inner edge of high-velocity emission is due to competitive gain with stronger, amplified emission in the plane of the sky, then this is not a hard edge like the outer cutoff. To the extent that the systemic spectrum is variable and occassionally weak at certain velocities, we might expect to see faint high-velocity emission inside of the ususal pc inner cutoff. Finally, we point out that in this model there is no a priori reason that the systemic masers must lie along the bowl bottom. Rather, this is where such emission will be brightest. We speculate that there could be additional much weaker low-velocity emission displaced from the bowl bottom. The most likely place to find such emission would be km s-1 to the red of the systemic velocity, where the velocity gradient along the LOS is smallest.
References
- Anderson et al. (2004) Anderson, J. M., Ulvestad, J. S., & Ho, L. C. 2004, ApJ, 603, 42
- Antonucci & Miller (1985) Antonucci, R., & Miller, J. S. 1985, Ap. J., 297, 621
- Blanford & Konigl (1979) Blanford, R. D. & Konigl, A. 1979, ApJ, 232, 34
- Boboltz et al. (1998) Boboltz, D. A., Simonetti, J. H., Dennison, B., Diamond, P. J., & Uphoff, J. A. 1998, ApJ, 509, 256
- Bragg et al. (2000) Bragg, A. E., Greenhill, L. J., Moran, J. M., & Henkel, C. 2000, ApJ, 535, 73
- Chary & Becklin (1998) Chary, R. & Becklin, E. E. 1997, Ap. J., 485, L75
- Chary et al. (2000) Chary, R., Becklin, E. E., Evans, A. S., Neugebauer, G., Scoville, N. Z., Matthews, K., & Ressler, M. E. 2000, ApJ, 531, 756
- Cecil et al. (1995) Cecil, G., Wilson, A. S., & DePree, C. 1995, Ap. J., 440, 181
- Cecil et al. (1992) Cecil, G., Wilson, A. S., & Tully, R. B. 1992, ApJ, 390, 365
- Claussen & Lo (1986) Claussen, M. J. & Lo, K.-Y. 1986, Ap. J., 308, 592
- Claussen et al. (1984) Claussen, M. J., Heiligman, G. M., & Lo, K. Y. 1984, Nature, 310, 298
- Falcke & Biermann (1995) Falcke, H. & Biermann, P. L. 1995, A&A, 293, 665
- Falcke & Biermann (1999) Falcke, H. & Biermann, P. L. 1999, A&A, 342, 49
- Fiore et al. (2001) Fiore, F. et al.. 2001, ApJ, 556, 150
- Ford et al. (1986) Ford, H. C., Dahari, O., Jacoby, G. H., Crane, P. C., & Ciardullo, R. 1986, ApJ, 311, 7
- Frank et al. (2002) Frank, J., King, A., & Raine, D. 2002, Accretion Power in Astrophysics, 3nd ed., Cambridge University Press
- Fruscione et al. (2005) Fruscione, A., Greenhill, L. J., Filippenko, a. V., Moran, J. M., Herrnstein, J. R., & Galle, E. 2005, submitted to ApJ
- Gammie, Narayan, & Blanford (1999) Gammie, C. F., Narayan, R., & Blandford, R. 1999, Ap. J., 516, 177
- (19) Greenhill, L. G., Jiang, R. D., Moran, J. M., Reid, M. J., Lo, K. Y., & Claussen, M. J. 1995a, ApJ, 440, 619
- (20) Greenhill, L. J., Henkel, C., Becker, R., Wilson, T. L., & Wouterloot, J. G. A. 1995b, A&A, 304, 21
- Haschick et al. (1994) Haschick, A.D., Baan, W. A., & Peng, E.W. 1994, Ap. J., 437, L35
- Herrnstein (1997) Herrnstein, J. R., PhD Dissertation, Harvard University, 1997
- Herrnstein et al. (1996) Herrnstein, J. R., Greenhill, L. J., & Moran, J. M. 1996, ApJ, 468, L17
- Herrnstein et al. (1998) Herrnstein, J. R., Greenhill, L. J., Moran, J. M., Diamond, P. J., Inoue, M., Nakai, N., & Miyoshi, M. 1998a, ApJ, 497, L69
- Herrnstein et al. (1998) Herrnstein, J. R., Moran, J. M., Greenhill, L. J., Diamond, P. J., Inoue, M., Nakai, N., Miyoshi, M., Henkel, C., & Riess, A. 1998b, Nature, 400, 539
- Herrnstein et al. (1997) Herrnstein, J. R. , Moran, J. M., Greenhill, L. J., Diamond, P. J., Miyoshi, M., Nakai, N., & Inoue, M. 1997, ApJ, 475, L17
- Ho (2003) Ho, L. C. 2003, in ASP Conf. Ser. 290: Active Galactic Nuclei: From Central Engine to Host Galaxy, ed. S. Collin, F. combes, & I. Shlosman, 379
- Ho et al. (2000) Ho, L. C., Rudnick, G., Rix, H., Shields, J. C., McIntosh, D. H., Filippenko, A. V., Sargent, W. L. W., & Eracleous, M. 2000, ApJ, 541, 120
- Martin (1989) Martin, P., Roy, J., Noreau, L., & Lo, K.-Y. 1989, Ap. J., 345, 707.
- Maoz (1995) Maoz, E., 1995, Ap. J., 447, L91
- Maoz (1998) Maoz, E., 1998, Ap. J., 494, L181
- Miyoshi et al. (1995) Miyoshi, M., Moran, J. M., Herrnstein, J. R., Greenhill, L. J., Nakai, N., Diamond, P. J., & Inoue, M. 1995, Nature, 373, 127
- Modjaz et al. (2005) Modjaz, M., Moran, J. M., Kondratko, P., & Greenhill, L. J. submitted to ApJ
- Moran et al. (1995) Moran, J. M., Greenhill, L. J., Herrnstein, J. R., Diamond, P. J., Miyoshi, M., Nakai, N., & Inoue, M. 1995, Proc. Natl. Acad. Sci. USA, 92, 11427
- Nakai et al. (1993) Nakai, N., Inoue, M., & Miyoshi, M. 1993, Nature, 361, 45
- Neufeld & Maloney (1995) Neufeld, D. A. & Maloney, P. R. 1995, ApJ, 447, L17
- Neufeld et al. (1994) Neufeld, D. A., Maloney, P. R., and Conger, S. 1994, Ap. J., 436, L127
- Quataert (2003) Quataert, E. 2003, in Proc. Galactic Center Workshop 2002: The Central 300 Parsecs of the Milky Way, ed. A. Cotera, H. Falcke, T. R. Geballe, & S. Markoff (Astron. Nachr. 324[S1]; Weinheim: Wiley-VCH), 435
- Risaliti, Elvis, & Nicastro (2002) Risaliti, G, Elvis, M., & Nicastro, F. 2002, ApJ, 571, 234
- Seyfert (1943) Seyfert, C. 1943, Ap. J., 97, 28
- (41) Shakura, N. I. & Sunyaev, R. A. 1973, A&A, 24, 337
- van der Kruit et al. (1972) van der Kruit, P. C., Oort, J. H., & Mathewson, D. S. 1972, A&A, 21, 169
- Veilleux (2003) Veilleux, S. 2003, in ASP Conf. Ser. 290: Active Galactic Nuclei: From Central Engine to Host Galaxy, ed. S. Collin, F. combes, & I. Shlosman, 11
- Watson & Wallin (1994) Watson, W. D. & Wallin, B. K. 1994, ApJ, 432, L35
- Wilkes et al. (1995) Wilkes, B. J., Schmidt, G. D., Smith, P. S., Mathur, S., & McLeod, K. K. 1995, ApJ, 455, L13
- Yuan, Markoff, & Falcke (2002) Yuan, F., Markoff, S., & Falcke, H. 2002, A&A, 383, 854
- Yuan, Markoff, & Falcke (2003) Yuan, F., Markoff, S., & Falcke, H. 2003, in Proc. Galactic Center Workshop 2002: The Central 300 Parsecs of the Milky Way, ed. A. Cotera, H. Falcke, T. R. Geballe, & S. Markoff (Astron. Nachr. 324[S1]; Weinheim: Wiley-VCH), 453
- Yuan et al. (2002) Yuan, F., Markoff, S., Falcke, H., & Biermann, P. L. 2002, A&A, 391, 139
- Yuan, Quataert, & Narayan (2003) Yuan, F., Quataert, E., & Narayan, R. 2003, ApJ, 598, 301
| Experiment | Observation | Antennas(1) | Frequency | Synthesized | Sensitivity(4) |
|---|---|---|---|---|---|
| Code | Date | Setup(2) | Beam(3) | ||
| BM19 | 19940426 | V+Y | L | 1.1x0.6 @ | 6.0 |
| BM36a | 19950108 | V+Y | L | 0.8x0.7 @ | 6.5 |
| BM36b | 19950529 | V+Y | L | 1.0x0.7 @ | 5.2 |
| BM56b | 19960921 | V+Y+G+E | L | 1.3x1.1 @ | 3.0 |
| BH25a | 19970307 | V+Y+G+E | C | 0.7x0.3 @ | 3.0 |
| BH25b | 19970323 | V+Y+G+E | C | 0.6x0.3 @ | 2.3 |
| BH25c | 19970407 | V+Y+G+E | C | 0.6x0.3 @ | 2.6 |
| Model | Relativity? | aaOffset with respect to reference maser at 510 km s-1 LSR. | Parameter Value | bbMaximum deviation from Keplerian rotation between innermost and outermost masers, positive representing a flattening in the projected rotation curve. | |||
| (mas) | (km s-1) | ( M⊙) | (km s-1) | ||||
| Keplerian | No | 1.24 | … | … | |||
| Keplerian | Yes | 1.24 | … | … | |||
| Power Law | Yes | 1.09 | cc () | 9.0 | |||
| Central Cluster | Yes | 1.07 | dd ( pc-3) | 10.9 | |||
| Massive Disk | Yes | 1.10 | ee (M⊙ yr-1) | 10.1 | |||
| Inclination Warp | Yes | 1.08 | ff (mas-1) | 9.6 | |||
| Inclination Warpgg bootstrapped global model | Yes | –0.191 | 473.5 | 3.794 | 1.19 | 0.034ff (mas-1) | 9.64 |
| Model | Relativity? | aaOffset with respect to reference maser at 510 km s-1 LSR. | Parameter Value | bbMaximum deviation from Keplerian rotation between innermost and outermost masers, positive representing a flattening in the projected rotation curve. | |||
|---|---|---|---|---|---|---|---|
| (mas) | (km s-1) | ( M⊙) | (km s-1) | ||||
| Keplerian | No | 1.24 | … | … | |||
| Keplerian | Yes | 1.24 | … | … | |||
| Power Law | Yes | 1.09 | cc () | 9.0 | |||
| Central Cluster | Yes | 1.07 | dd ( pc-3) | 10.9 | |||
| Massive Disk | Yes | 1.10 | ee (M⊙ yr-1) | 10.1 | |||
| Inclination Warp | Yes | 1.08 | ff (mas-1) | 9.6 | |||
| Inclination Warpgg bootstrapped global model | Yes | –0.191 | 473.5 | 3.794 | 1.19 | 0.034ff (mas-1) | 9.64 |