INTEGRAL & RXTE Power Spectra of Cygnus X-1
Abstract
We evaluate 0.03–20 Hz power spectra of the bright black hole binary Cyg X-1 obtained from non-deconvolved INTEGRAL-ISGRI event data. The ISGRI power spectra are compared to contemporary RXTE-PCA ones in the same hard X-ray energy band of 15–70 keV. They agree well in shape. Since the ISGRI power spectrum of Cyg X-1 is not background corrected it lies about an order of magnitude below the PCA values. In 2003 a soft outburst of Cyg X-1 occurred. From the RXTE-ASM and Ryle radio long term lightcurves and the RXTE spectra we see a canonical “hard state – intermediate state – soft state” evolution. We discuss the evolution of the power spectra in the 15–70 keV range which so far is much less well studied than that at softer energies. We interpret our results regarding the origin of certain variability components.
keywords:
black hole physics , stars: individual: Cyg X-1 , X-rays: binaries, , , , , and
1 Introduction & Data Extraction
Timing studies of black hole binaries allow for a very precise state classification and are essential for understanding the accretion process in these objects (Kalemci et al., 2004; Pottschmidt et al., 2003). In this work we analyze continuum power spectra derived from the Soft Gamma-Ray Imager (ISGRI; Lebrun et al., 2003) on-board ESA’s International Gamma-Ray Astrophysics Laboratory (INTEGRAL; Winkler et al., 2003), i.e., of the upper layer of the coded mask imager IBIS. By comparing contemporaneous RXTE-PCA and INTEGRAL-ISGRI data of the bright black hole binary Cyg X-1 in the 15–70 keV energy range we show for the first time that ISGRI can be used to extend black hole timing studies to the much less well known regime above 20 keV, where the emission is dominated by the strongly variable corona/jet system. In the following we consider all Galactic plane scan (GPS) observations of INTEGRAL up to 2004 April during which Cyg X-1 was in the fully coded field of view of ISGRI (offset). Pointed RXTE-PCA observations from our 14-daily monitoring program closest in time were chosen for comparison. They are placed into context of the long term radio and soft X-ray evolution in Fig. 1: two soft X-ray flaring episodes occurred, displaying the typical radio quenching associated with black hole soft states. An analysis of the X-ray spectra confirms this picture (Wilms et al., 2005).

The ISGRI analysis is based on detector events extracted with the “off-line scientific analysis” software111A version comparable to OSA-4.0 was used. OSA-4.1 qualitatively produces the same results. and its event extractor tool “evts_extract”. A selection on “pixel illumination fraction” (PIF), i.e., on source direction, and on energy was performed. Varying the PIF range does not significantly change the results for this bright source (adopted here: PIF0.8). Power spectra were calculated following the procedure described by Pottschmidt et al. (2003). Each ISGRI power spectrum corresponds to an exposure of typically 1–2 ks, the PCA power spectra include 1–6 ks.
2 Comparison of ISGRI & PCA Power Spectra
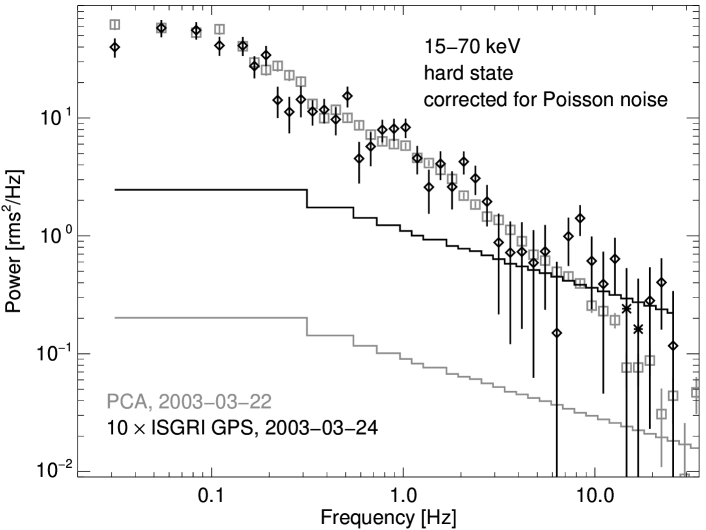
Comparing typical PCA (2003–03–22) and ISGRI (2003–03–24) hard state 15–70 keV power spectra, we find that they agree well in shape up to 5 Hz where the ISGRI power spectrum becomes noise dominated (Fig.2). However, the variability measured with ISGRI lies about an order of magnitude too low. This can mainly be attributed to the much higher ISGRI background and can in principle be corrected. Note that the normalization of the power spectrum scales as , where is the source count rate and the background count rate. Part of the offset might also be due to an energy dependent source rms and the different responses of the two instruments within the selected band (the photon number weighted characteristic photon energy of Cyg X-1 in ISGRI and the PCA is 34–38 keV and 23–24 keV, respectively). We also note here that data from INTEGRAL’s performance verification (PV) phase are generally more difficult to use for this kind of timing analysis: first, they suffer from many gaps due to telemetry saturation which have to be taken into account carefully, second, a rise-time event selection has to be performed for all data obtained before 2003–02–09 (after this date the selection has been performed on-board). The corrected early power spectra agree reasonably well with the PCA data, however, they are still noisier than later ISGRI data (possible reasons: buffer saturation, treatment of noisy pixels, ). The long Cyg X-1 PV phase observations are thus less well suited for high resolution timing analyses.
3 Evolution Over the Flare
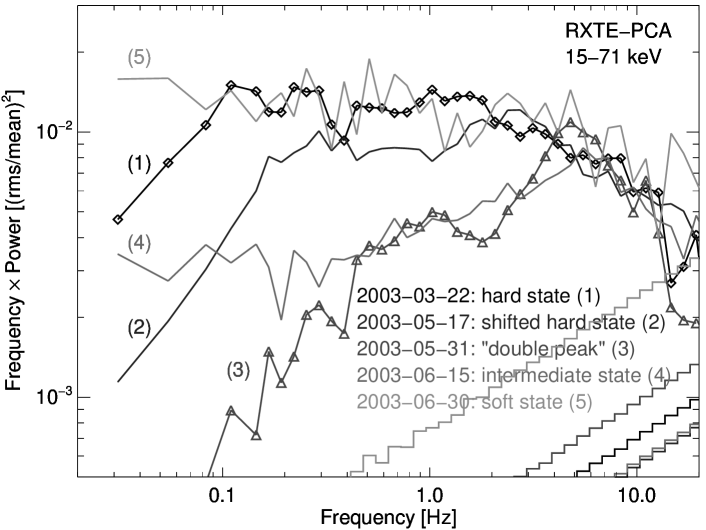
The rise of the outburst in 2003 is regularly sampled by INTEGRAL and RXTE observations. We concentrate on these observations, pointing out that also the remaining ones behave as expected from Fig. 1. Black hole binary timing behavior is usually characterized in the soft X-ray band: for the 2003 flare rise we find that the keV PCA power spectra display a characteristic state transition sequence which is fully consistent with the spectral evolution. A similar sequence of power spectra has been observed several times during our 1998–2004 RXTE monitoring campaign (see, e.g. Pottschmidt et al., 2003). In the 15–70 keV range the changes of the power spectrum follow a similar pattern (Fig. 3): Starting from the hard state which can be described by several broad Lorentzian shaped components, first the whole shape is shifted toward higher frequencies. A characteristic double peak appears, developing into the intermediate state dominated by only one Lorentzian (associated with enhanced time lags and radio flaring, Pottschmidt et al., 2003). Finally the less structured soft state is reached (power law dominated towards low frequencies). But there is an important difference to the soft band which to our knowledge has never been reported before: The “double peak” power spectrum is much more asymmetric at higher energies, further supporting that the stronger “enhanced time lag peak” around 4 Hz in the power spectrum is associated with the hard spectral component and thus possibly the jet forming region. Also, at these energies the rms contribution during the soft state is comparable to that in the hard state, confirming that the variability is primarily due to the hard spectral component (Churazov et al., 2001).
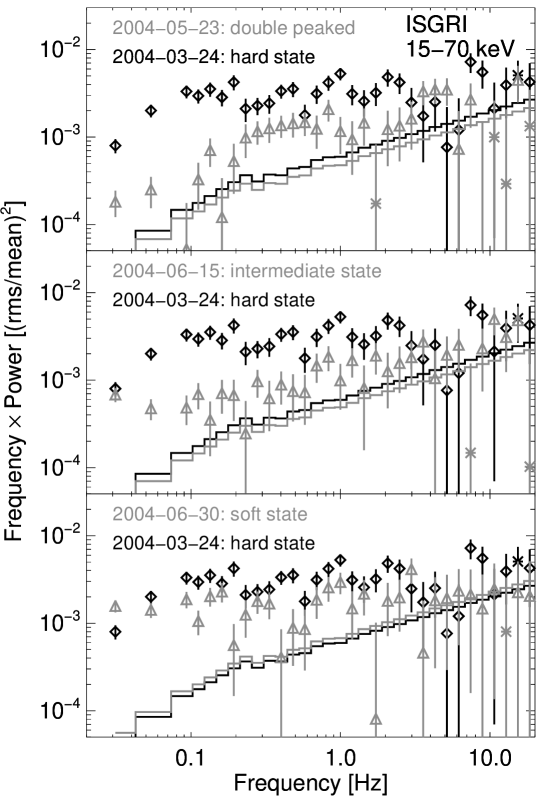
ISGRI observations within the same day or within a few days of the PCA measurements of Fig. 3 are available. The corresponding 15–70 keV ISGRI power spectra (Fig. 4) follow the same general sequence as the PCA power spectra, the characteristic differences between the different states being especially apparent at frequencies below 0.1 Hz: the hard state variability is the strongest with the soft state one almost at the same level. Before the intermediate state is reached the double peak form is roughly visible. Also consistent with the PCA the intermediate state is less variable, too close to the effective noise level to see the “enhanced time lag peak”. However, the expected power at low frequencies is apparent in the intermediate state and also in the soft state. Unfortunately, averaging the ISGRI power spectra over more than one pointing for clearer results is not possible with this limited but dynamic data set. The same is true for power spectra above 70 keV or in narrower energy bands. A multi-wavelength observation campaign of Cyg X-1 is planned for fall 2004 and with 320 ks of INTEGRAL data should provide this opportunity, however.
4 Summary & Conclusions
-
•
Contemporary INTEGRAL-ISGRI and RXTE-PCA 15–70 keV power spectra of Cyg X-1 are consistent in shape (data up to 2003–02–09 have to be rise-time filtered and suffer from additional instrumental effects).
-
•
Before deriving absolute rms values from the ISGRI power spectra, a background correction is required. In the case of Cyg X-1 the uncorrected power is an order of magnitude too low. A better characterization of the background influence is work in progress.
-
•
This is one of only a few studies effectively accessing energies above the RXTE-PCA range. The fact that the same power spectral shape is observed for both instruments means that it does not change much between 20 and 40 keV and is clearly attributed to coronal emission. Even higher energies will be accessible with the upcoming INTEGRAL observations and maybe also with a careful analysis of the PV phase data.
-
•
The peak at 4–8 Hz in the power spectrum dominates the transitional states at all PCA energies while other components only play a role in the soft band. The additional association with enhanced time lags and radio flaring speaks for an origin in or near the jet forming region.
Acknowledgments
This work has been financed by Deutsches Zentrum für Luft- und Raumfahrt grants 50 OG 95030, 50 OG 9601, and 50 OG 302 as well as the KBN grants PBZ-KBN-054/P03/2001, and 1P03D01827. We thank all people involved in building and calibrating INTEGRAL for their efforts, and E. Smith and J. Swank for the very smooth scheduling of the RXTE observations.
References
- Churazov et al. (2001) Churazov, E., Gilfanov, M., Revnivtsev, M. Soft state of Cygnus X-1: stable disc and unstable corona. Mon. Not. Roy. Astron. Soc. 321, 759–766, 2001.
- Kalemci et al. (2004) Kalemci, E., Tomsick, J.A., Rothschild, R.E., et al. A Close Look at the State Transitions of Galactic Black Hole Transients during Outburst Decay. Astrophys. J. 603, 231–241, 2004.
- Leahy et al. (1983) Leahy, D.A., Darbro, W., Elsner, R.F., et al. On searches for pulsed emission with application to four globular cluster X-ray sources: NGC 1851, 6441, 6624, and 6712. Astrophys. J. 266, 160–170, 1983.
- Lebrun et al. (2003) Lebrun, F., Leray, J.P., Lavocat, P., et al. ISGRI: The INTEGRAL Soft Gamma-Ray Imager. Astron. Astrophys. 411, L141–L148 , 2003.
- Miyamoto et al. (1992) Miyamoto, S., Kitamoto, S., Iga, S., et al. Canonical time variations of X-rays from black hole candidates in the low-intensity state. Astrophys. J. 391, L21–L24, 1992.
- Nowak et al. (1999) Nowak, M.A., Vaughan, B.A., Wilms, J., et al. Rossi X-Ray Timing Explorer Observation of Cygnus X-1: II. Timing Analysis. Astrophys. J. 510, 874–891, 1999.
- Pottschmidt et al. (2003) Pottschmidt, K., Wilms, J., Nowak, M.A., et al. Long term variability of Cygnus X-1 I. X-ray spectral-temporal correlations in the hard state. Astron. Astrophys. 407, 1039–1058, 2003.
- Wilms et al. (2005) Wilms, J., Nowak, M.A., Pottschmidt K., et al. Long term variability of Cygnus X-1 IV. Spectral evolution. In preparation for Astron. Astrophys. 2005.
- Winkler et al. (2003) Winkler, C., Courvoisier, T.J.-L., Di Cocco, G., et al. The INTEGRAL mission. Astron. Astrophys. 411, L1–L6, 2003.